Running head: GAMBLING ACTIVITIES OF YOUNG AUSTRALIANS
Gambling activities of young Australians: Developing a model of behaviour
Susan M. Moore & Keis Ohtsuka
Victoria University, Australia
Abstract
As more gambling venues open in Australia, youth gambling as problem behaviour has been identified. The aim of this study was to assess youth gambling in a population with easy access to gambling, and to evaluate the adequacy of a model for predicting adolescent gambling frequency and problem gambling. The model comprised a combination of the Theory of Reasoned Action (TRA) (Ajzen & Fishbein, 1980), personality variables (venturesomeness, impulsiveness), and cognitive bias variables derived from Weinstein’s (1980) propositions concerning unrealistic optimism about future life events. A sample of 1017 school- and university-based adolescents indicated relatively low frequencies of gambling and low scores on the problem gambling scale, with males scoring higher than females on both measures. The TRA was supported with about 30% of the variance of each of gambling behaviour and
Risky behaviour includes actions which involve potentially negative consequences, balanced by perceived positive consequences. For example, smoking is hazardous to health yet adolescents smoke for reasons such as pleasure, relaxation, and peer approval. In fact,
adolescents are known to engage in many activities such as substance abuse, binge drinking, dietary fads, unsafe sexual practices and dangerous driving which are risky, given the above definition (Moore & Rosenthal, 1991, 1992, 1993). The positive consequences of these behaviours appear to be pleasure, peer acceptance, and satisfaction of needs - the negative outcomes are for the most part well publicised and understood (Moore & Gullone, 1996). Many of these health-compromising risks and their predictors have been studied in detail among the adolescent population (e.g., Bell & Bell, 1993; Jessor & Jessor, 1977). One
particular risky behaviour, of increasing concern among community workers in Australia, but which has received little systematic attention, is youth gambling. Although not health
compromising in the same way as other behaviours, its potential for producing personal and social disharmony is widely acknowledged.
Gambling as an adult pastime is well entrenched in Australian culture. In 1993,
Australians spent six billion dollars gambling on horse racing, gaming machines, and lotteries (Buchanan, 1994), a high national expenditure given the relatively small population of
Australia (17 million). All state capitals have casinos, and legal poker machines are readily accessible in sporting clubs, social clubs and hotels. States receive a large amount of their revenue (up to 14%) from gambling sources and they are widely advertised, so there exists more than tacit official approval for their existence. Disapproval of excessive gambling is occasionally expressed in the media, but this disapproval tends to be for the individuals who lack control rather than for the gambling activity per se.
In short, public acceptance of gambling is high. It is readily available to young people, and often conducted in venues which provide opportunities for pleasant socialising. Betting on poker machines, horse racing and lotteries is illegal for those under 18, however, as for
excitement, and (sometimes) lowered levels of impulse control (e.g., Moore & Rosenthal, 1993), the potential for unhealthy outcomes becomes apparent. To what extent does gambling occupy an unacceptably large place among the leisure activities of young people? To what extent are young people finding themselves in financial difficulty because of gambling? What personal and social factors are predictive of problem gambling among young people?
Fisher (1993) surveyed 460 secondary school students (ages 11 - 16) in the United Kingdom to explore the prevalence of fruit machine gambling. She found that 62% of the sample had gambled on these machines, 17% did so at least weekly, and 6% to a point she defined as pathological. Cigarette smoking, alcohol use, and parental gambling were associated with pathological gambling activity among these teenagers. Arcuri, Lester and Smith’s (1985) study of over 1000 American high school students also indicated that more than 60% had gambled, as did a survey of gambling habits of 702 adolescents aged 15 to 18 years in Minnesota, USA (Winters, Stinchfield, & Fulkerson, 1993). Nine per cent of these young people were classified by the authors as problem gamblers. In a comparative study in 1995, the rates were shown to have decreased only slightly (Stinchfield, Cassuto, Winters, & Latimer, 1997). A meta-analysis of adolescent gambling studies from the USA and Canada (Shaffer & Hall, 1996) revealed that between 9.9 and 14.2 % of adolescents are at risk of developing or returning to serious gambling problems.
Surveys from the USA suggest that gender is a consistent predictor of gambling
differences in gambling among young Australian men and women do not appear to have been targeted by researchers to date, and will be investigated as part of the current study.
Among Australians, folklore and data on amount spent on legal gambling (Buchanan, 1994) suggests at least occasional gambling to be a normative behaviour among adults, but little is known about the gambling norms of young people. Problem gambling rates are difficult to ascertain, as this information is usually inferred from monitoring numbers of people who seek help for problems (e.g., Coman, 1996), rather than from population surveys. Walker (1996) claims that reported estimates of problem gambling in Australia are currently unreliable, ranging from 0.1% to 13% depending on the methodologies and samples used. The recent rapid increase in legal gambling possibilities in Australia make normative data even more difficult to ascertain. One aim of the current study is to assess normative gambling rates and self-reported problem gambling among young people in the mid-late adolescent age range. A second aim is to examine potential predictors of both gambling behaviour and problem gambling through measurement of relevant personal factors, social attitudes and norms.
A useful theoretical framework from which to begin such an investigation is provided by Ajzen and Fishbein's (1980) Theory of Reasoned Action (TRA). This model postulates
relationships between engaging in a behaviour and attitudes toward it, knowledge/ beliefs about its likely outcomes, and intentions with respect to carrying out the behaviour in question. In this model, intention to perform a behaviour is the immediate antecedent of that behaviour.
model has been shown to successfully predict a wide range of behaviours, including voting choice (Bowman & Fishbein, 1978) and wearing safety helmets (Allegrante, Mortimer, & O’Rourke, 1980).
There is some indication from past research that the ‘beliefs about winning’ amongst adolescents are subject to a range of cognitive distortions. For example, Weinstein (1980) theorises such distortions in his discussions of unrealistic optimism. His thesis is that we underestimate the likelihood of future unpleasant events and overestimate the likelihood of future pleasant events. Several event characteristics moderate this tendency. The first of these is perceived undesirability. An individual perceives events judged as more unpleasant as less likely to happen to him or her, and vice versa for pleasant events. The prediction for gambling therefore would be that individuals would judge their likelihood of winning large amounts as greater than that of their peers, the reverse being the case for losing large amounts. Perceived frequency of the event in the population also predicts perceived vulnerability to that event in Weinstein’s model. In the case of gambling, individuals’ perceptions of the chances or odds of winning, would influence their beliefs about their own likelihood of success. Of particular interest here is research which indicates that young people overestimate the likelihood of scoring a lucrative jackpot on fruit machines, believing that these machines pay out more than is actually the case (Griffiths, 1990, 1993).
Perceived control over the event is a further potential predictor. Thus those who believe that poker machines and other forms of gambling involve some skill see themselves as having greater chances of winning if they believe they possess the skills necessary to influence the outcome. In relation to this, the myth that the outcome of poker machine gambling can be influenced by a particular style of playing existed among youthful gamblers in Griffiths’ (1990) British study of eight self-confessed young fruit machine addicts. Derevensky, Gupta, and Della Cioppa’s (1996) laboratory study showed that Canadian children in Grades 4, 6, and 8 also demonstrated, at this early age, an illusion of control associated with gambling.
influence an individual’s beliefs about winning (or losing). Finally, stereotyping, or beliefs that only certain types of people win at gambling (for example, people who are ‘born lucky’) is also postulated to influence perceptions of the likelihood of winning. Evaluation of the Weinstein model in predicting beliefs about winning and losing will be tested in this study. This model is consistent with, and extends and elaborates on the Theory of Reasoned Action. The two frameworks together will provide a more comprehensive model for testing predictors of gambling behaviour among adolescents.
A further elaboration of the framework incorporates personality variables as potential predictors of gambling. Powell, Hardoon, Derevensky, and Gupta (1996) found risk-taking in general to be highly correlated with gambling among university students, suggesting underlying personality variables as potentially relevant explanatory concepts for gambling. Certainly, several personality variables have been associated with risk-taking. For example, the trait of sensation seeking (Zuckerman, 1979), defined as the "need for varied, novel, and complex sensations and experiences and the willingness to take physical and social risks for the sake of such experience" (Zuckerman, 1979, p. 10), correlates with a range of risky behaviours among adolescents (Arnett, 1994). The role of sensation seeking is controversial one, however,
smoking behaviour), driver risk (dangerous driving), and passenger risk (accompanying a dangerous driver) (Moore & Rosenthal, 1993). Surprisingly, the trait of impulsiveness –– which could be conceptualized as an element of sensation seeking –– was unrelated to these activities. In the current study, the links of both problem gambling and gambling frequency with
impulsiveness and venturesomeness will be explored.
In summary, this study will describe youth gambling behaviours, attitudes, beliefs and social norms, and compare males and females, with respect to these variables. Comparisons between adolescents (under 18 years), for which commercial gambling activities are illegal, and young adults (18 years and over), for whom gambling is legal, will be made. The efficacy of a model for predicting gambling behaviour, which incorporates personality factors, the attitude, social norm and intention variables elaborated in TRA, and Weinstein’s model of cognitive bias, will be assessed.
Method Participants
The sample comprised 1017 young people aged between 14 and 25 years (435 males; 577 females, 5 unreported gender). Participants were volunteers from Years 10, 11 and 12 of six secondary schools and first year undergraduates from four geographically separate campuses of a university in Melbourne, Australia. The university and the schools were all situated in the western suburbs of Melbourne, a predominantly working class area. Usable data was obtained from 757 participants in the school sample (344 boys and 413 girls) and 250 participants in the university sample (86 men and 164 women). The mean age of the school sample was 16.3 years (SD= 1.2 years); the mean age of the university sample was 19.2 years (SD= 1.8 years); the mean age for the total sample was 17.0 years (SD= 1.9 years).
Measures
through 12 items regarding beliefs about winning and losing. In addition, problem gambling was assessed using a modified version of the South Oaks Gambling Screen (Lesieur & Blume, 1987) adapted to Australian conditions and to a standard answer format. Data on age and sex were also collected.
Gambling Attitudes. This measure consisted of 12 statements to which participants responded either strongly agree (5), agree (4), not sure (3), disagree (2), or strongly disagree (1). Example items include ‘moderate gambling is harmless’, and ‘gambling should be controlled by law so people don’t overdo it’. With appropriate reversals, items were summed to produce a scale for which scores range between 12 and 60, and high scores represent positive attitudes to gambling. The Cronbach alpha reliability measured in a previous study (Moore & Ohtsuka, 1997) was 0.79. The attitude measure in this study incorporates both the belief and the cost/benefit elements of the TRA model through the use of evaluative belief statements.
Subjective Norms. This measure comprised 12 statements about perceived family and peer norms with respect to gambling, plus statements assessing motivation to comply with those norms (Generally I try to fit in with what my friends want; Generally I try to fit in with what my family wants). All statements were responded to on a 5 point Likert scale as for the attitude measure. The family normative beliefs scale was made up of the addition of the 7 family items (with appropriate reversals) and the peer normative beliefs scale was similarly constructed from the 5 peer items. To provide a measure of subjective norms, the normative beliefs items and the motivation to comply items were combined in the manner suggested by Ajzen and Madden (1986), that is, by multiplying the beliefs of each specific referent group (family, friends) by the motivation to comply with those referents. The two measures were added together to create a single measure of subjective norms. The Cronbach alpha reliability of this scale has been reported previously as 0.69 (Moore & Ohtsuka, 1997). High scores on the measure reflect a perception of positive social norms toward gambling and the desire to fit in with these norms. Scores range between 12 and 300.
weeks I intend to play poker machines; In the next two weeks I intend to buy a lottery ticket. The Cronbach alpha reliability for this scale has been reported as 0.80(Moore & Ohtsuka, 1997).
Gambling behaviour. This was assessed through two measures, the first concerning frequencies of 10 different types of gambling, for example, playing cards, using poker
machines, buying lottery tickets, and the second requesting information on the largest amount of money the participant had ever gambled in one week (ranging in increments from $0, less than $10, between $10 and $99, between $100 and $499, between $500 and $999, between $1000 and $4999, more than $5000). For the frequency measure, which was used in later regression analyses, the rating scale for each type of gambling ranged through 0= never participated, 1= once a year, 2= more than once/year. less than once/month, 3= more than once/month but less than once/week, to 4= once a week or more. The range of scores was 0 to 40, with high scores representing higher frequencies of gambling.The Cronbach alpha
reliability coefficient for the scale was 0.71 in a previous study(Moore & Ohtsuka, 1997). Problem Gambling. A modified version of the South Oaks Gambling Screen (Lesieur & Blume, 1987) was used as the measure of problem gambling, with statements in the screen adapted to the Australian idiom and to the age of the population (as in the case of the South Oaks Gambling Screen–Revised Adolescent (SOGS-RA) of Winters, Stinchfield, and
Fulkerson, 1993). Idiom alterations included changing the word “intend” to “meant”, and the phrase “skipped or been absent” (from school or work) to “took time off” (from school or work). Age-related alterations involved changing the item concerning keeping the amount of gambling secret from “spouse, children, and other important people” to “family and friends” (as per the SOGS-RA). The major change was that a 5-point Likert scale (strongly agree to
strongly disagree) was applied to the problem gambling statements, to maintain consistency in response requirements across the questionnaire. This change was considered important because the questionnaire was long and there was a need to make it as simple as possible for
Ohtsuka, 1997). The modified scale can be interpreted as providing a continuous measure of problem gambling readily administered for research purposes, but it is important to note that it does not supply data that are directly comparable with either the SOGS or the SOGS-RA.
Cognitive bias variables. Questions were designed to assess Weinstein’s (1980) event characteristics, postulated to relate to beliefs about winning and losing. Cognitive bias variables measured were: (a) perceptions about likelihood of winning/losing at gambling in relation to other people (rated from 1= much less chance to 5= much better chance), (b) beliefs about the population frequency of heavy wins/losses (rated from 1= about 10% through 5%, 1%, 0.5%, to 5 = less than 0.5%), (c) beliefs about personal control over winning/losing (rated from 1= strongly disagree that ‘I feel in control over whether I win/lose at gambling’ through 5 = strongly agree), (d) perceived un/desirability of losses/wins (rated from 1= unhappy through no different, happy, very happy to 5= the happiest I could be for wins, and 1= happy, through no different, unhappy, very unhappy, to 5= the unhappiest I could be for losses), (e) personal knowledge of big winners/losers at gambling (rated from 2= ‘yes more than one person’, through 1= ‘yes one person’ to 0 = no), and (f) stereotyping of winners/losers (rated from 1= strongly disagree that ‘There is a definite type of person who has big wins/losses at gambling’ to 5 = strongly agree).
Procedure
For the school sample permission to approach schools was obtained from the relevant state body. Ten western suburbs principals were requested to allow the research to proceed in their schools. Three did not agree because of the time commitment required of students and teachers within an already busy school calendar. At the seven schools which approved the research, the research assistant negotiated the most convenient way of collecting the data. In all cases but one, teachers chose to administer the questionnaire themselves, after discussions had occurred about appropriate procedure. In the exceptional case, a suitable time for the survey to be administered could not be negotiated, and the school year came to an end without the data having been collected. In each of the participating six schools, the aim was to survey one class at each of the Year 10, 11, and 12 levels, and this aim was largely achieved. Students under 18 were given parental permission slips to be returned confirming approval to participate in the study. Volunteer students with parental permission (for the adolescents) were surveyed in class groups, while non-participating students within the class either engaged in other work or went to the library. The survey took 30 to 40 minutes to complete, and was anonymous.
The university sample were recruited by the research assistant who called for volunteers in large first-year lecture groups across four geographically distinct campuses of the university. Students who volunteered either took the questionnaires and returned them the following week, or completed them at the end of the lecture.
Results Descriptive analysis
Attitudes. Young people were ambivalent in their attitudes to gambling. On the one hand, 70.3% approved of some gambling being legal, 50.5% agreed that they ‘basically approved of gambling’ and 53.2% said ‘moderate gambling is harmless’. On the other hand, 66.9% agreed that ‘there is too much gambling today’, and 71.3% thought ‘gambling should be controlled by law so people don’t overdo it’.
gambling’(38.0%). The perceived disapproval rate for gambling was low among both friends (13.1%) and family (33.2%) with even lower rates (6.1% and 10%) for buying a lottery ticket . Thus social norms appeared to be relatively supportive of gambling, or at least not
disapproving.
Cognitive Biases. Most young people assessed their chances of a “big” win at gambling (defined subjectively by the participants) as being the same as other people’s (62.2%), or less (33.6%). Only 4.2% thought they had a better chance than others. Perceived chance of losing followed a similar pattern with most seeing their chances as average (60.9%), a sizeable number pessimistically believing they were more likely to lose than the average (21.4%) and only 17.7% believing they were less likely to sustain a big loss than others.
In terms of beliefs about how many people in the population have big wins at gambling, the most common estimate was 5% (31.6%), with 1% being the next most common estimate (26.8%). Most opted for 10% (65.6%).
On the whole, young people thought that a perceived big win would make them feel happy or very happy (68.6%) but not necessarily the happiest they could be (21.9%). Similar feelings were evident about having a perceived big loss, with most feeling it would make them unhappy or very unhappy (64.8%) but fewer thinking this would make them the unhappiest they could be (20.5%).
About two thirds of the sample said they knew one or more big gambling winners, and just over half knew one or more persons who had experienced a big loss. Only 12.1% had a stereotype of a big winner, with the rest not sure or holding no stereotype. However the image of a big loser was somewhat stronger, with 20% perceiving such a stereotype.
Finally, with respect to perceived control over gambling wins and losses, 17.5% thought they exhibited some control over whether they won at gambling and 18.3% perceived some control over losing.
gambling frequency scale, which ranged from 0 to 40, was 6.34 (SD = 5.24). With respect to the largest amount of money spent on gambling in a week, the largest group stated this was between $1 and $10 (45.1%), while 25.4% had spent between $10 and $99. Only a very small number (5%) had spent more than $99 in any one week, and approximately one-quarter of young people (24.5%) did not gamble at all. The correlation between gambling frequency and largest amount gambled in a week was r = 0.62 (p < .001).
Problem gambling. Table 2 shows the percentage of respondents who agreed or strongly agreed with the various items in the problem gambling scale. On the first item, very few young people classified themselves as problem gamblers (only about 3%), but a greater frequency had gambled more than they meant to, or chased losses. The mean score on the problem gambling scale, encompassing the ten items (potential range from 10 to 50), was 15.46 (SD = 7.33). The correlation between gambling frequency and problem gambling was statistically significant but low (r = 0.27, p < .05).
Age differences. Comparisons were made between those under the legal gambling age of 18 (n= 698) and those 18 and above (n= 319) on gambling behaviours and associated variables. There were few significant differences. Older youth showed a slight but significantly higher frequency of gambling (Younger group M= 6.06, Older group M= 6.92, F(1, 1015) = 5.94, p< .05), a higher intention to gamble (Younger group M= 13.36, Older group M= 14.18, F(1, 1011) = 4.74, p< .05) but no differences on problem gambling. Impulsiveness and
venturesomeness were significantly higher among the younger group, as was reported knowledge of a big winner (Impulsiveness: Younger group M= 5.39, Older group M= 4.56, F(1, 1012) = 15.69, p< .001; Venturesomeness: Younger group M= 7.73, Older group M= 6.84, F(1, 1012) = 20.74, p< .001; Know winner: Younger group M= 1.03, Older group M= 0.85, F(1, 1004) = 9.94, p< .01). There were no other age differences on the variables.
(F(1, 992) =14.96, p< .0001). Younger adolescents were more likely to play bingo (F(1, 1002) = 15.25, p< .0001) and play pool or similar games for money (F(1, 999) = 16.12, p< .001).
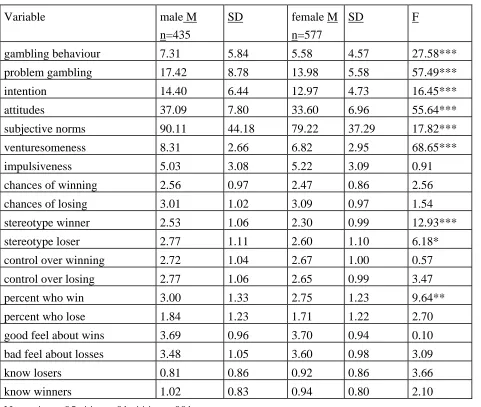
Gender Differences. Table 3 shows the large number of significant gender differences with respect to gambling behaviours and potential predictors of gambling. Boys engaged in more gambling behaviour than girls, and scored significantly higher on the problem gambling scale. Their attitudes to gambling were more positive, their subjective norms more
pro-gambling, and they had a stronger intention to gamble in the future than girls. Boys scored higher on the personality variable of venturesomeness, but interestingly, not on impulsiveness. They had more definite stereotypes of winners and losers, and believed that more people are likely to be big winners than did girls. Because of the large number of gender differences on the variables in this study, the regression analyses to follow were carried out separately for the sexes.
With respect to different types of gambling, t tests indicated that boys were significantly more likely than girls to play cards for money (t(792.05) = 6.90, p< .001); bet on pool games (t(791.56) = 7.64, p< .001); bet on horses or dogs (t(714.28) = 6.57, p< .001); gamble on sports (t(847.55) = 5.36, p< .001); bet at casino gaming tables (t(702.67) = 3.15, p< .01); and play poker machines at sporting clubs (t(828.15) = 2.59, p= .01). Girls were more likely than boys to play bingo (t(984.09) = 3.34, p=.001) or buy lottery tickets (t(995) = 2.10, p< .05). There were no significant differences between males and females on extent of gambling at hotel or Casino poker machines.
Predictors of gambling behaviour and problem gambling
Hierarchical regression analyses were carried out, separately by gender, to assess predictors of gambling intention, gambling frequency, and problem gambling (Tables 4, 5, 6). The general procedure was to test the TRA model first, then add other variables in groups and assess their added contribution to the predictive variance. Thus, in attempting to predict intention, the role of attitudes and subjective norms was tested; the personality variables were then incorporated into the regression model, followed by the cognitive bias variables. The same procedure was carried out for gambling frequency and problem gambling, with the one
the results of these regression analyses by listing the beta weights for all variables in each regression model, indicating the significance of the regression models and of individually significant predictors, and showing the percentage of variance accounted for by each regression model (through the adjusted R2 statistic).
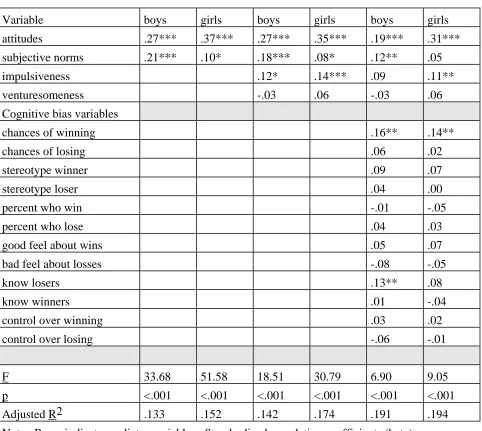
Intention to gamble in the future (see Table 4) was significantly predicted by attitudes and subjective norms with respect to gambling, but with only a moderate percentage of the variance accounted for (13% for boys and 15% for girls). The predictive effect of subjective norms for girls was weaker than for boys, and in fact was washed out when the other variables were added in to the regressions. Addition of the personality and cognitive bias variables added only
minimally to the power of attitudes and subjective norm to predict intention to gamble (5.8% extra variance was accounted for boys and 4.2% for girls). Impulsiveness predicted intention, more strongly for girls than boys, but venturesomeness had little influence. Of the cognitive bias variables, few were significant predictors of intention to gamble. Higher perceived chance of winning predicted stronger intention to gamble. For boys only, those with greater intentions to gamble were more likely to know someone who had lost heavily at gambling, an indication perhaps of mixing more frequently in gambling circles (rather than necessarily a cognitive influence as hypothesised).
Gambling frequency (see Table 5) was predicted most strongly by intention to gamble, as would be expected from the TRA model. Other variables significantly supplemented the
attitudes, subjective norms, personality, and cognitive biases predicted nearly 40% and 45% of the variance for boys and girls, respectively.
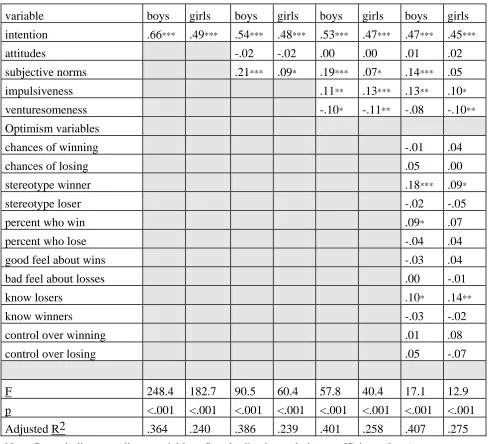
Problem gambling (see Table 6), measured as a continuous variable, was significantly predicted by intention to gamble for both boys and girls, with 36% of the variance accounted for in the case of boys, but only 24% for girls. Addition of all the other variables made little difference to prediction accuracy, adding only about 4% for each sex. Significant individual predictors of problem gambling (over and above intention) were subjective norms (weaker for girls), (high) impulsiveness, (low) venturesomeness, knowing a loser, and holding a stereotype of the kind of person who has big wins. In addition, boys who scored higher on the problem gambling scale tended to estimate a higher percentage of big winners in the population than did their peers. Overall, prediction of problem gambling using the intentions, attitudes, subjective norms, personality, and cognitive bias variables was less successful than prediction of gambling frequency.
Discussion Gambling norms among the youth
On the whole, this large and relatively representative sample of working class-lower middle class young people, living in areas with many opportunities for gambling, exhibited quite low levels of both gambling behaviour and of problem gambling. Few young people scored high on the problem gambling scale, and only about 3% classified themselves as
experience of negative consequences was only moderate, indicating that gambling need not be associated with undesirable outcomes or feelings.
On the other hand, among the young people in the current sample, a greater number had gambled more than they meant to (14%), or chased losses (29%). Occasional gambling was normative, with most having experienced gambling within the family and/or among their peer group. Frequency of gambling activity was almost as high in the under 18 age group, for which commercial gambling activities are illegal, as in the older ‘legalised’ group. In addition, while a 3% problem gambling rate is statistically low, it represents higher levels of troublesome behaviour (and associated distress) than would be desirable in any group of people, let alone such a youthful population.
Consideration of ‘unrealistic optimism’ about gambling, or possible cognitive biases associated with it, produced similarly complex results in the sense that young people appeared quite logical about their gambling for the most part, yet there was some evidence of possible distorted thinking. The sample realistically expressed relative pessimism about their chances of winning/losing at gambling, although they probably over-rated the percentage of big winners and losers in the population, depending of course how this is defined. Most of the sample viewed winning or losing ‘in perspective’ emotionally, that is, winning or losing was judged as important but not the most important thing in life.While most were realistic in their assessment that they had little control over whether they won or lost at gambling, almost 20% did perceive some control. Ultimately, these perceptions did not relate to gambling frequency or problem gambling as predicted. It is possible that the question of control could have been interpreted by some as a question of control over whether to gamble and when to stop, rather than as
females, were also greater gamblers and perceived more control over chance events (Ladouceur, 1995).
Gender differences in the sample showed overall lower rates of gambling and problem gambling among young women than young men. Boys were also more likely to intend to gamble, express positive attitudes toward the activity, and perceive supportive social norms. However the data did not indicate that gambling was a non-issue for young women. While boys were more likely to gamble in traditional gambling venues such as race tracks and sporting clubs, girls equalled or exceeded boys’ gambling rates in forms of gambling which provide equal access to women (and a relatively safe leisure environment), such as poker machines in hotels or at the Casino. In this finding, the study replicates the results of American researchers who found that gambling behaviour followed traditional sex-role patterns (Lesieur & Blume, 1991; Lindgren et al., 1987), and a recent Australian study of adult poker machine players (Ohtsuka et al., 1997). In addition, our data showed it was easier to predict problem gambling among boys than among girls, given the predictive model we used. Obviously other factors which we did not measure in this study are at work in the evolution of problem gambling among girls.
Testing the model
The prediction of gambling using our combined model of attitudes, norms, intentions, personality and cognitive factors was rather successful, particularly the prediction of gambling frequency. There was strong support for the TRA, which is interesting, because as a theory of reasoned action, it was not designed to predict behaviour that is out of control and non-rational. Yet a sizeable percentage of the variance of gambling behaviour was accounted for by this model, especially in its modified form incorporating both the direct and indirect (through intention) effects of attitudes and norms. Similarly, problem gambling for boys (but not girls) was quite well predicted by the TRA. The fact that in this sample, the range of scores for girls on the problem gambling scale was very limited, with few scoring high, restricts the
problems in the extent of their gambling behaviour. The implication for intervention is to either change the social esteem in which gambling is held (as has occurred for smoking), or work within the current social climate to assist individuals with strategies for keeping their leisure gambling within limits.
Personality variables of the sensation-seeking variety also predicted gambling, with venturesomeness relating to gambling frequency and impulsiveness to problem gambling for both sexes and gambling frequency for girls only. The desire to experiment reflected in the venturesomeness variable is part of a healthy adolescence and youth, and it is not surprising that those who enjoy experimenting with new things will also want to try various forms of gambling. Experimenting in this way does not inevitably lead to problems, in fact the more adventurous individuals were significantly less likely to score high on the problem gambling scale. They are perhaps, more likely to be trying a range of activities, rather than getting hooked on any one activity. The impulsiveness link with problem gambling suggests
difficulties with control, in the sense of difficulties in managing to place the exigencies of the moment (the desire to win) in a context of long term gratifications and goals. That the younger sample was more impulsive than the older rings warning bells with respect to the need to ensure that younger individuals are restricted in their gambling activities. In this sample, age had only a minor influence on the amount of gambling which occurred, and certain types of gambling were actually more common among the younger than the older group.
intermediary in the belief that anyone can win. For problem gambling, the cognitive bias variables added little to the predictive value of the regression equation for either girls or boys. Before firm conclusions can be drawn, it would seem important to further research the
influence of these variables using a sample specifically selected to include a higher percentage of problem gamblers.
While the results of self-report studies such as this are always limited by factors such as the insight and honesty of the respondents, evidence for external validity of this study arises from the extent to which the normative and gender difference findings align with those of overseas studies. In addition, the relative esteem in which gambling appears to be held by these young people (and their families and friends) should work to limit the under-reporting of gambling activity in this sample.
References
Allegrante, J. P., Mortimer, R. G., & O’Rourke, T. W. (1980). Social psychological factors in motorcycle safety research: Implications for public policy. Journal of Safety Research, 12, 115-126.
Ajzen, I., & Fishbein, M. (1980). Understanding attitudes and predicting social behavior. Upper Saddle River, NJ: Prentice-Hall.
Ajzen, I., & Madden, T. J. (1986). Prediction of goal directed behavior: Attitudes, intentions, and perceived behavioral control. Journal of Experimental Social Psychology, 22, 453-474.
Anderson, G., & Brown, I. R. (1984). Real and laboratory sensation-seeking and arousal. British Journal of Psychology, 75, 401-410.
Arcuri, A. F., Lester, D., & Smith, F. O. (1985). Shaping adolescent gambling behavior. Adolescence, 20, 935-938.
Arnett, J. (1994). Sensation seeking: A new conceptualization and a new scale. Personality and Individual Differences, 16, 289-296.
Bell, N. J., & Bell, R. W. (Eds). (1993). Adolescent risk taking. Newbury Park, CA: Sage.
Blaszczynski, A., Wilson, A. C., & McConaghy, N. (1986). Sensation seeking and pathological gambling. British Journal of Addiction, 81,113-117.
Bowman, C. H., & Fishbein, M. (1978). Understanding public reactions to energy
proposals: An application of the Fishbein model. Journal of Applied Social Psychology, 8, 319- 340.
Buchanan, R. (1994, July 16). How gambling is changing us. The Age, pp. 16, 18. Coman, G. ( 1996, November). G/Line: The year in review. Paper presented at Seventh National Conference of the National Association for Gambling Studies, Glenelg, South Australia.
Eysenck, S., Pearson, P., Easting, G., & Allsopp, J. (1985). Age norms for impulsiveness, venturesomeness and empathy in adults. Personality and Individual Differences, 6, 613-619.
Fisher, S. (1993). Gambling and pathological gambling in adolescents. Journal of Gambling Studies, 9, 277-288.
Griffiths, M. (1990). The cognitive psychology of gambling. Journal of Gambling Studies, 6, 31-42.
Griffiths, M. (1993). Factors in problem adolescent fruit machine gambling. Journal of Gambling Studies, 9, 31-45.
Griffiths, M. (1995). Adolescent gambling. London: Routledge.
Hraba, J., Mok, W., & Huff, D. (1990). Lottery play and problem gambling. Special Issue: Lotteries. Journal of Gambling Studies, 6, 355-377.
Jessor, S. L., & Jessor, R. (1977). Problem behavior and psychosocial development: A longitudinal study of youth. New York: Academic Press.
Kuley, N. B., & Jacobs, D. F. (1988). The relationship between dissociative-like experienes and sensation-seeking among social and problem gamblers. Journal of Gambling Behavior, 4, 197-207.
Ladouceur, R. (1995). Prevalence of pathological gambling and associated problems in individuals who visit non-gambling video arcades. Journal of Gambling Studies, 11, 361-365.
Lesieur, H. R., & Blume, S. B. (1987). The South Oaks Gambling Screen (SOGS): A new instrument for identification of pathological gamblers. American Journal of Psychiatry, 144, 1184-1188.
Lesieur, H. R., & Blume, S. B. (1991). When lady luck loses: Women and compulsive gambling. In N. Van Den Bergh (Ed.), Feminist perspectives on addictions (pp. 181-197). New York: Springer.
Lindgren, H. E., Youngs, G. A., MacDonald, T. D., Klenow, D. J., & Schriner, E. C. (1987). The impact of gender on gambling attitudes and behavior. Journal of Gambling Behavior, 3, 155-167.
Moore, S. M., & Ohtsuka, K. (1997, in press). Gambling behaviour and problem gambling: What is normal? Proceedings of NAGS Conference, Glenelg, South Australia, November 1996.
Moore, S. M., & Rosenthal, D. A. (1991). Condoms and coitus: Adolescent attitudes to AIDS and safe sex behavior. Journal of Adolescence, 14, 211-27.
Moore, S. M., & Rosenthal, D. A. (1992). Australian adolescents' perceptions of health related risks. Journal of Adolescent Research, 7, 177-191.
Moore, S. M., & Rosenthal, D. (1993).Venturesomeness, impulsiveness, and risky behavior among older adolescents. Perceptual and Motor Skills, 76, 98.
Ohtsuka, K., Bruton, E., DeLuca, L., & Borg, V. (1997). Sex differences in pathological gambling using gaming machines. Psychological Reports, 80, 1051-1057.
Powell, G. J., Hardoon, K., Derevensky, J., & Gupta, R. (1996, September). Gambling and risk-taking behavior of university students. Paper presented at the annual meeting of the National Conference on Compulsive Gambling, Chicago.
Shaffer, H. J., & Hall, M. N. (1996). Estimating the prevalence of adolescent gambling disorders: A quantitative synthesis and guide toward standard gambling nomenclature. Journal of Gambling Studies, 12, 193-214.
Stinchfield, R., Cassuto, N., Winters, K., & Latimer, W. (1997). Prevalence of gambling among Minnesota public school students in 1992 and 1995. Journal of Gambling Studies, 13, 25-48.
Volberg, R. A. (1994). The prevalence and demographics of pathological gamblers: Implications for public health. American Journal of Public Health, 84, 237-241.
Volberg, R. A., & Steadman, H. J. (1988). Refining prevalence estimates of pathological gambling. American Journal of Psychiatry, 145, 502-505.
Volberg, R. A., & Steadman, H. J. (1989). Refining prevalence estimates of pathological gambling in New Jersey and Maryland. American Journal of Psychiatry, 146, 1618-1619.
Weinstein, N. D. (1980). Unrealistic optimism about future life events. Journal of Personality and Social Psychology, 39, 806-820.
Winters, K. C., Stinchfield, R. D., & Fulkerson, J. (1993). Toward the development of an adolescent gambling problem severity scale. Journal of Gambling Studies, 9, 63-84.
Author Notes
Susan M. Moore, Department of Psychology; Keis Ohtsuka, Department of Psychology. This research was supported by a grant from the Australian Research Council.
The authors thank Ms Karen Trevorrow for her research assistance during the course of the project.
An earlier version of part of this paper was presented as Ohtsuka, K., & Moore, S. M. (1997, June). Youth gambling in Australia: The prediction of behaviour from attitudes, perceived social support, and beliefs about winning at the Tenth International Conference on Gambling and Risk-Taking, Montreal, Canada.
Correspondence should be addressed to Susan Moore, Department of Psychology,
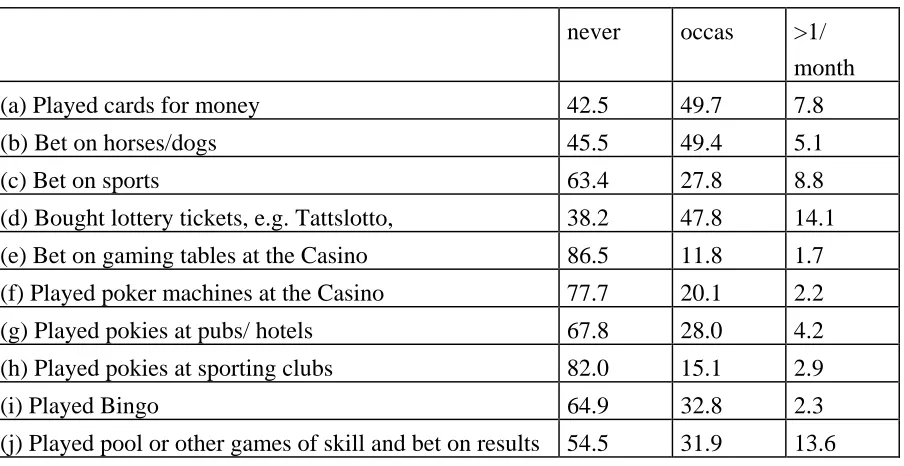
Table 1
Percentage of Young People Engaging in a Range of Gambling Behaviours (N=1017)
never occas >1/
month
(a) Played cards for money 42.5 49.7 7.8
(b) Bet on horses/dogs 45.5 49.4 5.1
(c) Bet on sports 63.4 27.8 8.8
(d) Bought lottery tickets, e.g. Tattslotto, 38.2 47.8 14.1 (e) Bet on gaming tables at the Casino 86.5 11.8 1.7 (f) Played poker machines at the Casino 77.7 20.1 2.2
(g) Played pokies at pubs/ hotels 67.8 28.0 4.2
(h) Played pokies at sporting clubs 82.0 15.1 2.9
(i) Played Bingo 64.9 32.8 2.3
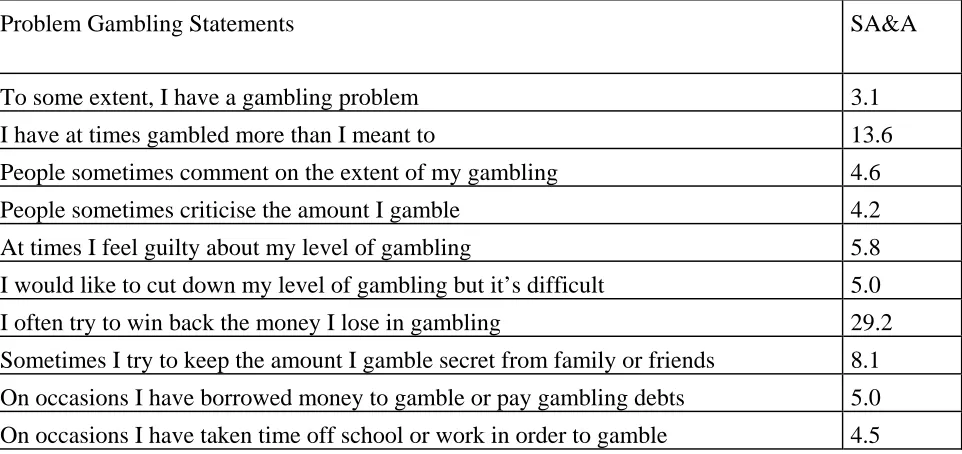
Table 2
Percentage of Young People who Agree/Strongly Agree with Problem Gambling Statements (N = 1017)
Problem Gambling Statements SA&A
To some extent, I have a gambling problem 3.1
I have at times gambled more than I meant to 13.6
People sometimes comment on the extent of my gambling 4.6
People sometimes criticise the amount I gamble 4.2
At times I feel guilty about my level of gambling 5.8
Table 3
Sex Differences in Gambling Behaviours and Related Variables
Variable male M
n=435
SD female M
n=577
SD F
gambling behaviour 7.31 5.84 5.58 4.57 27.58***
problem gambling 17.42 8.78 13.98 5.58 57.49***
intention 14.40 6.44 12.97 4.73 16.45***
attitudes 37.09 7.80 33.60 6.96 55.64***
subjective norms 90.11 44.18 79.22 37.29 17.82***
venturesomeness 8.31 2.66 6.82 2.95 68.65***
impulsiveness 5.03 3.08 5.22 3.09 0.91
chances of winning 2.56 0.97 2.47 0.86 2.56
chances of losing 3.01 1.02 3.09 0.97 1.54
stereotype winner 2.53 1.06 2.30 0.99 12.93***
stereotype loser 2.77 1.11 2.60 1.10 6.18*
control over winning 2.72 1.04 2.67 1.00 0.57
control over losing 2.77 1.06 2.65 0.99 3.47
percent who win 3.00 1.33 2.75 1.23 9.64**
percent who lose 1.84 1.23 1.71 1.22 2.70
good feel about wins 3.69 0.96 3.70 0.94 0.10
bad feel about losses 3.48 1.05 3.60 0.98 3.09
know losers 0.81 0.86 0.92 0.86 3.66
know winners 1.02 0.83 0.94 0.80 2.10
Table 4
Prediction of Intention to Gamble from Attitudes, Subjective Norms, Personality, and Cognitive Bias Variables: Results of Regression Analysis
Variable boys girls boys girls boys girls
attitudes .27*** .37*** .27*** .35*** .19*** .31***
subjective norms .21*** .10* .18*** .08* .12** .05
impulsiveness .12* .14*** .09 .11**
venturesomeness -.03 .06 -.03 .06
Cognitive bias variables
chances of winning .16** .14**
chances of losing .06 .02
stereotype winner .09 .07
stereotype loser .04 .00
percent who win -.01 -.05
percent who lose .04 .03
good feel about wins .05 .07
bad feel about losses -.08 -.05
know losers .13** .08
know winners .01 -.04
control over winning .03 .02
control over losing -.06 -.01
F 33.68 51.58 18.51 30.79 6.90 9.05
p <.001 <.001 <.001 <.001 <.001 <.001
Adjusted R2 .133 .152 .142 .174 .191 .194
Note. Rows indicate predictor variables. Standardized correlation coefficients (beta) are shown.
Table 5
Prediction of Gambling Frequency from Intentions, Attitudes, Subjective Norms, Personality, and Cognitive Bias Variables: Results of Regression Analysis
variable boys girls boys girls boys girls boys girls
intention .51*** .52*** .47*** .43*** .46*** .40*** .42*** .39***
attitudes .24*** .26*** .19*** .22*** .13** .21***
subjective norms -.02 -.06 -.02 -.06 -.01 -.05
impulsiveness .05 .09** .02 .09**
venturesomeness .15*** .21*** .14*** .16***
Cognitive bias variables
chances of winning .14** .00
chances of losing .04 .01
stereotype winner -.01 -.13***
stereotype loser .01 .06
percent who win .07 -.01
percent who lose -.05 -.02
good feel about wins .01 .03
bad feel about losses .00 .03
know losers .11* .02
know winners .08 .22***
control over winning -.04 -.02
control over losing .10 .04
F 152.6 209.7 71.1 94.4 47.1 71.9 16.4 26.3
p <.001 .001 <.001 <.001 <.001 <.001 <.001 <.001
Adjusted R2 .260 .267 .331 .331 .352 .385 .396 .446
Note. Rows indicate predictor variables. Standardized correlation coefficients (beta) are shown.
Table 6
Prediction of Problem Gambling from Intentions, Attitudes, Subjective norms, Personality, and Cognitive Bias Variables: Results of Regression Analysis
variable boys girls boys girls boys girls boys girls
intention .66*** .49*** .54*** .48*** .53*** .47*** .47*** .45***
attitudes -.02 -.02 .00 .00 .01 .02
subjective norms .21*** .09* .19*** .07* .14*** .05
impulsiveness .11** .13*** .13** .10*
venturesomeness -.10* -.11** -.08 -.10**
Optimism variables
chances of winning -.01 .04
chances of losing .05 .00
stereotype winner .18*** .09*
stereotype loser -.02 -.05
percent who win .09* .07
percent who lose -.04 .04
good feel about wins -.03 .04
bad feel about losses .00 -.01
know losers .10* .14**
know winners -.03 -.02
control over winning .01 .08
control over losing .05 -.07
F 248.4 182.7 90.5 60.4 57.8 40.4 17.1 12.9
p <.001 <.001 <.001 <.001 <.001 <.001 <.001 <.001
Adjusted R2 .364 .240 .386 .239 .401 .258 .407 .275
Note. Rows indicate predictor variables. Standardized correlation coefficients (beta) are shown.