Neuropsychiatric Disease and Treatment
Dove
press
O r i g i N a l r e s e a r c h
open access to scientific and medical research
Open access Full Text article
changes in background electroencephalography
and regional cerebral glucose metabolism in focal
epilepsy patients after 1-month administration
of levetiracetam
correspondence: Young-Min shon college of Medicine, The catholic University of Korea, 222 Banpo-daero, seocho-gu, seoul, 137-701, republic of Korea
Tel +82 2 2258 6079 Fax +82 2 533 6079
email [email protected]
seong hoon Kim1,*
sung-chul lim1,2,*
Woojun Kim1,2
Oh-hun Kwon3
chan Mi Kim3
Jong-Min lee3
Young-Min shon1,2 1Department of Neurology, 2catholic Neuroscience institute, college of Medicine, The catholic University of Korea, seocho-gu, seoul, republic of Korea; 3Department of Biomedical engineering, hanyang University, seoul, republic of Korea
*These authors contributed equally to this work
Abstract: The antiseizure efficacy and safety of levetiracetam (LEV) is well documented; however, few clinical studies have investigated the predictability of patient responsiveness to LEV, especially when the drug is first administered. The aim of this study was to ascertain the utility of clinical, electrophysiological, and neuroimaging parameters for assessing the early response to LEV treatment in focal epilepsy patients. Twelve confirmed focal epilepsy patients were included who had never taken LEV before. At baseline and 1 month after LEV administration, all subjects underwent 18F-fluorodeoxyglucose positron emission tomography (FDG-PET) and electroencephalography (EEG), and completed the Quality of Life in Epilepsy questionnaire (QOLIE-31). Participants were divided by drug response: good versus poor. The good response group (seven subjects) was defined by a 50% decrease in seizure frequency compared to baseline (3 months before LEV intake). The other five participants with a 50% decrease in seizure frequency were placed into the poor response group. We compared the differential changes in brain glucose metabolism on FDG-PET, power spectrum on the EEG, and QOLIE-31 results between the two groups after a 1-month LEV trial. In the good response group, it was possible to identify brain regions with increased glucose metabolism, including the bilateral caudate nuclei and both frontal and left parietal regions (uncorrected P0.005). In the poor response group, FDG-PET did not reveal any areas with significantly increased glucose metabolism. In the good response group, spectral EEG analysis revealed decreased delta power (1–3 Hz, P0.05) in the parietal region and increased beta1 power (13–19 Hz, P0.05) in the frontal region, whereas no significant changes were observed in the poor response group. There were no significant changes on the QOLIE-31 in either group after a 1-month LEV trial. Our results suggest that LEV-induced glucose metabolism and EEG spectral changes may be indicative of initial drug responsiveness as early as 1 month following treatment initiation. These parameters may be useful prognostic markers of antiseizure effects caused by LEV medication or may indicate an epiphenomenon of LEV-induced changes in glucose metabolism and EEG frequency. Further studies with larger sample sizes are warranted.
Keywords: FDG-PET, responsiveness, background EEG, power spectral change
Introduction
Antiepileptic drugs (AEDs) are the primary treatment option for controlling seizures in epilepsy patients, but they can also impair cerebral metabolism and cognitive per-formance. AEDs inhibit neuronal excitability, enhance inhibitory neuron activity, and alter neurochemical systems in the brain.1 The preferred method with which to examine
the effects of AEDs on cognitive function has been neuropsychological testing, but
Journal name: Neuropsychiatric Disease and Treatment Article Designation: Original Research
Year: 2015 Volume: 11
Running head verso: Kim et al
Running head recto: Levetiracetam: changes in EEG and cerebral glucose metabolism DOI: http://dx.doi.org/10.2147/NDT.S76482
Neuropsychiatric Disease and Treatment downloaded from https://www.dovepress.com/ by 118.70.13.36 on 25-Aug-2020
For personal use only.
This article was published in the following Dove Press journal: Neuropsychiatric Disease and Treatment
27 January 2015
Dovepress
Kim et al
these types of tests have several limitations including practice effects and test–retest variability.1–3 However, measures of
cerebral glucose metabolism and quantitative electroencepha-logram (EEG) can provide additional insight into the effects of AEDs on cognitive function.
The cerebral metabolic rate of glucose is often used as an index of brain activity, and the effects of AEDs on brain glucose metabolism have been correlated with changes in cognitive function. Different AEDs depress cerebral metabolism to variable degrees. Phenobarbital, phenytoin, and carbamazepine all lower cerebral glucose metabolism, whereas valproic acid depresses cerebral metabolism to a greater degree than carbamazepine or phenytoin but less so than phenobarbital.4 Lamotrigine reduces cerebral glucose
metabolism in the thalamus, basal ganglia, and multiple cortical lesions.5 Topiramate suppresses glucose metabolism
in the thalamocortical network and midbrain.6
EEG is highly sensitive to an individual’s cognitive function and can provide information about alertness. Many published studies have investigated the influence of cogni-tive function on EEG results.7,8 In EEG frequency domain
analysis, the power of each band can serve as an important indicator of cerebral activity.9,10 Some AEDs affect the
fre-quency characteristics of an ongoing EEG.11 In addition, the
current-source analysis of digital EEG data can be used to directly measure neuronal activity and identify the approxi-mate location of current sources.
Old AEDs can have negative effects on cerebral glucose metabolism and background EEGs.11,12 Some new AEDs such
as levetiracetam (LEV) and lamotrigine result in less severe cognitive adverse effects compared with older AEDs.1,13
LEV also has multiple antiepileptic mechanisms and linear pharmacokinetics.14 LEV does not negatively influence
cog-nitive function and may even improve it.15 EEG studies have
reported that LEV has a positive effect on cerebral neuronal activity and cognitive function;16,17 however, these studies
investigated only the long-term effects of LEV, and changes in cerebral glucose metabolism were not assessed.
In this study, we investigated the influence of LEV on cerebral glucose metabolism and background EEG 1 month after beginning treatment. We also tried to identify meaning-ful differences between good and poor responders at an early stage of LEV administration. To evaluate the in vivo effect of LEV on cerebral glucose metabolism and background EEG, we recruited patients with focal epilepsy who had never taken LEV. 18F-fluorodeoxyglucose (FDG) positron emission tomography (PET) and EEG scans were performed at baseline and after 1 month of the medication regimen.
Method
subjects and study design
Twenty-three patients with diagnosed focal epilepsy who had never taken LEV (allowed for LEV monotherapy or add-on therapy to one or two existing AEDs) were recruited from our epilepsy clinic between January 2010 and January 2012. This study was approved by the local ethics commit-tee, and all patients provided written informed consent to participate in the study prior to the administration of LEV in accordance with the guidelines of St Mary’s Hospital in Seoul, Republic of Korea.
Each patient received the same dosage of LEV for 1 month, which began with a titration period over the initial week (250 mg per day for the first 3 days and 250 mg twice daily for 4 days). After the first week, the LEV dose was increased to 500 mg twice daily and continued for 23 consecutive days, with two exceptions (patients 2 and 7 continued treatment for 28 days).
On the first visit, enrolled patients were subjected to clinical examination (neurological exam, clinical history, seizure frequency, the Quality of Life in Epilepsy question-naire [QOLIE-31], and Symptom Checklist-90 Revised [SCL-90-R]) and FDG PET and EEG acquisition, and LEV administration was subsequently initiated. One month after the initial assessment, the subjects returned for a follow-up visit to determine the initial therapeutic efficacy, incidence of adverse effects, and compliance during initial LEV treat-ment. After controlled administration of LEV (1,000 mg/day) during the first month, the dosage of LEV for each patient was adjusted freely according to the patient’s condition and continued for an additional 3 months. Four months after treatment initiation (on the third visit), the final LEV dosage, seizure frequency, incidence of adverse effects, and drug compliance were recorded.
The participants were divided into two groups according to their LEV response 1 month after treatment initiation. The good response group included patients with 50% reduction in seizure frequency relative to the baseline seizure frequency (as assessed during the 3 months prior to commencing LEV treatment). Conversely, the poor response group was defined as having a decline in seizure frequency of 50%.
FDg PeT imaging procedure
FDG PET images were obtained at baseline and after 1 month of LEV administration using ECAT HR plus and Biograph scanners (Siemens Medical System, Inc, Hoffman Estates, IL, USA) while the subjects rested comfortably with their eyes closed and ears plugged in a darkened and quiet room.
Neuropsychiatric Disease and Treatment downloaded from https://www.dovepress.com/ by 118.70.13.36 on 25-Aug-2020
Dovepress levetiracetam: changes in eeg and cerebral glucose metabolism
The patients were instructed to fast for at least 6 hours prior to the scans and were given an intravenous injection of FDG (7–10 mCi; 214.6–444 MBq). All PET scans were performed more than 24 hours after the patient’s last seizure. The images were reconstructed using ordered subset expectation maximization with 16 subsets and six iteration reconstruction algorithms (Shepp filter with a cut-off frequency of 0.5 cycles per projection element). The reconstructed PET images consisted of a 128×128 image matrix with a pixel size of 1.72×1.72 mm and an inter-slice distance of 2.43 mm.
PeT data analysis
All FDG PET data were analyzed for any changes in specific regional glucose metabolism with Statistical Parametric Mapping (SPM) 8 (The Wellcome Trust Centre for Neuroim-aging, Institute of Neurology, University College London, London, UK) in conjunction with MATLAB (Mathworks, Inc, Natick, MA, USA) software. The reconstructed PET data were reformatted into the Analyze format. A direct between-subjects statistical analysis was impossible because of the dif-ferent shapes and sizes of the subjects’ brains. Therefore, the images obtained from each patient were spatially transformed to a generic SPM PET template to remove anatomical vari-ability and then smoothed with a full width at half maximum 16 mm Gaussian kernel to increase the signal-to-noise ratio. Then, paired t-tests were used to perform group comparisons on the PET images before and after LEV use. The results were displayed on a healthy subject’s magnetic resonance imaging template after spatial normalization.
eeg recording
EEG recordings were obtained before and after initiation of LEV medication. For each patient, EEG data were recorded for at least 30 minutes with a digital EEG machine (Nicolet Biomedical, Madison, WI, USA) at 250 Hz using 19 chan-nels based on the international 10–20 system (Fp1, Fp2, F3, F4, C3, C4, P3, P4, F7, F8, T3, T4, T5, T6, O1, O2, Fz, Cz, and Pz).
All EEG data were analyzed using standardized low-resolution brain electromagnetic tomography (sLORETA) in which 20 samplings of 2-second epochs with no epileptiform discharge and no artifacts were selected from segments of the waking state recordings. A sLORETA software package8
was used to analyze the following EEG frequency domains: delta (1–4 Hz), theta (4–8 Hz), alpha1 (8–10.5 Hz), alpha2 (10.5–13 Hz), beta1 (13–22 Hz), and beta2 (22–30 Hz). The sLORETA employed a three-spherical head model based on the Montreal Neurological Institute 152 template18 with the
three-dimensional solution space restricted to cortical gray matter, as determined by the probabilistic Talairach atlas.19
The standard electrode positions on the Montreal Neurologi-cal Institute 152 sNeurologi-calp were obtained from a previous study,20
and the sLORETA solution space consisted of 6,239 voxels at a 5 mm spatial resolution in the three-dimensional plane. The power current density for each voxel was normalized by averaging the power current density across all voxels and all frequencies.
For the statistical analyses, the localization of the differ-ences in relative current density power between the indepen-dent groups in the six frequency bands was assessed using paired t-tests. The nonparametric randomization method21
was used to calculate multiple comparison-corrected critical probability threshold values based on empirical probability distributions.8
QOlie-31 and scl-90-r
All statistical analyses comparing the two groups were performed using SPSS software (version 12.0 for win-dows; SPSS Inc, Chicago, IL, USA), and all demographic variables were analyzed using either a Chi-square test, Fisher’s exact test, or Student’s t-test, as appropriate. Comparison of QOLIE-31 and SCL-90-R scores measured at baseline and after 1 month of LEV administration were performed using paired t-tests for the good and poor responder groups.
Results
Demographics and baseline
characteristics
At the end of the study, only 12 of the 23 patients recruited completed the full 4-month LEV treatment course and the pre- and posttreatment evaluations. Four participants dropped out due to noncompliance, two were excluded because of poor FDG PET image quality, and five patients discontinued LEV because of a lack of efficacy (three) or problems with tolerability (two).
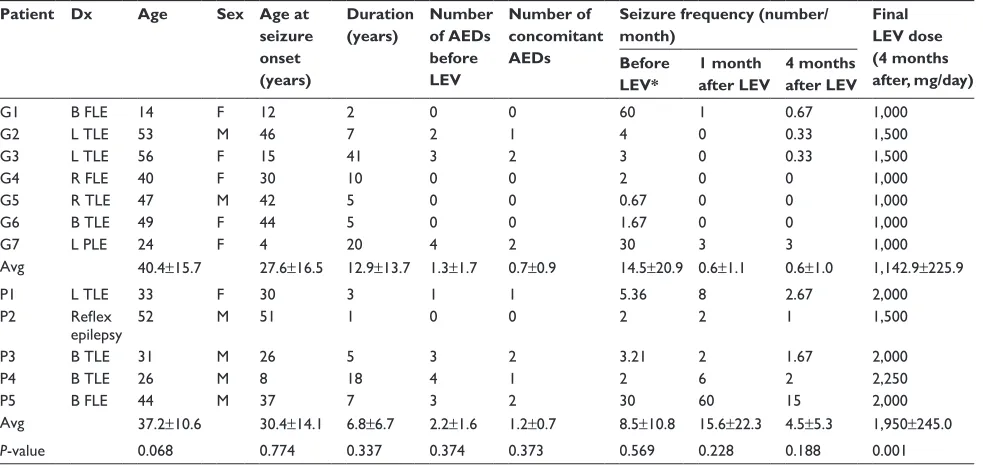
The good response group included seven patients (five females, two males; mean age, 40.4±15.7 years; baseline sei-zure frequency, 14.5±20.9 per month) and the poor response group included five patients (one female, four males; mean age, 37.2±10.6 years; baseline seizure frequency, 8.5±10.8 per month). The mean durations that patients had been affected by seizures were 12.9±13.7 years and 6.8±6.7 years in the good and poor responder groups, respectively. There were no statistically significant differences between the groups for any of these variables (Table 1).
Neuropsychiatric Disease and Treatment downloaded from https://www.dovepress.com/ by 118.70.13.36 on 25-Aug-2020
Dovepress
Kim et al
clinical outcome after leV medication
Of the 12 patients, five (41.7%) achieved a seizure-free state with 1,000 mg/day 1 month after initiating LEV treatment. Patients 1 and 7 showed a 50% seizure reduction during this period. Moreover, among the seven patients in the good response group, three (42.9%) remained in a seizure-free state throughout the subsequent 3 months. However, three of the five patients (60%) in the poor response group exhibited seizure aggravation in the first month after LEV treatment initiation. After dosage adjustment, three patients showed a 50% decrease in seizure frequency. Age, age at seizure onset, epilepsy duration, baseline seizure frequency, and number of concomitant AEDs did not differ between the responder and nonresponder groups. The final LEV dosage (4 months after LEV initiation) was significantly higher in the nonresponders (1,950±245.0 mg) than in the responders (1,142.9±225.9 mg) (P=0.001).
sPM analysis of FDg PeT images
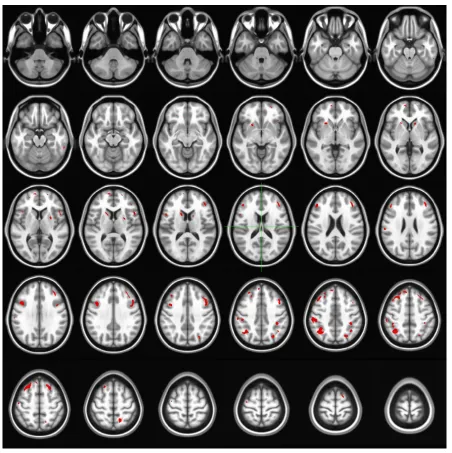
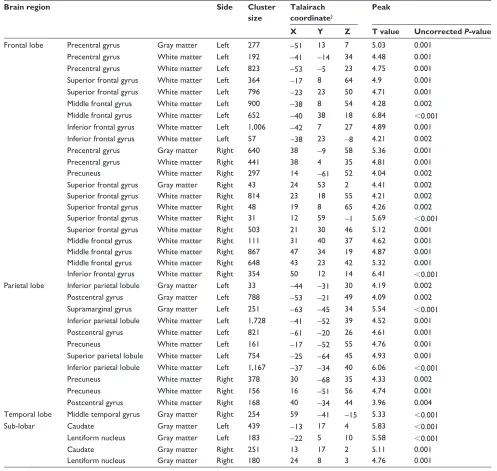
In the good response group, SPM analysis revealed a sig-nificant increase (P0.005, uncorrected) in regional cerebral glucose metabolism in the bilateral frontal, caudate, and pari-etal areas following LEV administration (Figure 1; Table 2). There were no regions with significantly reduced glucose metabolism. In the poor response group, PET analysis did not reveal any significant changes in cerebral glucose metabolism after LEV treatment.
Differences in slOreTa activity
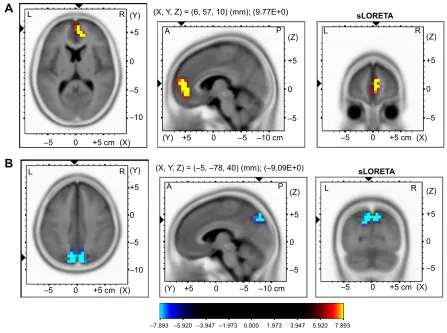
In the good response group, there was a statistically sig-nificant (P0.05) increase in the beta1 (13–22 Hz) rela-tive power current density in the right medial frontal area (Figure 2A) and a significant (P0.05) decrease in the delta (1–4 Hz) relative power current density in the medial parietal area (precuneus, Figure 2B) after LEV administra-tion (Table 3). However, there were no significant changes in the poor responders.
QOlie-31 and scl-90-r
In the comparison of QOLIE-31 scores measured at baseline and 1 month after LEV initiation, no statistically significant changes were found in either group. Similarly, no differences in SCL-90-R scores were found between the two groups after LEV administration.
Discussion
We investigated the early effects of LEV administration on cerebral glucose metabolism and background EEG and the differences between good and poor responders. Furthermore, we evaluated the feasibility of predicting patients’ long-term responses to LEV based on these early changes. To the best of our knowledge, this is the first study to characterize dif-ferences in glucose metabolism and EEG activity during the early stages of LEV treatment in patients with focal epilepsy. Our results demonstrate that short-term LEV treatment
Table 1 Demographic data and clinical outcome of patients exposed to leV
Patient Dx Age Sex Age at seizure onset (years)
Duration (years)
Number of AEDs before LEV
Number of concomitant AEDs
Seizure frequency (number/ month)
Final LEV dose (4 months after, mg/day) Before
LEV*
1 month after LEV
4 months after LEV
g1 B Fle 14 F 12 2 0 0 60 1 0.67 1,000
g2 l Tle 53 M 46 7 2 1 4 0 0.33 1,500
g3 l Tle 56 F 15 41 3 2 3 0 0.33 1,500
g4 r Fle 40 F 30 10 0 0 2 0 0 1,000
g5 r Tle 47 M 42 5 0 0 0.67 0 0 1,000
g6 B Tle 49 F 44 5 0 0 1.67 0 0 1,000
g7 l Ple 24 F 4 20 4 2 30 3 3 1,000
avg 40.4±15.7 27.6±16.5 12.9±13.7 1.3±1.7 0.7±0.9 14.5±20.9 0.6±1.1 0.6±1.0 1,142.9±225.9
P1 l Tle 33 F 30 3 1 1 5.36 8 2.67 2,000
P2 Reflex
epilepsy 52 M 51 1 0 0 2 2 1 1,500
P3 B Tle 31 M 26 5 3 2 3.21 2 1.67 2,000
P4 B Tle 26 M 8 18 4 1 2 6 2 2,250
P5 B Fle 44 M 37 7 3 2 30 60 15 2,000
avg 37.2±10.6 30.4±14.1 6.8±6.7 2.2±1.6 1.2±0.7 8.5±10.8 15.6±22.3 4.5±5.3 1,950±245.0
P-value 0.068 0.774 0.337 0.374 0.373 0.569 0.228 0.188 0.001
Note: *seizure frequency during the last 3 months prior to leV administration.
Abbreviations: aeDs, antiepileptic drugs; avg, average; B, bilateral; Dx, diagnosis; Fle, frontal lobe epilepsy; g, patient of good response group; l, left; leV, levetiracetam; P, patient of poor response group; Ple, parietal lobe epilepsy; r, right; Tle, temporal lobe epilepsy.
Neuropsychiatric Disease and Treatment downloaded from https://www.dovepress.com/ by 118.70.13.36 on 25-Aug-2020
Dovepress levetiracetam: changes in eeg and cerebral glucose metabolism
enhances glucose metabolism and background EEG activity in good responders. These patients showed increased glucose metabolism in the frontal and parietal regions, increased beta1 activity in the right medial frontal region, and decreased delta activity in the bilateral parietal regions. There were no statisti-cally significant changes in the poor responder group.
A number of studies have investigated the effects of AEDs on cerebral glucose metabolism and background EEG. Traditional AEDs such as phenytoin, carbamazepine, and phenobarbital may increase and decrease the power of slow and fast frequencies on background EEG, respectively.22,23
Carbamazepine increases the power of theta and delta bands
but decreases the power of alpha bands.23 Valproate depresses
cerebral glucose metabolism to a greater degree than does either carbamazepine or phenytoin, but to a lesser extent than observed for phenobarbital.4 These reports suggest
that traditional AEDs have a negative influence on cerebral glucose metabolism and background EEG.
Newer AEDs possess different pharmacokinetic and action mechanisms, so these drugs may have different effects on cere-bral function relative to traditional AEDs. FDG PET analyses have revealed that topiramate reduces glucose metabolism in the corpus callosum and thalamus,24 while lamotrigine decreases
glucose metabolism in the cortico-striato-entorhinal area.5 These
Figure 1 The brain regions showing increased glucose metabolism after levetiracetam administration in patients of the good response group (bilateral frontal, caudate nuclei, and parietal areas) assessed by sPM8.
Note: Threshold: P0.005, uncorrected for extent.
Abbreviation: sPM8, statistical Parametric Mapping (version 8).
Neuropsychiatric Disease and Treatment downloaded from https://www.dovepress.com/ by 118.70.13.36 on 25-Aug-2020
Dovepress
Kim et al
Table 2 The brain regions with increased glucose metabolism after leV administration in patients of good response group
Brain region Side Cluster
size
Talairach coordinate†
Peak
X Y Z T value Uncorrected P-value
Frontal lobe Precentral gyrus gray matter left 277 -51 13 7 5.03 0.001
Precentral gyrus White matter left 192 -41 -14 34 4.48 0.001
Precentral gyrus White matter left 823 -53 -5 23 4.75 0.001
superior frontal gyrus White matter left 364 -17 8 64 4.9 0.001
superior frontal gyrus White matter left 796 -23 23 50 4.71 0.001
Middle frontal gyrus White matter left 900 -38 8 54 4.28 0.002
Middle frontal gyrus White matter left 652 -40 38 18 6.84 0.001
inferior frontal gyrus White matter left 1,006 -42 7 27 4.89 0.001
inferior frontal gyrus White matter left 57 -38 23 -8 4.21 0.002
Precentral gyrus gray matter right 640 38 -9 58 5.36 0.001
Precentral gyrus White matter right 441 38 4 35 4.81 0.001
Precuneus White matter right 297 14 -61 52 4.04 0.002
superior frontal gyrus gray matter right 43 24 53 2 4.41 0.002
superior frontal gyrus White matter right 814 23 18 55 4.21 0.002
superior frontal gyrus White matter right 48 19 8 65 4.26 0.002
superior frontal gyrus White matter right 31 12 59 -1 5.69 0.001
superior frontal gyrus White matter right 503 21 30 46 5.12 0.001
Middle frontal gyrus White matter right 111 31 40 37 4.62 0.001
Middle frontal gyrus White matter right 867 47 34 19 4.87 0.001
Middle frontal gyrus White matter right 648 43 23 42 5.32 0.001
inferior frontal gyrus White matter right 354 50 12 14 6.41 0.001
Parietal lobe inferior parietal lobule gray matter left 33 -44 -31 30 4.19 0.002
Postcentral gyrus gray matter left 788 -53 -21 49 4.09 0.002
supramarginal gyrus gray matter left 251 -63 -45 34 5.54 0.001
inferior parietal lobule White matter left 1,728 -41 -52 39 4.52 0.001
Postcentral gyrus White matter left 821 -61 -20 26 4.61 0.001
Precuneus White matter left 161 -17 -52 55 4.76 0.001
superior parietal lobule White matter left 754 -25 -64 45 4.93 0.001 inferior parietal lobule White matter left 1,167 -37 -34 40 6.06 0.001
Precuneus White matter right 378 30 -68 35 4.33 0.002
Precuneus White matter right 156 16 -51 56 4.74 0.001
Postcentral gyrus White matter right 168 40 -34 44 3.96 0.004
Temporal lobe Middle temporal gyrus gray matter right 254 59 -41 -15 5.33 0.001
sub-lobar caudate gray matter left 439 -13 17 4 5.83 0.001
lentiform nucleus gray matter left 183 -22 5 10 5.58 0.001
caudate gray matter right 251 13 17 2 5.11 0.001
lentiform nucleus gray matter right 180 24 8 3 4.76 0.001
Notes:†Coordinates are defined in the stereotactic space of Talairach (in mm). X represents the lateral distance from the midline (positive, right); Y, the anteroposterior
distance from the anterior commissure (positive, anterior); and Z, the rostrocaudal distance from the bicommissural plane (positive, rostral).
Abbreviation: leV, levetiracetam.
differences are assumed to be related to the drugs’ mechanisms of action. EEG studies have revealed that prolonged gabapentin administration in healthy participants induced EEG slowing and causes a decrease in the peak frequency of the posterior alpha rhythm.25 Topiramate also causes a slowing of EEG signals,26,27
whereas lamotrigine increases power in the beta band but does not cause significant changes in the relative power of the delta, theta, or alpha band.28
Interestingly, the FDG PET and EEG spectral changes were region-specific in the good response group, and the changes were similar in the PET and EEG analyses.
Previous studies have reported that such region-specific changes are correlated with specific changes in cognition. An FDG PET analysis found that relative hypometabolism in the left thalamus and temporal area were correlated with diminished performance on a verbal memory task.29
Topiramate reduces glucose metabolism in the thalamus and corpus callosum, which is associated with executive dysfunction.5
The present findings suggest that the short-term (1 month) LEV administration enhances cerebral glucose metabolism and background EEG activity in the frontal and
Neuropsychiatric Disease and Treatment downloaded from https://www.dovepress.com/ by 118.70.13.36 on 25-Aug-2020
Dovepress levetiracetam: changes in eeg and cerebral glucose metabolism
±
± FP ;
= V/25(7$
± = V/25(7$
;
± FP
5 /
± = ;<= PP(
< ± ±FP
3 $
±
± <
/
$
5FP ; ±
FP ; <
±
± /
%
5±
± ±FP
<
= ;<= ±±PP±(
3 $
±
± ± ± ±
/ 5
Figure 2 slOreTa images.
Notes: (A) Voxel-wise statistical nonparametric map of sLORETA images demonstrate the statistically significant increase in the beta1 relative power current density after leV administration in the right medial frontal area. (B) In addition, there is significant decrease of the delta relative power current density in the superomedial parietal area. Yellow and blue color indicates voxels with significantly increased or decreased (P0.05) activity, respectively.
Abbreviations: leV, levetiracetam; slOreTa, standardized low-resolution brain electromagnetic tomography.
parietal areas, similar to what has been reported in previous studies. One recent report stated that LEV therapy increases the 22–30 Hz band of EEG background activity in the bilateral anterior cingulate and left parahippocampal gyri of patients with refractory partial epilepsy, and that this change is associated with improvements in verbal memory and executive function.16 LEV has also been shown to decrease
delta and theta power in the frontopolar and anterior areas, increase alpha2 in diffuse areas, and increase beta2 in the left temporal area.17
In the present study, good responders continued to exhibit an excellent response to LEV 3 months following treatment, which suggests that it may be possible to predict the long-term effectiveness of LEV in individual patients based on 18F-FDG PET scans or background EEG patterns at an early stage of treatment.
The SCL-90-R is a widely used self-assessment tool that assesses the subjective symptom burden of patients with various neuropsychiatric disorders such as epilepsy.30
Quality of life (QOL) is an important measure in epilepsy,
Table 3 Brain coordinates indicating regions showing significant increase (right medial frontal area) of beta1 and decrease (precuneus) of the delta relative power current density after leV administration
Brain lobe Region BA MNI coordinates Talairach coordinates t-score
X Y Z X Y Z
rt parietal Precuneus 7 10 -80 45 10 -75 45 -10.89
lt parietal Precuneus 19 -10 -85 40 -10 -81 41 -10.99
rt frontal Medial frontal gyrus 10 10 50 10 10 49 7 12.11
Note: all brain regions were thresholded at P0.05.
Neuropsychiatric Disease and Treatment downloaded from https://www.dovepress.com/ by 118.70.13.36 on 25-Aug-2020
Dovepress
Kim et al
a chronic, devastating condition that is unique due to its multidimensional effects on psychosocial functioning.31 A
recent study of psychiatric symptoms and QOL in Korean patients with drug-refractory epilepsy receiving LEV reported improved psychiatric symptoms and QOL that were not related to seizure freedom after LEV. However, adverse events such as abnormal behavior, insomnia, anxiety, nervousness, and depression led to temporary LEV discontinuation by 5% of patients.32 Although we found no
association between seizure reduction and an improvement in psychiatric symptoms or QOL, the study sample was very small, so the lack of a significant correlation may have been due to a type II error.
There are several limitations to this study. First, the cur-rent study was performed in a relatively small number of subjects. Second, the data were obtained from a nonhomog-enous population of de novo patients and those refractory to previous AEDs without an appropriate control group. A larger sample size and comparison with normal control subjects will provide additional insight into the effects of LEV on cerebral function. Third, the 3-month follow-up duration may not have been sufficient to determine the long-term effects of LEV treatment. Lastly, because no intensive neuropsychological testing was performed, the neurobiologi-cal findings from this study cannot be correlated with specific cognitive function domains.
In conclusion, differences in the effects of LEV can be identified at an early stage of treatment in good and poor responders. These findings suggest that LEV-induced changes in glucose metabolism and EEG spectral activity may be dif-ferentiated based on initial responsiveness to the drug as early as 1 month after medication initiation. Thus, FDG PET scans and EEG data may be useful prognostic markers of the antisei-zure effects of LEV or, at least, indicate the epiphenomena of changes in glucose metabolism and EEG frequency following seizure reduction by LEV. The results of this study indicate that LEV has positive effects in good responder patients and no negative effects in poor responder patients in terms of cerebral glucose metabolism and background EEG. Further studies with larger samples are warranted.
Acknowledgments
This investigation was supported by UCB Korea Co, Ltd. Gratitude is expressed to UCB Korea Co, Ltd as well as the investigators and to their sites that provided patients for the study. We confirm that we have read the Journal’s position on issues involved in ethical publication and affirm that this report is consistent with those guidelines.
Disclosure
The authors report no conflicts of interest in this work.
References
1. Loring DW, Marino S, Meador KJ. Neuropsychological and behav-ioral effects of antiepilepsy drugs. Neuropsychol Rev. 2007;17(4): 413–425.
2. Ortinski P, Meador KJ. Cognitive side effects of antiepileptic drugs.
Epilepsy Behav. 2004;5 Suppl 1:S60–S65.
3. Witt JA, Alpherts W, Helmstaedter C. Computerized neuropsycho-logical testing in epilepsy: overview of available tools. Seizure. 2013; 22(6):416–423.
4. Leiderman DB, Balish M, Bromfield EB, Theodore WH. Effect of val-proate on human cerebral glucose metabolism. Epilepsia. 1991;32(3): 417–422.
5. Joo EY, Tae WS, Hong SB. Regional effects of lamotrigine on cerebral glucose metabolism in idiopathic generalized epilepsy. Arch Neurol. 2006;63(9):1282–1286.
6. Joo EY, Tae WS, Han SJ, et al. The Effect of Topiramate and Lamotrigine on Cerebral Glucose Metabolism in Idiopathic General-ized Epilepsy Patients. Journal of Korean Epilepsy Society. 2005;9(2): 129–136.
7. Pascual-Marqui RD, Michel CM, Lehmann D. Low resolution electro-magnetic tomography: a new method for localizing electrical activity in the brain. Int J Psychophysiol. 1994;18(1):49–65.
8. Pascual-Marqui RD. Standardized low-resolution brain electromagnetic tomography (sLORETA): technical details. Methods Find Exp Clin
Pharmacol. 2002;24 Suppl D:5–12.
9. Doppelmayr M, Klimesch W, Stadler W, Pöllhuber D, Heine C. EEG alpha power and intelligence. Intelligence. 2002;30(3):289–302. 10. Doppelmayr M, Klimesch W, Sauseng P, Hödlmoser K, Stadler W,
Hanslmayr S. Intelligence related differences in EEG-bandpower.
Neurosci Lett. 2005;381(3):309–313.
11. Smith ME, Gevins A, McEvoy LK, Meador KJ, Ray PG, Gilliam F. Distinct cognitive neurophysiologic profiles for lamotrigine and topi-ramate. Epilepsia. 2006;47(4):695–703.
12. Theodore WH, Bromfield E, Onorati L. The effect of carbam-azepine on cerebral glucose metabolism. Ann Neurol. 1989;25(5): 516–520.
13. Park SP, Kwon SH. Cognitive effects of antiepileptic drugs. J Clin
Neurol. 2008;4(3):99–106.
14. Wright C, Downing J, Mungall D, et al. Clinical pharmacology and pharmacokinetics of levetiracetam. Front Neurol. 2013;4:192. 15. Helmstaedter C, Witt JA. The effects of levetiracetam on
cogni-tion: a non-interventional surveillance study. Epilepsy Behav. 2008; 13(4):642–649.
16. Park SP, Kwon OY. Increased EEG current-source density in the high Beta frequency band induced by levetiracetam adjunctive therapy in refractory partial epilepsy. J Clin Neurol. 2009;5(4):178–185. 17. Cho JR, Koo DL, Joo EY, et al. Effect of levetiracetam monotherapy on
background EEG activity and cognition in drug-naïve epilepsy patients.
Clin Neurophysiol. 2012;123(5):883–891.
18. Mazziotta J, Toga A, Evans A, et al. A probabilistic atlas and reference system for the human brain: International Consortium for Brain Map-ping (ICBM). Philos Trans R Soc Lond B Biol Sci. 2001;356(1412): 1293–1322.
19. Lancaster JL, Woldorff MG, Parsons LM, et al. Automated Talairach atlas labels for functional brain mapping. Hum Brain Mapp. 2000; 10(3):120–131.
20. Jurcak V, Tsuzuki D, Dan I. 10/20, 10/10, and 10/5 systems revisited: their validity as relative head-surface-based positioning systems.
Neuroimage. 2007;34(4):1600–1611.
21. Nichols TE, Holmes AP. Nonparametric permutation tests for func-tional neuroimaging: a primer with examples. Hum Brain Mapp. 2002; 15(1):1–25.
Neuropsychiatric Disease and Treatment downloaded from https://www.dovepress.com/ by 118.70.13.36 on 25-Aug-2020
Neuropsychiatric Disease and Treatment
Publish your work in this journal
Submit your manuscript here: http://www.dovepress.com/neuropsychiatric-disease-and-treatment-journal
Neuropsychiatric Disease and Treatment is an international, peer-reviewed journal of clinical therapeutics and pharmacology focusing on concise rapid reporting of clinical or pre-clinical studies on a range of neuropsychiatric and neurological disorders. This journal is indexed on PubMed Central, the ‘PsycINFO’ database and CAS,
and is the official journal of The International Neuropsychiatric Association (INA). The manuscript management system is completely online and includes a very quick and fair peer-review system, which is all easy to use. Visit http://www.dovepress.com/testimonials.php to read real quotes from published authors.
Dovepress
Dove
press
levetiracetam: changes in eeg and cerebral glucose metabolism
22. Duncan JS, Smith SJ, Forster A, Shorvon SD, Trimble MR. Effects of the removal of phenytoin, carbamazepine, and valproate on the electroencephalogram. Epilepsia. 1989;30(5):590–596.
23. Besser R, Hornung K, Theisohn M, Rothacher G, Krämer G. EEG changes in patients during the introduction of carbamazepine.
Electroencephalogr Clin Neurophysiol. 1992;83(1):19–23.
24. Joo EY, Tae WS, Kim JH, Han SJ, Kim BT, Hong SB. Effect of Topi-ramate on Cerebral Glucose Metabolism. Journal of Korean Epilepsy
Society. 2004;8(2):116–122.
25. Salinsky MC, Binder LM, Oken BS, Storzbach D, Aron CR, Dodrill CB. Effects of gabapentin and carbamazepine on the EEG and cognition in healthy volunteers. Epilepsia. 2002;43(5):482–490.
26. Neufeld MY, Kogan E, Chistik V, Korczyn AD. Comparison of the effects of vigabatrin, lamotrigine, and topiramate on quantitative EEGs in patients with epilepsy. Clin Neuropharmacol. 1999;22(2):80–86. 27. Mecarelli O, Piacenti A, Pulitano P, et al. Clinical and
electroencepha-lographic effects of topiramate in patients with epilepsy and healthy volunteers. Clin Neuropharmacol. 2001;24(5):284–289.
28. Marciani MG, Stanzione P, Mattia D, et al. Lamotrigine add-on therapy in focal epilepsy: electroencephalographic and neuropsychological evaluation. Clin Neuropharmacol. 1998;21(1):41–47.
29. Rausch R, Henry TR, Ary CM, Engel J Jr, Mazziotta J. Asymmetric interictal glucose hypometabolism and cognitive performance in epi-leptic patients. Arch Neurol. 1994;51(2):139–144.
30. Wiebe S, Rose K, Derry P, McLachlan R. Outcome assessment in epi-lepsy: comparative responsiveness of quality of life and psychosocial instruments. Epilepsia. 1997;38(4):430–438.
31. Cramer JA, Perrine K, Devinsky O, Bryant-Comstock L, Meador K, Hermann B. Development and cross-cultural translations of a 31-item quality of life in epilepsy inventory. Epilepsia. 1998;39(1):81–88. 32. Lee JJ, Song HS, Hwang YH, Lee HW, Suh CK, Park SP. Psychiatric
symptoms and quality of life in patients with drug-refractory epilepsy receiving adjunctive levetiracetam therapy. J Clin Neurol. 2011;7(3):128–136.
Neuropsychiatric Disease and Treatment downloaded from https://www.dovepress.com/ by 118.70.13.36 on 25-Aug-2020