https://doi.org/10.5194/nhess-19-471-2019 © Author(s) 2019. This work is distributed under the Creative Commons Attribution 4.0 License.
Effects of different land use and land cover data on the landslide
susceptibility zonation of road networks
Bruno M. Meneses, Susana Pereira, and Eusébio Reis
Centre for Geographical Studies, Institute of Geography and Spatial Planning, Universidade de Lisboa, Edif. IGOT, Rua Branca Edmée Marques, Lisbon, 1600-276, Portugal
Correspondence:Bruno M. Meneses (bmeneses@campus.ul.pt) Received: 13 December 2017 – Discussion started: 18 December 2017
Revised: 12 February 2019 – Accepted: 19 February 2019 – Published: 11 March 2019
Abstract. This work evaluates the influence of land use and land cover (LUC) data with different properties on the landslide susceptibility zonation of the road network in the Zêzere watershed (Portugal). The information value method was used to assess the landslide susceptibility using two models: one including detailed LUC data (the Portuguese Land Cover Map – COS) and the other including more gen-eralized LUC data (the CORINE Land Cover – CLC). A set of fixed independent layers was considered as landslide predisposing factors (slope angle, slope aspect, slope curva-ture, slope-over-area ratio, soil, and lithology) while COS and CLC were used to find the differences in the landslide susceptibility zonation. A landslide inventory was used as a dependent layer, including 259 shallow landslides obtained from the photointerpretation of orthophotos from 2005, and further validated in three sample areas. The landslide sus-ceptibility maps were assigned to the road network data and resulted in two landslide susceptibility road network maps. The models’ performance was evaluated with prediction and success rate curves and the area under the curve (AUC). The landslide susceptibility results obtained in the two models present a high accuracy in terms of the AUC (>90 %), but the model with more detailed LUC data (COS) produces bet-ter results in the landslide susceptibility zonation on the road network with the highest landslide susceptibility.
1 Introduction
Landslides are natural processes that can constrain the free movement of people and goods when they directly or indi-rectly affect road networks (Bíl et al., 2014, 2015; Hilker et
al., 2009; Meneses, 2011; Winter et al., 2013). The total or partial blockages of road networks have economic and soci-etal impacts, particularly on the direct damage to the infras-tructure (material damages), on the population (injuries and deaths) when driving on the affected infrastructure (Guillard and Zêzere, 2012; Pereira et al., 2014, 2017), or by causing indirect damages, such as delays, detours, material damage, and the rising prices of raw materials (Zêzere et al., 2008; Bíl et al., 2014, 2015; Jenelius and Mattsson, 2012; Winter et al., 2016).
Landslide susceptibility assessment is crucial to identi-fying locations with higher probabilities of landslide oc-currence (Conforti et al., 2014; Guillard and Zêzere, 2012; Guzzetti et al., 2006; Pereira et al., 2014; van Westen et al., 2008). Landslide susceptibility is the likelihood of a land-slide occurring in an determined area controlled by local ter-rain conditions; it may also include a description of the ve-locity and intensity of an existing or potential landslide (Fell et al., 2008; Günther et al., 2013; Guzzetti et al., 1999). Land-slide susceptibility reflects the degree to which a terrain unit can be affected by future slope movements (Günther et al., 2013).
and van Westen, 1996; van Westen et al., 2008; Zêzere et al., 2008, 2017).
Beyond the influence of different environmental factors (e.g., lithology, slope angle, slope morphology, topography, soils, and hydrology) on the spatial distribution of landslides, land use and land cover (LUC) dynamics are also an im-portant factor on landslide susceptibility assessment (Guil-lard and Zêzere, 2012). Certain land use and land cover changes (LUCCs) (e.g., deforestation, slope ruptures to road construction, steep slopes) increase the number of unstable slopes (Reichenbach et al., 2014), i.e., promoting the propen-sity for landslide occurrence, and can have an important im-pact on landslide activity (Beguería, 2006; Glade, 2003; Mu-gagga et al., 2012; Persichillo et al., 2017; van Westen et al., 2008).
The LUC, while a proxy variable, is very dynamic over time and is influenced by climate-driven changes and direct anthropogenic impacts (Promper et al., 2014). In this regard, it is an important predisposing factor to landslide susceptibil-ity assessment, and Dymond et al. (2006) mention that im-portance: “the quality of the input land-cover map is impor-tant because the main purpose of the landslide susceptibility model is to identify where land cover needs to be changed.”
For instance, performing a landslide susceptibility analysis with a historical inventory over long periods (e.g., decades) demands the use of a permanent set of predisposing factors along the landslide inventory timeline. LUC can change over time; for this reason, it will be more accurate to use the LUC for different periods (Reichenbach et al., 2014) than using the most recent LUC map, to avoid spatial relations between past slope instability and incorrect LUC classes.
The scale of the predisposing factors directly influences the map elements’ representation and detail, as well as the choice of the scale of analysis of the final results (Leitner, 2004; Stoter et al., 2014). The choice in the level of de-tail will also constrain the modeling results. For example, Meneses et al. (2018b, c) obtained different LUCC results in Portugal due to the use of different LUC datasets, namely the CORINE Land Cover (CLC) and the official Land Cover Map of Portugal (Portuguese designation and acronymCarta de Ocupação do Solo, COS), with different properties con-cerning the scale (1:100 000 and 1:25 000, respectively), minimum mapping unit (25 and 1 ha, respectively), and gen-eralization level (Table 1).
Due to the variation in the road network morphology (the length vs. width of the roads), the selection of appropriate data that integrate the analysis of road blockages caused by landslides requires a systematic assessment of the detailed properties of the landslide predisposing factors (Drobnjak et al., 2016; Imprialou and Quddus, 2017; Kazemi and Lim, 2005; Orongo, 2011) to obtain detailed landslide susceptibil-ity results at the local scale (roads).
In this context, the main goal of this work is to evaluate the influence of the LUC data properties on the landslide suscep-tibility zonation of road networks. Two specific goals were
defined: (i) to evaluate and quantify the landslide suscepti-bility results using two LUC datasets (CLC 2006 and COS 2007) with different properties (scale and minimum mapping unit) in two landslide susceptibility models; (ii) to use the output results of the two landslide susceptibility models to identify the sections of the main road network with the high-est landslide susceptibility that will suffer future road block-ages.
2 Materials and methods 2.1 Study area
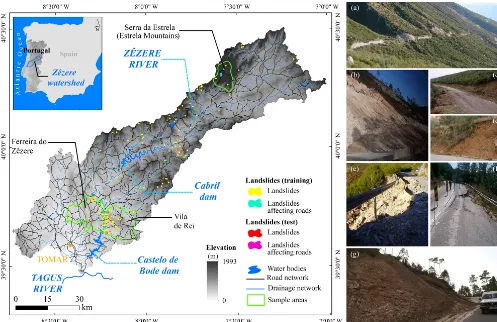
This study was performed in the Zêzere watershed (5063.9 km2) located in the center region of mainland Por-tugal (Fig. 1). The north-northwest sector of this watershed is occupied by the Serra da Estrela, reaching a maximum el-evation of 1993 m, where steep slopes can be found; in the central sector, the relief is less irregular when compared to the previous sector, but it still has steep slope areas (e.g., the vicinity of the Castelo de Bode and Cabril reservoirs); in the south-southwest sector, gentle slopes and flat areas are pre-dominant.
The soils of the Zêzere watershed are very variable among the north-northwest, center, and southwest sectors. In the northwest sector, Cambisols predominate, with small areas of Fluvisols and eutric Lithosol along the Zêzere River. In the central area, Lithosols are dominant, with some areas of Cambisols. In the south-southwest sector, there are areas of Lithosols intercalated with Cambisols and Luvisols.
According to CLC 2006, the predominant types of LUC in the study area are forest and seminatural areas, which rep-resent 72 % of the watershed area. Other LUC types are less representative, for example, agricultural land (25.5 %), arti-ficialized land–urban areas (1.5 %), and water bodies (1 %), including an important freshwater reservoir, the Castelo de Bode dam (Meneses et al., 2015a). The LUC of this water-shed is very dynamic, highlighting the LUCC in forest and agricultural areas derived from multiple socioeconomic driv-ing forces (Meneses et al., 2017) and the degradation of vast forest areas by wildfires (Meneses et al., 2018a).
Due to the large extension of this watershed, three sample areas were selected according to the high density of land-slides observed in these locations: the Serra da Estrela, Vila de Rei, and Ferreira do Zêzere municipalities (areas of 86.7, 191.5, and 190.4 km2, respectively), where fieldwork was de-veloped to validate part of the landslide inventory and the disruption of roads caused by landslides.
2.2 Data
Table 1.Properties of LUC data.
Properties Land cover maps of Portugal CORINE land cover
Acronym COS CLC
Scale 1:25 000 1:100 000
Minimum mapping unit 1 ha 25 ha
Data structure Vector Vector
Geometry Polygons Polygons
Minimum distance between lines 20 m 100 m
Base data Orthophotos Satellite images
Spatial resolution 0.5 m 20 m
Nomenclature Hierarchical (five levels) Hierarchical (three levels)
225 classes 44 classes
Production method Visual interpretation Semiautomated production
and visual interpretation
Date of production 2007 2006
Castellanos Abella, 2008; Guzzetti et al., 1999; Reichenbach et al., 2018; Soeters and van Westen, 1996; van Westen et al., 2008; Zêzere et al., 2008, 2017) (Fig. 2).
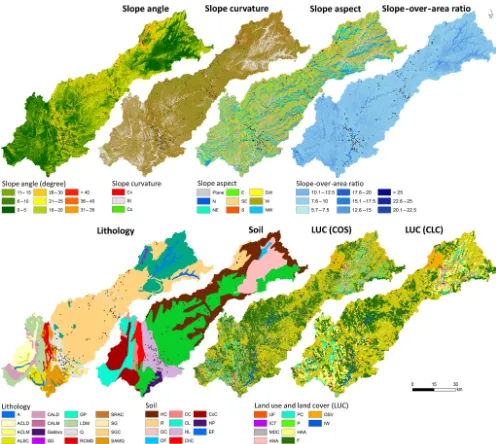
Six fixed landslide predisposing factors were considered: slope angle, slope aspect, slope curvature, slope-over-area ra-tio (SOAR), soil, and lithology. The LUC types of COS and CLC were used to find the differences in the landslide sus-ceptibility zonation. The set of landslide predisposing fac-tors and the corresponding classes (Fig. 2) were the same in all models, only changing the LUC data.
In general terms, an increasing slope angle promotes land-slide occurrence and is a very good proxy of the shear stress (Zêzere et al., 2017). Slope instability is more frequent at the higher slope angles of the Serra da Estrela and throughout the Zêzere River valley. Also, in these areas, convex slope cur-vature is predominantly related to slope instability. The slope aspect is important in the spatial distribution of the different LUC types of the study area (Fig. 2) and in slope instability, especially in northwest-facing slopes (more exposed to rain and with higher humidity levels).
The SOAR is a proxy variable of the moisture reten-tion, the soil water content, and the surface saturation zones (Zêzere et al., 2017), highlighting, in the Zêzere watershed, the upstream (very close to the Zêzere River) and southwest areas with a higher SOAR.
In the sample areas of the Vila de Rei and Ferreira do Zêzere municipalities, where a high landslide density was observed, schist and metasedimentary lithologies are pre-dominant. Further, slope instability in the watershed is higher in the hortic Luvisols and in the LUC classes of forest and shrubland or herbaceous vegetation associations (Fig. 1).
The official LUC data available for the study area are CLC produced by the European Environment Agency (EEA) and COS produced by the General Directorate for Territorial De-velopment (DGT) in Portugal. These LUC data (CLC and COS) have different properties and have been used in sev-eral studies about landslides in Portugal (e.g., Guillard and Zêzere, 2012; Meneses et al., 2015b; Piedade et al., 2011; Reis et al., 2003; Zêzere et al., 2017).
Table 1 describes the main properties of these LUC data (DGT, 2013; EEA, 2007; IGP, 2010). Among the differences between the two LUC datasets, the scale is highlighted be-cause COS is the most detailed relative to CLC (proportion 1/4). However, the properties are not proportional between the two LUC datasets; while the COS features have a min-imum mapping unit of 1 ha, CLC has a minmin-imum mapping unit of 25 ha, and the minimum distance between lines is 20 m in COS, while in CLC it is 100 m.
To reduce possible discrepancies in the field, the LUC data were collected for near dates: CLC 2006 and COS 2007. The LUC data were developed with base information that matches in temporal terms, for example, the satellite images, orthophotos, and agricultural and forestry inventories used as auxiliary information. The nomenclature of these LUC data corresponds to the third level (see the official CLC nomen-clature on the EEA website). In this study, the second level of the CLC nomenclature was used because it has a lower number of classes for the study area (12 of 31 classes).
Figure 1.Zêzere watershed and landslide inventory. The pictures represent landslides that affected roads: A, B, C, D, and E – municipality roads of Serra da Estrela; F – Ferreira do Zêzere; G – Vila de Rei.
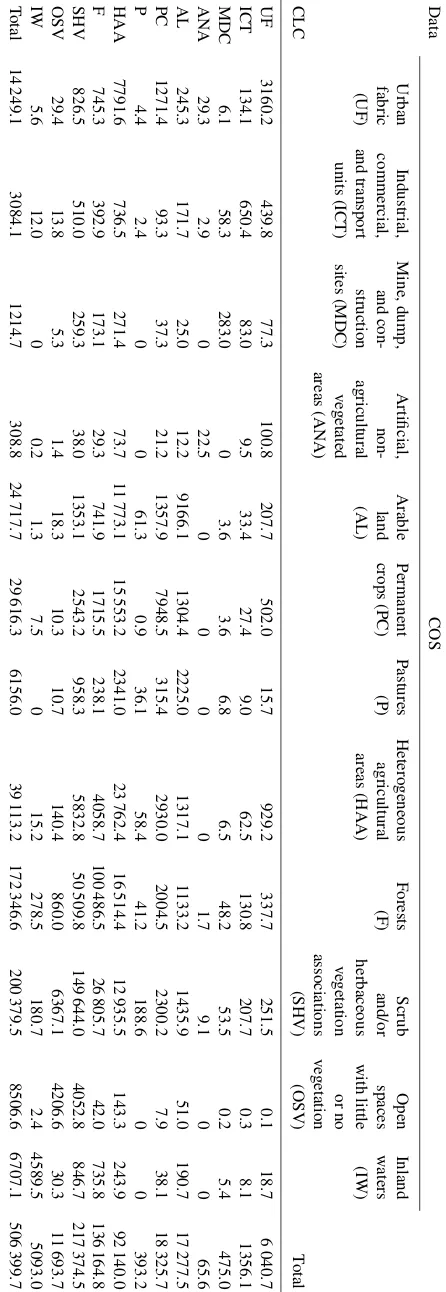
respectively) because a part of COS (approximately 10 % of the study area) is classified as scrub and/or herbaceous veg-etation associations in CLC. The reverse was also verified; approximately 5 % of the study area is classified as scrub and/or herbaceous vegetation associations in COS, and this same area is represented by forest class in CLC. These dis-crepancies are derived from the LUC data properties because COS is more detailed and represents more degraded forest areas, especially where wildfires occurred. These events af-fected a large percentage of the watershed (Meneses et al., 2018a), especially the central sector, as a vast burned area culminated in a large transition of forest area to shrubland.
The forest, scrub and/or herbaceous vegetation associa-tions and open spaces with little or no vegetation are the LUC types predominant in the hillsides with steep slopes (see Tables S1 and S2 in the Supplement). The remaining LUC classes present more area in the lower slopes (>10◦).
The soil and lithology data were obtained from the envi-ronment atlas web platform published by the Portuguese En-vironment Agency (APA) at a 1:1 000 000 scale. A digital elevation model (DEM) was built using digital topographic maps at a 1:25 000 scale (IGEOE), containing contour lines with 10 m equidistance.
Slope angle, slope aspect, slope curvature, and SOAR (to-pographic wetness index) layers were extracted from the DEM. Road network data (vector lines) were extracted from Portugal’s military cartography (itinerary maps, 1:500 000 scale), available on the Portuguese Army Geospatial Infor-mation Center’s website. The road network was classified ac-cording to the roads’ width and their network hierarchy. Con-sidering the road center line, a buffer of 5 m was defined for municipal roads, 10 m for complementary roads, and 20 m for superhighways. These distances were measured with ge-ographic information systems (GIS) on the study area roads (directly on the orthophotos).
T able 2. LUC data agreement (area in hectares) between CLC and COS classes. Data COS Urban Industrial, Mine, dump, Artificial, Arable Permanent P as tures Heterogeneous F orests Scrub Open Inland fabric commercial, and con- non-land crops (PC) (P) agricultural (F) and/or spaces w aters (UF) and transport struction agricultural (AL) areas (HAA) herbaceous with little (IW) units (ICT) sites (MDC) v egetated v egetation or no areas (AN A) associations v egetation CLC (SHV) (OSV) T otal UF 3160.2 439.8 77.3 100.8 207.7 502.0 15.7 929.2 337.7 251.5 0.1 18.7 6 040.7 ICT 134.1 650.4 83.0 9.5 33.4 27.4 9.0 62.5 130.8 207.7 0.3 8.1 1356.1 MDC 6.1 58.3 283.0 0 3.6 3.6 6.8 6.5 48.2 53.5 0.2 5.4 475.0 AN A 29.3 2.9 0 22.5 0 0 0 0 1.7 9.1 0 0 65.6 AL 245.3 171.7 25.0 12.2 9166.1 1304.4 2225.0 1317.1 1133.2 1435.9 51.0 190.7 17 277.5 PC 1271.4 93.3 37.3 21.2 1357.9 7948.5 315.4 2930.0 2004.5 2300.2 7.9 38.1 18 325.7 P 4.4 2.4 0 0 61.3 0.9 36.1 58.4 41.2 188.6 0 0 393.2 HAA 7791.6 736.5 271.4 73.7 11 773.1 15 553.2 2341.0 23 762.4 16 514.4 12 935.5 143.3 243.9 92 140.0 F 745.3 392.9 173.1 29.3 741.9 1715.5 238.1 4058.7 100 486.5 26 805.7 42.0 735.8 136 164.8 SHV 826.5 510.0 259.3 38.0 1353.1 2543.2 958.3 5832.8 50 509.8 149 644.0 4052.8 846.7 217 374.5 OSV 29.4 13.8 5.3 1.4 18.3 10.3 10.7 140.4 860.0 6367.1 4206.6 30.3 11 693.7 IW 5.6 12.0 0 0.2 1.3 7.5 0 15.2 278.5 180.7 2.4 4589.5 5093.0 T otal 14 249.1 3084.1 1214.7 308.8 24 717.7 29 616.3 6156.0 39 113.2 172 346.6 200 379.5 8506.6 6707.1 506 399.7
Figure 3.Landslide size frequency distribution.
were confirmed. In these sample areas, road disruptions were also validated.
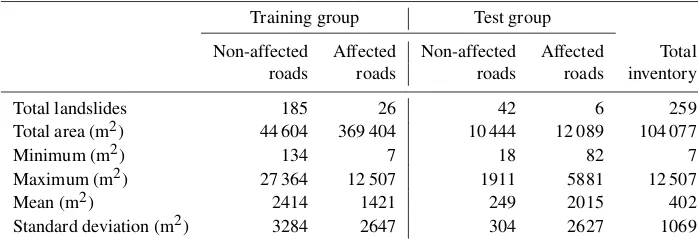
For the complete Zêzere watershed, 259 landslides were identified, predominantly of shallow type. Of the total, 32 landslides directly affected the road network (total or partial blockages by the material and seven cases with partial loss of infrastructure). The landslide inventory was randomly di-vided into two subsets (Fig. 1) (Chung and Fabbri, 2003): the landslide training group and the landslide test group (81.5 % and 18.5 % of the total landslide affected area, respectively). The statistical description of each landslide group is pre-sented in Table 3.
The landslide size frequency distribution is different be-tween the landslides that affected the road network and those that did not (Fig. 3). The area of the majority of landslides ranges between 101 and 200 m2, while most of the land-slides that affected the road network present a larger area (>1000 m2).
All the predisposing factors and landslide inventory were converted to raster (resolution 10 m) to assess the landslide susceptibility. The selection of the predisposing factors’ cell size was based on several geoinformation conversion tests in the Zêzere watershed previously performed by Meneses et al. (2016, 2018b).
2.3 Methods
Table 3.Statistics description of the training group and test group landslide inventories.
Training group Test group
Non-affected Affected Non-affected Affected Total
roads roads roads roads inventory
Total landslides 185 26 42 6 259
Total area (m2) 44 604 369 404 10 444 12 089 104 077
Minimum (m2) 134 7 18 82 7
Maximum (m2) 27 364 12 507 1911 5881 12 507
Mean (m2) 2414 1421 249 2015 402
Standard deviation (m2) 3284 2647 304 2627 1069
The IV of each class within each explanatory variable is given by Eq. (1) (Yan, 1988; Yin and Yan, 1988):
IVxi=ln
Si/Ni
S/N , (1)
where IVxi is the IV of the variablexi,Si is the number of terrain units with landslides and the presence of variablexi; Ni is the number of terrain units with variablexi,S is the total number of terrain units with landslides, and N is the total number of terrain units.
The IV method was applied in several landslide suscepti-bility zonation studies, providing good results (e.g., Che et al., 2012; Chen et al., 2016; Conforti et al., 2012) at the re-gional scale. This method was also applied in several studies conducted in Portugal, with good performance in suscepti-bility assessment (e.g., Guillard and Zêzere, 2012; Oliveira et al., 2015b; Pereira et al., 2014; Zêzere et al., 2017).
The a priori probability of finding a landslide unit in the study area(S/N )and conditional probabilities for each class of the independent variables (Si/Ni) were calculated, obtain-ing the IV for these classes. However, the IV method presents constraints on obtaining the natural logarithm for negative re-sults; in this case, the lower value calculated for each variable was assigned to classes whenSi was equal to zero.
The IVs of all the variables were combined to obtain the landslide susceptibility map (LSM). For the final landslide susceptibility assessment, i.e., the integration of the IVs of all the independent variables, the following equation was con-sidered:
IVj= n X
i=0
XijIi, (2)
where IVj is the total IV of the cellj,Ii is the information value of each cell of each independent variable,nis the num-ber of variables, andXij assumes the value 1 or 0, depending on the presence or absence of the variable in the terrain unit. Landslide susceptibility model performance was assessed using training landslides. Landslide areas in the test group were only used to perform an independent validation of the landslide susceptibility. Prediction rate curves (PRCs) were
computed for each final LSM (Chung and Fabbri, 1999, 2003) and also the area under the curve (AUC). Success rate curves (SRCs) were obtained for the landslide susceptibil-ity road network maps using only the landslides that affected roads.
The importance of each independent variable in the land-slide susceptibility assessment was also determined, so that the spatial influence of each predisposition factor in the mod-els can be understood. The accountability (AI) and reliability
(RI) indexes have been used in different contexts to assess
the importance of each independent variable in the bivari-ate statistical methods (e.g., Blahut et al., 2010; Meneses et al., 2016). AI explains how different classes of
predisposi-tion factors are relevant in the analysis because they contain the landslide area, while RIdepends on the average density
of the landslide area in the predisposing factor classes that are more relevant to the development of this process. In this procedure, the AIand RIwere determined using Eqs. (3) and
(4), respectively (Blahut et al., 2010).
AI=
n P
i=1
k
N 100 (3)
RI=
n P
i=1
k n P
i=1
y
100 (4)
Herek is the landslide area in classes with the conditional probability values higher than a priori probability,N is the total landslide area, andy is the area of each class of inde-pendent variable with a conditional probability above the a priori probability.
Figure 4.Workflow of landslide susceptibility assessment (using different LUC datasets) and the road susceptibility data integration.
Information values of LSM1 and LSM2 were assigned to the road network (using GIS), resulting in a road network map with the landslide susceptibility location (landslide sus-ceptibility of the road network – LSRN1 and LSRN2), where there is a higher spatial probability of road interruption or road interference caused by landslides. Different outputs of the two models (road network) were compared using the overall agreement and kappa coefficient (Congalton and Green, 2009), allowing the assessment of the consistency and agreement of the obtained results with different LUC datasets. The information of road disruptions caused by land-slides was used to validate these results.
Landslide susceptibility maps were built and classified in 10 classes (deciles) containing an equal number of terrain units to allow visual comparison of the results.
3 Results
3.1 Landslide susceptibility
The landslide susceptibility results show spatial contrasts in the study area. Some areas in the center of the water-shed (highlighting the vicinity of the Castelo de Bode reser-voir) and the northern sectors (highlight the Serra da Es-trela) present the highest landslide density and susceptibility (Fig. 5).
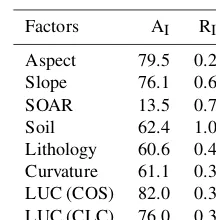
The results of the AIand RIindexes show important
dif-ferences among the predisposing factors that have been inte-grated in the landslide susceptibility models (Table 4). The
Table 4.Results of the accountability (AI) and reliability (RI)
in-dexes.
Factors AI RI
Aspect 79.5 0.2
Slope 76.1 0.6
SOAR 13.5 0.7
Soil 62.4 1.0
Lithology 60.6 0.4
Curvature 61.1 0.3
LUC (COS) 82.0 0.3
LUC (CLC) 76.0 0.3
LUC predisposing factors (COS and CLC) registered the highest AI results, highlighting COS’s LUC types with a
higher AI. These results show the relevance of certain classes
of COS in the predisposing factor dataset, by the number of landslide areas covered (emphasis on the forests, scrubland, and/or herbaceous vegetation associations, and open spaces with a scarcity or absence of vegetation).
The soil, SOAR, and slope angle present the highest val-ues in the case of RI, which shows that landslide density is
concentrated in a reduced number of classes of each of the predisposing factor areas (e.g., hortic Luvisols, SOAR [22.5– 25], and slope [between 25 and 45◦]).
Figure 5.Landslide susceptibility (IV represented from the highest – red – to the lowest susceptibility – green): the map of Susceptibility M1 represent the results obtained with model 1 (performed with COS data) – LSM1; the map Susceptibility M2 represent the results obtained with model 2 (performed with CLC data) – LSM2. The map on the right is the variation between LSM1 and LSM2.
The PRCs of each final susceptibility map (obtained from the results of the landslide training group) show slight varia-tions (Fig. 6), but, in general terms, the curves are identical, demonstrating the high and similar performance of the mod-els in the determination of landslide-susceptible areas.
The AUC of LSM1 and LSM2 that includes the same landslide information used to train the models is 94.1 % and 93.9 %, respectively. These results (landslide prediction) were considered to integrate the landslide susceptibility road network (LSRN1 and LSRN2) and the next analyses pre-sented. Additionally, spatial differences were observed in the landslide susceptibility maps (Fig. 5), reflecting the differ-ences of the influence of LUC properties.
When the two landslide susceptibility maps are reclassi-fied into two classes (not susceptible IV≤0 and susceptible IV>0), the susceptible area in LSM1 corresponds to 19.7 % and in LSM2 to 20.8 %. The CLC data provide IV results lower than the IV obtained with the COS data, but CLC is more generalized and justifies that the most susceptible area is observed in LSM2, compared to LSM1. The variation be-tween the maximum and minimum IVs (3 and−3 of1IV in Fig. 5) show the landslide susceptibility differences derived from spatial representation of LUC classes of the two LUC datasets considered. The highest variations between LSM1 and LSM2 are found in places with reduced IVs (low and moderate susceptibility), marking the central sector of the study area. The areas with the highest IVs in LSM1 and LSM2 present a lower variation.
Figure 6.Prediction rate curves (PRCs) of the landslide suscepti-bility (LSM1 – COS and LSM2 – CLC).
how-Figure 7.Density of roads by LUC class of CLC and COS data (see LUC legend in Fig. 2).
ever, when a tabulation of the area of the road network used in this research and the LUC datasets was performed, the density of the roads was different in each LUC class between datasets (Fig. 7).
The IVs of LSM1 and LSM2 assigned to the road network differentiated the roads according to the landslide suscepti-bility, representing the highest IV where future landslides will occur and possibly rupture the road network or cause socioeconomic constraints due to total or partial blockages. In this case, the differences in the roads’ landslide suscepti-bilities were also analyzed.
The IVs assigned to the road network do not have spatial agreement between the two models. The difference between the maximum and minimum IVs of the LSRN1 and LSRN2 variations is significant, with IV variation of approximately 1. The interquartile range of the IV is greater in LSRN2 than in LSRN1 (Fig. 8). However, the IV average is similar in LSRN2 in comparison to LSRN1.
The landslide susceptibility map of the road network ob-tained by LSM1 (resulting in LSRN1) (Fig. 9) shows that it is spatially contrasted along the road network, highlight-ing the places where future landslides that may cause dis-turbances on the roads are most likely to occur. Conversely, in the landslide susceptibility map of the road networks ob-tained by LSM2 (resulting in LSRN2), the IV assigned to the road network is generally lower when compared to LSRN1, a result derived from the LUC generalization (CLC) used in the input of model 2.
LSRN1 includes 14.1 % of the roads with a positive land-slide susceptibility (IV≥0), and the roads with high land-slide susceptibility (IV>10) represent only 0.1 % of the total road network (Fig. 9). In LSRN2, the positive landslide sus-ceptibility (IV≥0) increases (compared with LSRN1) and
Figure 8.Landslide susceptibility of the road network. LSRN1 – IV assigned for LSM1; LSRN2 – IV assigned for LSM2.
comprises 14.7 % of the total road network, where 0.1 % of this network corresponds to a high landslide susceptibility (IV>10).
LSRN2 does not show a high variation in short road dis-tances; i.e., the IV tends to be extended within each polygon of the same class of the CLC’s LUC (larger polygons in com-parison with the COS data), reducing the IV variation along the roads. The variation in the IV within each polygon of the LUC data is only explained by the remaining predisposing factors included in the model.
In LSRN2, the places with a high landslide susceptibil-ity are not always identified as those where landslides ef-fectively occurred (Fig. 10). The landslide susceptibility of the road network enhances the results obtained with COS (LSRN1) in areas with very high landslide susceptibility, precisely where landslides were validated in the fieldwork. These results show the importance of LUC data properties in the spatial differentiation of landslide susceptibility.
The spatial agreement and kappa coefficient between the LSRN1 and LSRN2 landslide susceptibility classes are 89.7 and 83.1 %, respectively (Table 5). In general, the individual susceptibility classes present a high agreement (≥80 %, ex-cept the high and very high classes of LSRN2) but with dif-ferences between the two models. For example, the landslide susceptibility class “very high” comprises 0.05 % and 0.06 % of the total road network in LSM1 and LSM2, respectively, but LSRN2 presents 20.4 % of the omission differences in the same susceptibility class compared to the 3.8 % commis-sion differences of LSRN1. The intermediary susceptibility classes of the two models highlight the omission and com-mission differences.
co-Figure 9.Landslide susceptibility of the road network (LSRN1 and LSRN2) and the ratio between landslide susceptibility classes of the roads. LSRN1 – IV assigned for the LSM1; LSRN2 – IV assigned for the LSM2.
Figure 10.Examples of the landslide susceptibility of the road network in the Ferreira do Zêzere municipality. 1 – LSRN1; 2 – LSRN2.
efficient of 0.98 (significance levelp<0.05). The results of this correlation reflect the existence of an agreement on the spatial variation between LSRN1 and LSRN2; i.e., in gen-eral, when the IV of one output increases the other also in-creases, or vice versa, regardless of the discrepancy among the IVs of the same cells of each output.
The LSRN1 and LSRN2 results were crossed with all landslides that caused perturbations or disruptions of the road network, and the performance of models was assessed. Over-all, the results were very good, with 89.5 % and 89.3 % AUC
to-Table 5.Spatial agreement between LSRN1 and LSRN2 (percentage of road network).
LSRN2
Very low Low Moderate High Very high Total area Agreement Commission
LSRN1 (IV<−5) (IV−5–0) (IV 0–5) (IV 5–10) (IV>10) (%) (%) differ. (%)
Very low (IV<−5) 46.3 2.2 0.0 0.0 0.0 48.5 95.5 4.5
Low (IV−5–0) 3.5 31.7 2.3 0.0 0.0 37.4 84.6 15.4
Moderate (IV 0–5) 0.0 1.7 10.1 0.5 0.0 12.3 82.4 17.6
High (IV 5–10) 0.0 0.0 0.2 1.5 0.01 1.7 88.1 11.9
Very high (IV>10) 0.0 0.0 0.0 0.0 0.05 0.05 96.2 3.8
Total area (%) 49.8 35.5 12.58 2.03 0.06
Agreement (%) 93.0 89.2 80.3 75.0 79.6 Overall agreement: 89.7 %
Omission differ. (%) 7.0 10.8 19.7 25.0 20.4 Kappa coefficient: 83.1 %
Figure 11.Success rate curves of LSRN1 and LSRN2 models.
tal area of the road network, while LSRN2 is validated with 74 % of its area.
4 Discussion
In landslide hazard and risk assessment, the LUC data inte-grate the controlling factor group and, in many evaluations, are directed by another factor input to the model. Usually LUC data are used as a landslide conditioning factor, which, in some cases, is scarce, generalized, and not very detailed. For example, Eeckhaut and Hervás (2012) verified that in dif-ferent locations of Europe CLC is widely used for landslide assessment because it is the only LUC data available. Re-mote sensing and satellite images contributed to LUC data acquisition for landslide susceptibility assessment in differ-ent times (Guzzetti et al., 2012) and territories and minimize
some problems of scarcity and detail (thematic and resolu-tion). LUC is an important conditioning factor in landslide susceptibility (Pisano et al., 2017), and the high accountabil-ity index results prove this fact (Table 4).
There are several studies about the influence of land use cover changes on landslide susceptibility (e.g., Karsli et al., 2009; Mugagga et al., 2012; Promper et al., 2014; Reichen-bach et al., 2014), although to the best of our knowledge there are no approaches that analyze the influence of different LUC datasets with different properties (date and base maps used on the production, spatial resolution, scale, minimum mapping unit, or others) on the landslide susceptibility re-sults. When the landslide predisposing factors are collected, the LUC dataset must be selected according to its abovemen-tioned properties and not only on the basis of its availability and free-of-charge conditions.
When different LUC datasets are available, the choice for the LUC dataset used in the landslide susceptibility assess-ment is not always clearly justified, and the results may vary according to LUC data properties selected. For Portugal dif-ferent LUC datasets (with difdif-ferent properties) are available, but the use of each dataset can generate different conclusions; for example, different land use and land cover changes in the same period were observed by Meneses et al. (2018c).
This study highlights the landslide susceptibility differ-ences derived exclusively from the LUC data properties be-cause the other predisposing factor maps are the same in both models. Although if another method is used or the terrain mapping unit or another characteristic is changed, the results may vary, which has already been widely discussed (Chen et al., 2016; Den Eeckhaut et al., 2010; Guzzetti et al., 2006; Oliveira et al., 2015a; Zêzere et al., 2017).
Some research works refer to the quality of geoinforma-tion (scale and precision) on the final result changes (e.g., Etter et al., 2006). In this case, the degree of completeness and the positional, geometric, and thematic agreement of the selected LUC data were evaluated by different proprietary institutions, with more than 80 % accuracy, i.e., where the semantic inconsistency error was reduced, an important fac-tor in reducing the error propagation and achieving a product with the best quality (Van Oort and Bregt, 2005; Regnauld, 2015).
The landslide inventory was obtained by photointerpreta-tion, which is certainly not complete, especially in forest and agricultural areas, a fact that could have an impact on the landslide susceptibility zonation of the study area. This in-ventorying method does not allow for shallow or small land-slide identification in forest areas, where the type, height, and density of the vegetation is important to landslide activity (Guzzetti et al., 2012), or in cultivated areas where agricul-tural practices erase the morphological and LUC signature of slope failures (Fiorucci et al., 2011). The quality and com-pleteness of the landslide inventories can interfere with the quality of future landslide spatial occurrences (Galli et al., 2008; Guzzetti et al., 2012; Reichenbach et al., 2018). How-ever, the landslide inventory is the same for both landslide models presented in this research, and the variation results depend exclusively on the LUC datasets that are integrated into each model.
The correlation between the outputs of each model is high, but there are spatial differences between them. The COS data are more detailed (1:25 000) than the CLC data (1:100 000), and the LUC classes are more differentiated in the territory, allowing greater detail and agreement in de-termining the areas with high landslide susceptibility, which were verified in LMS1. In model 2, CLC data are less de-tailed and contribute to IVs that are lower (low and very low landslide susceptibility in LSM2) compared with LSM1.
IV is more generalized along the road network at LSRN2 when compared with LSRN1, results derived exclusively from the input of LUC data with different properties in the models. These results highlight the importance of general-ization and scale of LUC data selected in the landslide sus-ceptibility assessment.
In the road network intersection with the LUC data, a high absence of road data was observed in the class indus-trial, commercial, and transport units, which is explained by the cartographic generalization due to the minimum map-ping unit and minimum distance among lines of each LUC dataset. These factors exclude the road data due to the mini-mum requirements defined in the technical specifications of each LUC dataset creation. However, the distribution of the road network among the LUC classes is quite variable in both LUC datasets (COS and CLC), one of the factors that also justifies the variation in landslide susceptibility observed in different outputs.
The results of the PRC and AUC for LSM1 and LSM2 show a high quality and performance of both models in the landslide susceptibility area determination (Guzzetti et al., 2006), but LSM1 presents a slightly better performance. Nevertheless, the prediction landslide results were validated with the landslide test group and present good results to be assigned in the road network.
The LSRN1 and LSRN2 models’ validation results demonstrate that the models effectively identify the places where the landslides occurred and are more likely to occur in the future. In this case, the SRC and AUC note the high efficiency of the models (Guzzetti et al., 2006), with LSRN1 having a slightly higher efficiency, highlighting the proper-ties of the LUC data.
Some roads in the study area were affected by landslides, a fact confirmed during the fieldwork developed to validate the landslide inventory (examples of some road blockage or damage in the Serra da Estrela and sample areas). In certain cases, the affected roads are important accesses points for the most isolated villages in the study area, and, in some cases, a landslide can isolate the villages because part of the affected infrastructure is the only public access, a fact verified in the sample areas.
The results highlight the importance of LUC data proper-ties in landside assessment. More detailed LUC data (COS data) allow better landslide susceptibility results, a fact that was also described by Dymond et al. (2006), identifying some places where landslides occurred in the study area. De-tailed predisposing factor data are recommended in landslide susceptibility assessment, a fact also mentioned in other stud-ies. For example, Fressard et al. (2014) refer to the impor-tance of detail in geomorphological variables to obtain high-quality results in landslide prediction.
This study was performed in a specific watershed, which highlights that landslide susceptibility changes according to the LUC data properties. It is recommended that the LUC data to be used as a predisposing factor of landslide suscep-tibility (e.g., in road networks) be as detailed as possible and small-scale LUC datasets be avoided (≥25 000). Further re-search is needed to test if these results change when the scale is different (e.g., national scale or very detailed scale).
5 Conclusions
Landslide susceptibility in the Zêzere watershed is spatially variable, highlighting some characteristics of the study area’s geo-factors in high landslide density in a specific location, for example, the highest slope angles and certain LUC types (e.g., forests and scrubland) and lithology.
The properties of the data that are integrated into the land-slide susceptibility models are also an important issue to be considered since the variation in the properties of the same geo-factor provided different results, in this case LUC with different properties.
More detailed LUC data (COS) allow better landslide sus-ceptibility results, while more generalized LUC data (CLC) resulted in the landslide susceptibility being more reduced, disallowing the identification of some places where land-slides occurred. However, the results of the two susceptibil-ity models showed good performance, a fact demonstrated by the validation of the models’ results.
The assignment of the landslide susceptibility results to the road network allowed the identification of the locations with the highest spatial probability for landslide occurrence. The LSRN1 map stands out with better results due to the inte-gration of the COS dataset, showing the importance of LUC data detail in the identification of locations where landslides have occurred. The LSRN2 map does not have good perfor-mance in the identification of high landslide susceptibility in all road sections where landslides have occurred. In general, both LSRN1 and LSRN2 show the same trend in the spatial variation in landslide susceptibility of the study area’s road network, highlighting the high susceptibility on the slopes of the Serra da Estrela and near the Castelo de Bode reservoir.
Finally, LUC data properties were shown to be important in the variation in landslide susceptibility results. When the locations where landslides are likely to occur are known, al-ternative options can be created to avoid partial or complete isolation of certain localities, reduce the social and economic constraints of this population, and adopt preventive measures and alternative evacuation paths in case of landslide occur-rence.
Data availability. The data used in this paper are accessible at http: //www.dgterritorio.pt/, https://land.copernicus.eu/pan-european/ corine-land-cover (LUC), https://sniamb.apambiente.pt/ (soil and llithology), and https://www.igeoe.pt (road network). All websites were last accessed on 10 June 2017.
Supplement. The supplement related to this article is available online at: https://doi.org/10.5194/nhess-19-471-2019-supplement.
Author contributions. All authors contributed to the preparation of this paper.
Competing interests. The authors declare that they have no conflict of interest.
Special issue statement. This article is part of the special issue “Landslide-road network interactions”. It is not associated with a conference.
Acknowledgements. This work was financed by national funds through the FCT-Portuguese Foundation for Science and Tech-nology, I.P., under the framework of the project BeSafeSlide – Landslide early warning soft technology prototype to im-prove community resilience and adaptation to environmental change (PTDC/GES-AMB/30052/2017) and by Research Unit UID/GEO/00295/2013 (Centre for Geographical Studies). Bruno Meneses was financed through a grant of the Institute of Geography and Spatial Planning and Universidade de Lisboa, IGOT-UL (BD2015).
Edited by: Thomas Glade
Reviewed by: two anonymous referees
References
Beguería, S.: Changes in land cover and shallow landslide activity: A case study in the Spanish Pyrenees, Geomorphology, 74, 196– 206, https://doi.org/10.1016/j.geomorph.2005.07.018, 2006. Berdica, K.: An introduction to road vulnerability: What has been
done, is done and should be done, Transp. Policy, 9, 117–127, https://doi.org/10.1016/S0967-070X(02)00011-2, 2002. Bíl, M., Kubeˇcek, J., and Andrášik, R.: An epidemiological
ap-proach to determining the risk of road damage due to landslides, Nat. Hazards, 73, 1323–1335, https://doi.org/10.1007/s11069-014-1141-4, 2014.
Bíl, M., Vodák, R., Kubeˇcek, J., Bílová, M., and Sedoník, J.: Eval-uating road network damage caused by natural disasters in the Czech Republic between 1997 and 2010, Transport. Res. A.-Pol., 80, 90–103, https://doi.org/10.1016/j.tra.2015.07.006, 2015. Blahut, J., Westen, C., and Sterlacchini, S.: Analysis of landslide
inventories for accurate prediction of debris-flow source areas, Geomorphology, 119, 36–51, 2010.
Castella, J. C., Pheng Kam, S., Dinh Quang, D., Verburg, P. H., and Thai Hoanh, C.: Combining top-down and bottom-up mod-elling approaches of land use/cover change to support public policies: Application to sustainable management of natural re-sources in northern Vietnam, Land use policy, 24, 531–545, https://doi.org/10.1016/j.landusepol.2005.09.009, 2007. Castellanos Abella, E. A.: Provincial landslide risk assessment, in
Multi-scale landslide risk assessment in Cuba, edited by: Castel-lanos Abella, E. A., 101–152, ITC Dissertation 154, Utrecht Uni-versity, Utrecht, 2008.
Chen, T., Niu, R., and Jia, X.: A comparison of information value and logistic regression models in landslide susceptibil-ity mapping by using GIS, Environ. Earth Sci., 75, 1–16, https://doi.org/10.1007/s12665-016-5317-y, 2016.
Chung, C.-J. and Fabbri, A.: Probabilistic prediction models for landslide hazard mapping, Photogramm. Eng. Rem. S., 65, 1389–1399, 1999.
Chung, C.-J. and Fabbri, A.: Validation of Spatial Prediction Mod-els for Landslide Hazard Mapping, Nat. Hazards, 30, 451–472, https://doi.org/10.1023/B:NHAZ.0000007172.62651.2b, 2003. Conforti, M., Robustelli, G., Muto, F., and Critelli, S.: Application
and validation of bivariate GIS-based landslide susceptibility as-sessment for the Vitravo river catchment (Calabria, south Italy), Nat. Hazards, 61, 127–141, https://doi.org/10.1007/s11069-011-9781-0, 2012.
Conforti, M., Pascale, S., Robustelli, G., and Sdao, F.: Eval-uation of prediction capability of the artificial neural net-works for mapping landslide susceptibility in the Turbolo River catchment (northern Calabria, Italy), Catena, 113, 236–250, https://doi.org/10.1016/j.catena.2013.08.006, 2014.
Congalton, R. and Green, K.: Assessing the Accuracy of Remotely Sensed Data: Principles and Practices, 2nd Edition, CRC/Taylor & Francis, Boca Raton, 2009.
DGT: Avaliação da exatidão temática da Carta de Ocupação do Solo oficial de Portugal Continental (COS 2007 e 2010), Direção Geral do Território, Lisboa, 2013.
Drobnjak, S., Sekulovi´c, D., Amovi´c, M., Gigovi´c, L., and Regodi´c, M.: Central geospatial database analysis of the qual-ity of road infrastructure data, Geod. Vestn., 60, 269–284, https://doi.org/10.15292/geodetski-vestnik.2016.02.269-284, 2016.
Dymond, J. R., Ausseil, A. G., Shepherd, J. D., and Buet-tner, L.: Validation of a region-wide model of land-slide susceptibility in the Manawatu-Wanganui re-gion of New Zealand, Geomorphology, 74, 70–79, https://doi.org/10.1016/j.geomorph.2005.08.005, 2006.
EEA: CLC2006 technical guidelines, European Environment Agency, Copenhagen, 2007.
Etter, A., McAlpine, C., Wilson, K., Phinn, S., and Possing-ham, H.: Regional patterns of agricultural land use and defor-estation in Colombia, Agr. Ecosyst. Environ., 114, 369–386, https://doi.org/10.1016/j.agee.2005.11.013, 2006.
Fell, R., Corominas, J., Bonnard, C., Cascini, L., Leroi, E., and Savage, W. Z.: Guidelines for landslide susceptibility, hazard and risk zoning for land use planning, Eng. Geol., 102, 85–98, https://doi.org/10.1016/j.enggeo.2008.03.022, 2008.
Fiorucci, F., Cardinali, M., Carlà, R., Rossi, M., Mondini, A. C., Santurri, L., Ardizzone, F., and Guzzetti, F.: Seasonal land-slide mapping and estimation of landland-slide mobilization rates using aerial and satellite images, Geomorphology, 129, 59–70, https://doi.org/10.1016/j.geomorph.2011.01.013, 2011. Fressard, M., Thiery, Y., and Maquaire, O.: Which data for
quantitative landslide susceptibility mapping at operational scale? Case study of the Pays d’Auge plateau hillslopes (Nor-mandy, France), Nat. Hazards Earth Syst. Sci., 14, 569–588, https://doi.org/10.5194/nhess-14-569-2014, 2014.
Galli, M., Ardizzone, F., Cardinali, M., Guzzetti, F., and Reichen-bach, P.: Comparing landslide inventory maps, Geomorphology,
94, 268–289, https://doi.org/10.1016/j.geomorph.2006.09.023, 2008.
Glade, T.: Landslide occurrence as a response to land use change: A review of evidence from New Zealand, Catena, 51, 297–314, https://doi.org/10.1016/S0341-8162(02)00170-4, 2003. Guillard, C. and Zêzere, J.: Landslide susceptibility assessment and
validation in the framework of municipal planning in Portugal: The case of loures municipality, Environ. Manage., 50, 721–735, https://doi.org/10.1007/s00267-012-9921-7, 2012.
Günther, A., Reichenbach, P., Malet, J. P., van Den Eeckhaut, M., Hervás, J., Dashwood, C., and Guzzetti, F.: Tier-based ap-proaches for landslide susceptibility assessment in Europe, Land-slides, 10, 529–546, https://doi.org/10.1007/s10346-012-0349-1, 2013.
Guzzetti, F., Carrara, A., Cardinali, M., and Reichenbach, P.: Land-slide hazard evaluation: A review of current techniques and their application in a multi-scale study, Central Italy, Geomorphology, 31, 181–216, https://doi.org/10.1016/S0169-555X(99)00078-1, 1999.
Guzzetti, F., Reichenbach, P., Ardizzone, F., Cardinali, M., and Galli, M.: Estimating the quality of landslide susceptibility models, Geomorphology, 81, 166–184, https://doi.org/10.1016/j.geomorph.2006.04.007, 2006. Guzzetti, F., Mondini, A. C., Cardinali, M., Fiorucci, F.,
San-tangelo, M., and Chang, K. T.: Landslide inventory maps: New tools for an old problem, Earth-Sci. Rev., 112, 42–66, https://doi.org/10.1016/j.earscirev.2012.02.001, 2012.
Hilker, N., Badoux, A., and Hegg, C.: The Swiss flood and landslide damage database 1972–2007, Nat. Hazards Earth Syst. Sci., 9, 913–925, https://doi.org/10.5194/nhess-9-913-2009, 2009. IGP: Carta de Uso e Ocupação do Solo de Portugal Continental
para 2007 (COS2007), Memória descritiva, 1st ed., Instituto Ge-ográfico Português/Direção Geral do Território, Lisboa, Portugal, 2010.
Imprialou, M. and Quddus, M.: Crash data quality for road safety re-search: Current state and future directions, Accident Anal. Prev., in press, https://doi.org/10.1016/j.aap.2017.02.022, 2017. Jenelius, E. and Mattsson, L. G.: Road network
vulnerabil-ity analysis of area-covering disruptions: A grid-based ap-proach with case study, Transport. Res. A.-Pol., 46, 746–760, https://doi.org/10.1016/j.tra.2012.02.003, 2012.
Karsli, F., Atasoy, M., Yalcin, A., Reis, S., Demir, O., and Gokceoglu, C.: Effects of land-use changes on landslides in a landslide-prone area (Ardesen, Rize, NE Turkey), Environ. Monit. Assess., 156, 241–255, https://doi.org/10.1007/s10661-008-0481-5, 2009.
Kazemi, S. and Lim, S.: Deriving Multi-Scale GEODATA from TOPO-250K Road Network Data, J. Spat. Sci., 52, 165–176, https://doi.org/10.1080/14498596.2007.9635111, 2005. Leitner, H.: The Politics of Scale and Networks of Spatial
Con-nectivity: Transnational Interurban networks and the Rescaling of Political Governance in Europe, in: Scale and Geographic Inquiry: Nature Society and Method, edited by: Sheppard, E. and McMaster, B., 236–255, Blackwell Publishing, Malden, MA, 2004.
Meneses, B. M. and Zêzere, J. L.: Modelação da Suscetibilidade e Risco de Movimentos de Vertente no Concelho de Tarouca – De-terminação de Rotas de Emergência, in: XIII Coloquio Ibérico de Geografía. Respuestas de la Geografía Ibérica a la crisis actual, edited by: Royé, D., Vázquez, J. A. A., Otón, M. P., Mantiñán, M. J. P., and Díaz, M. V., 341–351, Santiago de Compostela, avaiable at: http://www.apgeo.pt/files/docs/Newsletter/XIIICIB_ actas_v2.pdf (last access: 8 June 2017), 2012.
Meneses, B. M., Reis, R., Vale, M. J., and Saraiva, R.: Land use and land cover changes in Zêzere watershed (Portugal) – Wa-ter quality implications, Sci. Total Environ., 527–528, 439–447, https://doi.org/10.1016/j.scitotenv.2015.04.092, 2015a.
Meneses, B. M., Pereira, S., and Zêzere, J. L.: Landslides and debris flows in Algarve region: inventory and assessment of susceptibil-ity at regional scale, in: VII Congresso Nacional de Geomorfolo-gia, edited by: Zêzere, J. L., Trindade, J., Bergonse, R., Garcia, R. A. C., de Oliveira, S. C., and Pereira, S., 179–185, Lisboa, 2015b (in Portuguese).
Meneses, B. M., Reis, E., Vale, M. J., and Reis, R.: Model-ing the Probability of Surface Artificialization in Zêzere Wa-tershed (Portugal) Using Environmental Data, Water, 8, 1–19, https://doi.org/10.3390/w8070289, 2016.
Meneses, B. M., Reis, E., Pereira, S., Vale, M., and Reis, R.: Un-derstanding Driving Forces and Implications Associated with the Land Use and Land Cover Changes in Portugal, Sustainability, 9, 351, https://doi.org/10.3390/su9030351, 2017.
Meneses, B. M., Reis, E., and Reis, R.: Assessment of the re-currence interval of wildfires in mainland Portugal and the identification of affected LUC patterns, J. Maps, 14, 282–292, https://doi.org/10.1080/17445647.2018.1454351, 2018a. Meneses, B. M., Reis, E., Vale, M. J., and Reis, R.:
Model-ing land use and land cover changes in Portugal: a multi-scale and multi-temporal approach, Finisterra, 53, 3–26, https://doi.org/10.18055/Finis12258, 2018b.
Meneses, B. M., Reis, E., Reis, R., and Vale, M. J.: The effects of land use and land cover geoinformation raster generalization in the analysis of LUCC in Portugal, ISPRS Int. Geo.-Inf., 7, 1–21, https://doi.org/10.3390/ijgi7100390, 2018c.
Mugagga, F., Kakembo, V., and Buyinza, M.: Land use changes on the slopes of Mount Elgon and the implica-tions for the occurrence of landslides, Catena, 90, 39–46, https://doi.org/10.1016/j.catena.2011.11.004, 2012.
Oliveira, S. C., Zêzere, J. L., and Garcia, R. A. C.: Structure and Characteristics of Landslide Input Data and Consequences on Landslide Susceptibility Assessment and Prediction Capability, in: Engineering Geology for Society and Territory, edited by: Lollino, G., Giordan, D., Crosta, G. B., Corominas, J., Azzam, R., Wasowski, J., and Sciarra, N., 189–192, Springer, Switzer-land, 2015a.
Oliveira, S. C., Zêzere, J. L., Catalão, J., and Nico, G.: The contribution of PSInSAR interferometry to landslide haz-ard in weak rock-dominated areas, Landslides, 12, 703–719, https://doi.org/10.1007/s10346-014-0522-9, 2015b.
Orongo, N. D.: GIS Based, Cartographic Generalization in Multi-scale Environment: Lamu County, GPO, University of Nairobi, Kenya, 2011.
Pereira, S., Zêzere, J. L., Quaresma, I. D., and Bateira, C.: Landslide incidence in the North of Portugal: Analy-sis of a historical landslide database based on press
re-leases and technical reports, Geomorphology, 214, 514–525, https://doi.org/10.1016/j.geomorph.2014.02.032, 2014. Pereira, S., Zêzere, J. L., and Quaresma, I.: Landslide Societal Risk
in Portugal in the Period 1865–2015, in: Advancing Culture of Living with Landslides, edited by: Mikoš, M., Vilímek, V., Yin, Y., and Sassa, K., 491–499, Springer International Publishing, Slovenia, 2017.
Persichillo, M. G., Bordoni, M., and Meisina, C.: The role of land use changes in the distribution of shal-low landslides, Sci. Total Environ., 574, 924–937, https://doi.org/10.1016/j.scitotenv.2016.09.125, 2017.
Piedade, A., Zezere, J. L., García, R., and Oliveira, S.: Mod-elos de suceptibilidade a deslizamentos superficiais transla-cionais na região a norte de Lisboa, Finisterra, 46, 9–26, https://doi.org/10.18055/Finis1322, 2011.
Pisano, L., Zumpano, V., Malek, Rosskopf, C. M., and Parise, M.: Variations in the susceptibility to landslides, as a conse-quence of land cover changes: A look to the past, and another towards the future, Sci. Total Environ., 601–602, 1147–1159, https://doi.org/10.1016/j.scitotenv.2017.05.231, 2017.
Pourghasemi, H. R., Moradi, H. R., Fatemi Aghda, S. M., Gokceoglu, C., and Pradhan, B.: GIS-based landslide suscep-tibility mapping with probabilistic likelihood ratio and spatial multi-criteria evaluation models (North of Tehran, Iran), Arab. J. Geosci., 7, 1857–1878, https://doi.org/10.1007/s12517-012-0825-x, 2014.
Promper, C., Puissant, A., Malet, J. P., and Glade, T.: Analy-sis of land cover changes in the past and the future as con-tribution to landslide risk scenarios, Appl. Geogr., 53, 11–19, https://doi.org/10.1016/j.apgeog.2014.05.020, 2014.
Regnauld, N.: Generalisation and data quality, Int. Arch. Photogramm. Remote Sens. Spat. Inf. Sci., 40, 91–94, https://doi.org/10.5194/isprsarchives-XL-3-W3-91-2015, 2015. Reichenbach, P., Busca, C., Mondini, A. C., and Rossi, M.: The
In-fluence of Land Use Change on Landslide Susceptibility Zona-tion: The Briga Catchment Test Site (Messina, Italy), Environ. Manage., 54, 1372–1384, https://doi.org/10.1007/s00267-014-0357-0, 2014.
Reichenbach, P., Rossi, M., Malamud, B. D., Mihir, M., and Guzzetti, F.: A review of statistically-based land-slide susceptibility models, Earth-Sci. Rev., 180, 60–91, https://doi.org/10.1016/j.earscirev.2018.03.001, 2018.
Reis, E., Zêzere, J. L., Vieira, G., and Rodrigues, M. L.: In-tegração de dados espaciais em SIG para avaliação da susceptibilidade à ocorrência de deslizamentos, Finis-terra, 48, 3–34, available at: http://www.ceg.ul.pt/finisterra/ numeros/2003-76/76_01.pdf\T1\textbackslash%5Cnhttp: //revistas.rcaap.pt/finisterra/article/view/1569/1266 (last access: 8 June 2017), 2003.
Soeters, R. S. and van Westen, C. J.: Slope instability recognition, analysis, and zonation, in: Landslides, investigation and mitiga-tion, Transportation Research Board, National Research Council, Special Report; 247, 129–177, Washington D.C., USA, National Academy Press, 1996.
Van Den Eeckhaut, M. and Hervás, J.: Landslide inventories in Eu-rope and policy recommendations for their inteEu-roperability and harmonisation, Publications Office of the European Union, Lux-embourg, 2012.
Van Den Eeckhaut, M., Marre, A., and Poesen, J.: Comparison of two landslide susceptibility assessments in the Champagne-Ardenne region (France), Geomorphology, 115, 141–155, https://doi.org/10.1016/j.geomorph.2009.09.042, 2010. Van Oort, P. and Bregt, A.: Do users ignore spatial data quality?
A decision-theoretic perspective, Risk Anal., 25, 1599–1610, https://doi.org/10.1111/j.1539-6924.2005.00678.x, 2005. van Westen, C. J., Castellanos, E., and Kuriakose, S. L.:
Spa-tial data for landslide susceptibility, hazard, and vulnera-bility assessment: An overview, Eng. Geol., 102, 112–131, https://doi.org/10.1016/j.enggeo.2008.03.010, 2008.
Winter, M. G., Harrison, M., Macgregor, F., and Shackman, L.: Landslide hazard and risk assessment on the Scot-tish road network, P. I. Civil Eng.-Geotec., 166, 522–539, https://doi.org/10.1680/geng.12.00063, 2013.
Winter, M. G., Shearer, B., Palmer, D., Peeling, D., Harmer, C., and Sharpe, J.: The Economic Impact of Landslides and Floods on the Road Network, Procedia Eng., 143, 1425–1434, https://doi.org/10.1016/j.proeng.2016.06.168, 2016.
Yan, T.: Recent advances of quantitative prognoses of landslides in China, in: Fifth International Symposium in Landslides, edited by: Bonnard, C., 1263–1268, Balkema, Rotterdam, 1988. Yin, K. and Yan, T.: Statistical Preditiction Model for Slope
In-stability of Metamorphosed Rocks, in: Fifth International Sym-posium in Landslides, edited by: Bonnard, C., 1269–1272, Balkema, Rotterdam, 1988.
Zêzere, J. L., Garcia, R. A. C., Oliveira, S. C., and Reis, E.: Prob-abilistic landslide risk analysis considering direct costs in the area north of Lisbon (Portugal), Geomorphology, 94, 467–495, https://doi.org/10.1016/j.geomorph.2006.10.040, 2008. Zêzere, J. L., Pereira, S., Melo, R., Oliveira, S. C., and