The Study of Exported Proteins from
Bacteria Causing Local Inflammation
Thesis submitted by
Lindsay Joanne Sharp
for the degree of
DOCTOR OF PHILOSOPHY
in the
Eastman Dental Institute
University College London
Division o f Infection and Immunity
Eastman Dental Institute
256, Grays Inn Road,
London, W C IX 8LD
All rights reserved
INFORMATION TO ALL USERS
The quality of this reproduction is dependent upon the quality of the copy submitted.
In the unlikely event that the author did not send a complete manuscript and there are missing pages, these will be noted. Also, if material had to be removed,
a note will indicate the deletion.
uest.
ProQuest U643175
Published by ProQuest LLC(2015). Copyright of the Dissertation is held by the Author.
All rights reserved.
This work is protected against unauthorized copying under Title 17, United States Code. Microform Edition © ProQuest LLC.
ProQuest LLC
789 East Eisenhower Parkway P.O. Box 1346
Procedures taken to identify exported virulence factors from bacteria causing inflammatory diseases have been described.
Porphyromonas gingivalis Lipid A-associated proteins (LAPs) were extracted and shown to induce IL-6 production by human cells. The cytokine-inducing LAP was isolated and shown to be homologous to a conserved domain present in the P. gingivalis adhesin/haemagglutinin family o f proteins including the gingipains, HagA and Tla. It was demonstrated that arg-gingipain is able to degrade IL -ip and eradicate its ability to induce IL-6. Thus it appears that domains within the same molecule have opposing effects on cytokine levels and may therefore contribute to the chronic inflammatory disease periodontitis.
To identify exported proteins from Staphylococcus aureus, antisera raised against surface-associated material from this bacterium were used to screen a S. aureus genomic DNA library. Proteins expressed by the clones recognised by the antibody were identified. These proteins include protein A, SdrE and a novel serine rich glycoprotein (Sta). Although the exact function o f Sta was not elucidated, it is a member o f tiie M SCRAMM family o f proteins.
A b s tra c t... 1
T ab le o f C o n te n ts... 2
L ist o f T a b le s... 10
L ist o f F ig u res... 12
A b b re v ia tio n s... 19
A cknow ledgem ents... 21
D e cla ra tio n ... 22
CHAPTER 1 Introduction... 26
1.1 C y to k in es... 27
1.1.1 Classification and biological actions o f cytokines... 27
1.1.2 Bacteria interfering with cytokine networks... 30
1.1.3 Bacterial cytokine modulating molecules... 32
1.1.3.1 Lipopolysaccharide... 32
1.1.3.1.1 Structure o f LPS... 32
1.1.3.1.2 Host recognition o f LPS and cytokine production... 33
1.1.3.1.3 Structure and function o f LPS 35 1.1.3.2 Lipid A-associated proteins... 37
1.1.3.3 Surface associated material... 37
1.2 Porphyrom onas gingivalis... 39
1.2.1 P. gingivalis exported virulence factors... 39
1.2.1.1 P. gingivalis proteases... 39
1.2.1.2 P. gingivalis lipopolysaccharide... 42
1.3 Staphylococcus a ureu s... 44
1.3.1 S. aureus exported virulence factors... 45
1.3.1.1 S. adhesins-M SCRAM M S... 45
1.3.1.2 & aureus exotoxins... 46
1.3.1.3 5'. aureus proteases... 47
1.3.1.4 Immunoglobulin G binding proteins... 48
1.3.2 S. aureus antigens and their use for vaccination and diagnosis of disease. 48 1.4 D evelopm ent o f a functional genomic assay fo r the identification of cytokine m od u lating p ro te in s... 50
1.6 Aims o f th esis... 51
2.3 D eterm in atio n o f the p ro tein content of sam ples... 54
2.3.1 Bio-Rad DC protein assay... 54
2.3.2 Bradford protein assay... 55
2.4 T h e L im u lu s am oebocyte lysate assay... 55
2.5 Sodium dodecyl su lp h ate - polyacrylam ide gel electrophoresis... 56
2.6 T w o-dim ensional gel electrophoresis... 57
2.6.1 F irst dimension... 57
2.6.1.1 Casting o f lEF tube gels... 57
2.6.1.2 Sample preparation for lE F ... 58
2.6.1.3 First dimension-IEF... 58
2.6.2 Second dimension electrophoresis... 58
2.7 S tain in g SDS-PAGE gels... 59
2.7.1 Colloidal blue staining... 59
2.7.2 Silver staining... 59
2.8 W estern b lo ttin g ... 59
2.9 Sem i-dry blotting of proteins fo r sequencing... 60
2.10 E x tractio n o f p ro tein from b a c te ria ... 61
2.10.1 Extraction o f lipid A-associated proteins from P. gingivalis... 61
2.10.2 Extraction o f surface-associated material from S. aureus... 62
2.10.3 Preparation o f whole cell lysates from 5'. 62 2.10.4 Extraction o f periplasmic proteins from E. co/i... 63
2.11 R aising antibodies against & aureus SA M ... 63
2.12 A m m onium su lphate p recip itatio n of p ro te in s... 64
2.12.1 Precipitation o f I gG ... 64
2.12.2 Precipitation o f proteins from bacterial supernatants... 64
2.13 P u rificatio n o f IgG by anion exchange c h ro m a to g ra p h y ... 65
2.14 P u rificatio n o f pro tein s by gel filtra tio n ... 65
2.15 R em oval o f LPS from p ro tein sam ples... 66
2.18 A ffinity p u rificatio n of polym yxin B bin din g proteins from periplasm ic
e x tra c ts... 67
2.19 D etection o f G lycoproteins using the D IG G lycan detection k it... 68
2.20 H eat tre a tm e n t o f p ro te in s... 68
2.21 T ry p sin tre a tm e n t o f p ro te in s... 69
2.22 T re a tm e n t o f I L - lp w ith RgpA from P. gingivalis... 69
2.23 Tissue cu ltu re a n d stim ulation o f h u m an cells w ith bacterial p ro d u c ts 70 2.23.1 Preparation and culture o f human gingival fibroblasts... 70
2.23.2 Whole blood... 71
2.23.3 Human peripheral blood mononuclear cells... 71
2.24 H u m an cytokine assays... 72
2.24.1 ELISA for IL-6... 72
2.24.2 ELIS A for T N F -a... 73
2.25 Q u a n tita tio n o f nucleic acid s... 73
2.26 A garose gel electro p h o resis... 74
2.27 N ucleic acid p u rifica tio n ... 75
2.27.1 Phenol-chloroform extraction... 75
2.27.2 Precipitation o f nucleic acids... 75
2.28 Isolation of genomic DNA from Staphylococcus aureus... 75
2.29 Plasm id DNA iso latio n... 76
2.30 Isolation o f lam b d a D N A ... 76
2.31 Isolation o f DNA fragm ents from agarose gels... 78
2.31.1 Extraction o f DNA using the Qiagen gel extraction k it... 78
2.31.2 Large-scale DNA extraction from agarose gels using electro-elution 78 2.32 R estrictio n enzym e digestion... 78
2.36 Polym erase chain re a ctio n ... 81
2.36.1 General PCR m ethod... 82
2.36.2 PCR using the Boehringer Expand ™ systems... 82
2.36.2.1 Expand ™ High Fidelity PCR system... 82
2.36.2.2 Expand ™ Long Template PCR system... 83
2.36.3 Release o f DNA from bacteria using Lyse-N-Go PCR Reagent 84 2.37 R T -P C R ... 84
2.37.1 RNA extraction from 5*. 85 2.37.2 DNase treatment o f R N A ... 85
2.37.3 cDNA synthesis... 85
2.37.4 PCR amplification o f cDNA... 86
2.38 N ucleic acid sequencing... 86
2.39 Sequencing the sta gene using the E Z :;T N In sertion K it... 87
2.39.1 The transposon insertion reaction... 87
2.39.2 Selection o f transformants and sequencing... 88
2.40 S. aureus G enom ic DNA lib ra ry construction in L am b d a Dash®II... 88
2.40.1 Ligation o f S. aureus DNA fragments to Lambda Dash®II... 88
2.40.2 Packaging o f lambda library into phage particles... 88
2.40.3 Determination o f the lambda DNA library titer... 89
2.41 Im m uno-screening o f th e iS. flwreMS lam b d a DNA lib r a ry ... 89
2.42 P re p a ra tio n o f p ro tein from lam b d a clones... 90
2.43 C loning o f P C R p ro d ucts using TOPO® Cloning® K its... 91
2.43.1 Cloning using pCR® 4-TOPO® vector... 91
2.43.2 Cloning using pCR®-XL-TOPO® vector... 91
2.44 C loning a n d expression o f genes using the Q lK express system ... 92
2.44.1 The QIAcxprc55 system... 92
2.44.2 Cloning into the pQE30 vector... 93
2.44.3 Growth o f expression cultures... 93
2.44.4 Purification o f soluble proteins under native conditions... 94
2.44.4.1 Small scale preparation o f recombinant proteins... 94
2.44.4.2 Large scale preparation o f recombinant proteins... 94
expression system ...
2.45.1 Transformation o f jB. protoplasts... 97
2.45.2 Protein expression in jB. 97 CHAPTER 3 The Characterisation and Identification of a Cytokine Inducing Lipid A-Associated Protein of Porphyromonas gingivalis...99
3.1 In tro d u c tio n ... 99
3.2 R esu lts... 100
3.2.1 Analysis o f P. gingivalis LAPs... 100
3.2.1.1 Determination o f the protein content o f LAPs... 100
3.2.1.2 Determination o f the endotoxin content o f the LAP preparation... 101
3.2.1.3 SDS-PAGE analysis o f the LAPs... 102
3.2.2 The IL-6 inducing activity o f LAPs... 102
3.2.3 Confirming the origin o f the IL-6-inducing activity o f the LAPs... 105
3.2.3.1 The effect o f heat and trypsin treatment on the cytokine inducing activity o f the LAPs... 105
3.2.3.2 Influence o f polymyxin B or anti-CD 14 monoclonal antibodies on LAPs induced IL-6 production by PBM Cs... 107
3.2.3.3 Comparing the IL-6 inducing activities o f P. gingivalis LPS and LAP with respect to their activities in the LAL assay... 108
3.2.4 Identification o f the IL-6 inducing component o f the LAPs... 109
3.2.5 N-terminal sequencing o f the IL-6 inducing LAP fraction... I l l 3.2.6 Effects o f RgpA on the IL-6 inducing activity o f IL -lp ... 112
3.4 D iscussion... 114
CHAPTER 4 Immuno-Screening of a Staphylococcus aureus Genomic DNA Library for the Identification of Genes that Code for Exported Proteins... 118
4.J Introduction... 118
4.2 Results... 119
4.2.1 Purification o f IgG from rabbit anti-serum raised against S. aureus SAM .... 119
4.2.1.1 Estimating the optimum dilution o f the rabbit IgG for use in im m uno-blotting... 122
4.2.1.2 Determining the optimum concentration o f E. coli lysate for the pre-absorption o f the rabbit IgG ... 124
4.2.2 Analysis o f the proteins recognised by the anti-SAM antibody... 126
rabbit IgG... 128
4.2.2 Construction o f a S. aureus genomic DNA library in the Lambda Dash®II vector... 129
4.2.3.1 Preparation o f & aureus DNA for library construction... 129
4.2.3.2 Preparation o f the S. aureus genomic library... 130
4.2.4 Screening the S. aureus genomic DNA library using rabbit IgG raised against SA M ... 131
4.2.5 Analysis o f positive clones... 132
4.3 Discussion... 134
CHAPTER 5 The Characterisation of Lambda Dash®ii Ciones Recognised by Antibodies to S. aureus SAM...136
5.1 Introduction... 136
5.2 Results... 137
5.2.1 Screening for S. aureus IgG binding proteins expressed by the lambda clones... 137
5.2.2 Identification o f the IgG protein produced by L45... 138
5.2.2.1 Preparation and restriction enzyme digestion o f L45 DNA... 138
5.2.2.2 Sequencing o f the S. aureus DNA insert present in L45... 139
5.2.3 The antigenic properties o f LI 20 and L220... 139
5.2.4 Preparation and restriction enzyme digestion o f LI 20 DN A ... 141
5.2.5 Sequencing the S. aureus genomic DNA insert present in L I2 0 ... 141
5.2.6 Analysis o f the predicted DNA sequence o f the insert contained in LI 20. 142 5.2.6.1 Identification o f open reading frames... 142
5.2.6.2 Homology searches with the open reading frames... 142
5.2.7 Cloning the gene... 145
5.2.7.1 PCR amplification o f the sdrE gene... 145
5.2.7.2 Cloning the gene into the pCR ®4-TOPO ®vector... 147
5.2.7.3 Cloning the gene into the pQE30 expression vector... 148
5.2.8 Expression o f ... 149
5.3 Discussion... 151
CHAPTER 6 Cloning and Expression of a High Molecular Mass Serine/Threonine Rich Protein from Staphylococcus aureus... 155
6.1 Introduction... 155
6.2 Results... 156
6.2.1 The product of clone L220 is a protein... 156
6.2.2 Analysis of the L220 insert DNA... 157
6.2.2.3 Amplification of the DNA insert contained in L220... 159
6.2.2.4 Restriction enzyme digestion of the PCR product amplified from L220... 160
6.2.2.5 Sequencing the ends of the PCR amplified L220 DNA insert... 161
6.2.3 Bioinformatic analysis of the L220 insert DNA sequence... 162
6.2.3.1 Searching the unfinished S. aureus genome sequence database... 162
6.2.3.2 Searching the insert for open reading frames... 162
6.2.3.3 Homology searches with the open reading frames... 162
6.2.4 Confirming the presence of sta inL220 165 6.2.5 Testing for expression of the sta gene by S. aureus... 166
6.2.6 Sequencing of sta from S. aureus FRI326... 168
6.2.7 Comparison of Sta from FRI326 with Sta from other strains of S. aureus 169 6.2.8 Bioinformatic analysis of Sta... 171
6.2.8.1 Amino acid pattern analysis of Sta... 171
6.2.8.2 Searching for signal peptide cleavage sites in Sta... 171
6.2.9 Cloning and expression of sta in the Bacillus megaterium protein expression system... 171
6.2.9.1 Cloning of the sta gene into the pWH1520 expression vector... 171
6.2.9.2 Expression of the sta gene in B. megaterium... 175
6.2.10 Cloning and expression of sta fragments in the Q\2iexpressionist 177 system... 6.2.10.1 Cloning of fragments of the sta gene into pQE30... 177
6.2.10.2 Expression of sta fragments in E. coli... 179
6.2.11 Western blot analysis of the Sta fragments with the rabbit antibody... 180
6.2.12 Western blot analysis of Sta using specific antibody... 181
6.2.13 Detection of glycoconjugates on Sta... 182
6.3 Discussion... 184
CHAPTER 7 Identification of Cytokine-Inducing Periplasmic Proteins from an Escherichia coli Strain With a Mutation in a Gene Responsible for LPS Production... 190
7.1 In tro d u c tio n ... 190
7.2 R esu lts... 191
7.2.1 Analysis o f periplasmic proteins... 191
7.2.2 IL-6 and T N F-a stimulating activity o f periplasmic proteins... 192
7.2.3 Effect o f anti-CD 14 antibody on periplasmic protein-induced TN F-a production... 194
7.2.4 Purification o f polymyxin B-binding periplasmic proteins... 195
7.2.5 T N F-a stimulating activities o f periplasmic protein before and after their passage down a detoxigel colum n... 196
7.2.6 The T N F-a inducing activity o f polymyxin B-binding proteins... 197
7.2.8.2 The cytokine inducing activity o f FkpA... 199
7.2.9 Cloning o f the flagellin gene... 201
7.2.10 Expression o f recombinant flagellin... 201
7.2.10.1 Small scale expression of recombinant flagellin... 201
7.2.10.2 Large scale preparation o f flagellin... 202
7.2.10.3 Purification o f flagellin using gel filtration chromatography... 203
7.2.10.4 MALDI-TOF MS analysis o f the multiple bands present in the flagellin preparation... 204
7.2.10.5 Determining the total yield o f flagellin... 205
7.2.11 The cytokine inducing activity o f flagellin... 205
7.2.12 The effect o f heat on the cytokine inducing activity o f flagellin... 207
7.2.13 Determining the LPS content o f the flagellin preparation... 208
7.2.14 The co-stimulatory effects o f flagellin and FkpA ... 208
7.4 D iscussion... 210
Chapter Eight General Discussion...214
8.1 S um m ary o f th e findings o f this th esis... 214
8.1.1 P. gingivalis Lipid A associated proteins... 214
8.1.2 S', aureus exported proteins... 218
8.1.3 Development o f a functional genomic screening methodology for bacterial genes encoding cytokine-modulating proteins... 223
8.2 T h e ap p ro ach es tak en in this thesis to identify b acterial exported proteins. . 225
8.3 F u tu re w o rk ... 230
Appendix...232
Appendix 1 L ist o f p rim e rs ... 232
A 1.1 Primers used for gene cloning... 232
A1.2 Primers used for sequencing DNA in vectors... 233
A1.3 Primers used for RT-PCR to look for sta expression... 233
Appendix 2 V ector M a p s... 234
A2.I pC R *4-T 0P0® ... 234
A2.2 pCR*-XL-TOPO*... 235
A2.3 pQ E30... 236
A2.4 pREP4... 237
A2.5 p U C lS ... 238
A2.6 pW H 1520... 239
A2.7 Lambda Dash*II... 240
Appendix 5 Sequences o f the serine rich pro tein sequences from streptococci 255
A 5.1 S. parasanguis F a p l... 255
A5.2 S. cristatus SrpA... 256
A5.3 S. gordonii H sa... 257
A5.4 S.gordonii G spB... 258
A5.5 S. pneumoniae cell wall surface anchor family protein... 259
Appendix 6 C linical details o f the S. aureus infected patients, w hose sera w ere used in this s tu d y ... 261
Table 1.1 Biological activities o f a number o f cytokines involved in controlling 29
inflammation.
Table 1.2 Examples o f bacterial proteins able to suppress cytokine synthesis 31
Table 1.3 A list o f P. gingivalis exported proteases 41
Table 2.1 E. coli strains used in the work described in this thesis. 54
Table 2.2 Restrictions enzymes used in the studies described in this thesis and 79
their reaction buffer compositions.
Table 2.3 The temperature program for the release o f DNA from whole bacteria 84
using Lyse-N-Go ^ PCR Reagent.
Table 2.4 Conditions required for the production o f recombinant flagellin and 96
recombinant Sta fragments in pQE 30.
Table 2.5 Contents o f the buffers required for transformation and propagation o f 98
recombinant B. megaterium clones.
Table 4.1 The individual S. aureus proteins that were Western blotted in order to 129
determine whether they were recognised by rabbit IgG raised against SAM.
Table 5.1 List o f the genes found on the S. aureus genomic DNA insert in clone 143
L I20. The genes have been numbered in sequence. Their positions on the sequence have also been noted along with their length (kb) and the predicted molecular mass (MM; kDa) o f the proteins for which they code. Where possible, putative identities have been assigned to each of the predicted proteins after blastp searches were carried out on the NCBI website.
Table 6.1 Sequence data from the L220 insert DNA using the T3 primer. The 162
sequence in bold is from the Dash II vector.
Table 6.2 The genes (ORFs) found on the insert sequence o f L220. The genes have 163
been numbered in the order in which they appear on the insert. Their positions on the sequence have also been noted along with their length (kb) and the predicted molecular mass (MM) (kDa) o f the protein for which they code. Where possible, putative identities have been assigned to each o f the predicted proteins after blastp searches were carried out on the NCBI website.
Table 6.3 The amino acid sequence o f Sta from S. aureus FRI326. This sequence 169
proteins found in streptococci (section 6.2.4.4). The underlined sequence is an inserted sequence also present in in MRS A (section 6.2.6).
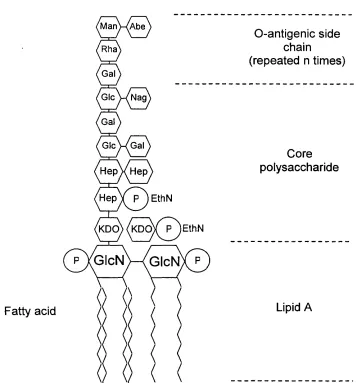
F ig u re 1.1 Schematic representation o f the lipopolysaccharide molecule from 33 Salmonella spp., showing the lipid-A region, the core polysaccharide and the O-antigenic side chain. P = phosphate, GlcN = glucosamine, KDO = 2-keto-3-deoxyoctulonic acid, EthN = ethanolamine. Hep = heptulose, Glc = glucose. Gal = galactose, NAG = N-acetylglucosamine, Rha = Rhamnose, Man = mannose and Abe = abequose.
F ig u re 1.2 Structure o f lipid A from E. coli K-12. The structure enclosed in a 36 lined box is the myristate group, not present in the mutated E. coli msbB strain or P. gingivalis, H pylori and B. fragilis. The phosphate, marked with an asterisk, is that which is not present in P. gingivalis H pylori and B. fragilis lipid A.
F ig u re 1.3 Transmission electron micrograph o f S. aureus cells before (a) and after (b) gentle washing with saline to remove surface-associated material. Cells were fixed with ruthenium red in order to stabilise the cell surface.
38
F ig u re 1.4 Fig u re 3.1
Structural organization o f the gingipains and their related proteins. 42 SDS-PAGE analysis o f the P. gingivalis LAPs preparation. The photograph shows a 12% gel stained with colloidal blue. Lane 1 shows the molecular mass markers and lane 2 shows P. gingivalis LAPs o f molecular masses as follows: 1=81 kDa; 2=68kDa; 3=48kDa; 4=43kDa; 5=28kDa; 6=25kDa; 7=20kDa, 8=17kDa; 9=16kDa.
102
Figure 3.2 IL-6 release by a) human gingival fibroblasts, b) whole blood and c) 104
PBMCs, stimulated with various concentrations o f P. gingivalis LAPs. This is a typical result, o f experiments repeated 4 times, expressed as the means +/- standard deviation (n=3).
Figure 3.3 The effects o f heat and trypsin on LAP induced IL-6 production by 107
PBMCs d ) after treatment o f the LAPs with trypsin ( □ ) or heat ( □ ). These are representative results o f 4 experiments, expressed as means +/- standard deviation (n=3). ** =P value < 0.005; * = P < 0.05 (Student’s t-Test)
Figure 3.4 IL-6 production by human PBMCs exposed to E. coli (E-LPS) ( □ ), 107
F ig u re 3.5 IL-6 production by human PBMCs stimulated with LAPs fractions. LAPs were separated by SDS-PAGE and were extracted from the polyacrylamide gel as described in section 2.17. PBMCs were treated with lOpl ( H ) or lOOpl ( D ) o f each fraction to identify the cytokine-stimulating component. A limited amount o f stimulation was caused by fractions 7 and 9 but most o f the activity was in fraction 8, which corresponds to the 17kDa protein. Results are expressed as means o f triplicate wells +/-SD. *P<0.05, **P<0.005 (Student’s t-Test).
I l l
F ig u re 3.6 Induction o f IL-6 by RgpA-treated IL -ip. The figure shows IL-6 production from PBMCs treated with: (U), untreated IL -ip; (HI), IL -ip treated with heat inactivated RgpA for 0-2 hours (0, 0.25, 0.5,
1 & 2), as described in section 2.22.
113
F ig u re 4.1 Analysis o f serum fractions separated by anion exchange 121 chromatography on 12% SDS-PAGE stained with colloidal blue. The lanes have been numbered according to the order in which the fractions eluted. The end lanes contain the molecular mass markers. F ig u re 4.2 This series o f Western blots was carried out to determine the best 123
dilution o f rabbit IgG to use for screening the 6". aureus genomic DNA library. The dilutions carried out are printed below the corresponding gel. The samples tested were (a) S. aureus lysate; (b) S. aureus SAM; (c) E. coli lysate and (d) E. coli lambda lysate.
F ig u re 4.3 This series o f Western blots was carried out to determine the best 125 concentration o f E. coli lambda lysate to use for pre-absorption o f the rabbit IgG. The samples tested were (a) S. aureus lysate; (b) S. aureus SAM; (c) E. coli lysate and (d) E. coli lambda lysate. The rabbit IgG was pre-absorbed with 7pg, 70pg, 350pg and 700pg o f E. coli lambda lysate for every mg o f IgG. After pre-absorption IgG was diluted 1:250 and used for Western blotting.
F ig u re 4.4 Two-dimensional PAGE analysis o f 240pg SAM from S. aureus. 127 (A) is a gel stained with colloidal coomassie blue. (B) shows a Western blot o f a similar gel probed with the rabbit anti-SAM antibody. For orientation some o f the bright spots on the Western blot have been numbered 1 to 4 as well as their equivalent blue stain spots.
the rabbit IgG and visualized using DAB.
F ig u re 4.7 Western blot o f the positive clones separated by SDS-PAGE on a 133 12% gel and blotted using the rabbit anti-SAM antibody. The samples in each lane are as follows: (1) iS. aureus lysate; (2) S. aureus SAM; (3) negative control E. coli lambda lysate.; (4) clone L45; (5) clone L220; (6) clone L I20.
F ig u re 5.1 Western blot analysis o f the proteins produced by L220 (lane 2), 137 L I 20 (lane 3), and L45 (lane 4). Blotting was performed with horseradish peroxidase-conjugated goat anti-rabbit IgG, to look for non-specific binding o f antibody to the lambda clone products. The proteins were first separated on a 12% SDS-PAGE gel. Lane 1 contains the molecular mass markers.
F ig u re 5.2 Agarose gel analysis o f DNA from L45 digested with EcoRl (lane 138 2). Lane 1 contains the molecular mass markers made using wild-type lambda DNA digested with HinàWl. The Lambda Dash®Il vector arms have been labelled (k arms). The DNA was resolved by electrophoresis on a 0.8% agarose gel.
F ig u re 5.3 Western blot analysis o f proteins from LI 20 and L220 with human 140 serum. (A) shows the blots carried out with 22 control sera and (B) shows the blots carried out with 23 patients sera. The arrows in (A) mark the position o f the bands o f interest.
F ig u re 5.4 Agarose gel analysis o f lambda DNA isolated from L I 20 and 141 digested with FcoRI (Lane 2). The lambda arms from the vector have been labelled (A, arms). Lane 1 shows the molecular weight markers (wild-type lambda DNA digested with f jd ).
F ig u re 5.5 Map o f the genomic DNA insert o f the L I20 clone. The arrows 144 show the direction o f the open reading frame. The dotted lines show the alignment o f the sequences from the four EcoRl fragments that were subcloned into pUClS.
F ig u re 5.6 Agarose gel analysis o f PCR product generated from S. aureus 146 genomic DNA using primers designed to unique regions outside each end o f the sdrE gene (Lane 2). Lane 1 contains the molecular mass markers generated by digestion o f wild-type.
F ig u re 5.7 Agarose gel analysis o f the PCR product generated in step 2 o f the 147 nested PCR using the PCR product from step 1 as a template (Lane
1). Lane I contains the molecular mass markers generated by digestion o f wild-type lambda DNA with Pstl.
HindWl.
F ig u re 5.9 SDS-PAGE analysis o f the Ni-NTA purified soluble proteins produced by an expression culture for SdrE after induction for 2 hours (lane 2), 4 hours (lane 3) and 6 hours (lane 4). Lane 1 contains the proteins purified from an un-induced culture. No recombinant proteins were visualised. Molecular mass markers are seen in the first lane.
150
F ig u re 6.1 W estern blot analysis o f the protein product o f L220. The proteins were first separated by SDS-PAGE on a 10% gel and then Western blotting was performed using the rabbit anti-SAM IgG. Lane 1 contains untreated molecules from L220 and Lane 2 contains the same concentration o f protein which had been exposed to proteinase K.
156
F ig u re 6.2 Analysis o f lambda DNA extracted from L220 on a 0.8% agarose 157 gel. The lambda DNA corresponds to the band migrating at 27kb and the low molecular mass band (< O.Skb) is contaminating RNA. The background smear is contaminating sheared E. coli DNA.
F ig u re 6.3 Agarose gel analysis o f L220 DNA, digested with HindlW (H), Xbal 158 (X) and a double digest with Hin&lW and Xbal (H/X). Lanes 1 and 2 contain molecular mass markers made using wild type lambda DNA digested with Pstl (lane 1) and HindlW (lane 2). The DNA was resolved by electrophoresis in a 0.8% agarose gel.
F ig u re 6.4 This photograph shows 5p,l o f the PCR product amplified from 159 L220 (lane 2) resolved by electrophoresis on a 0.8% agarose gel. The molecular mass markers (lane 1) were made by digesting wild type lambda DNA with Pstl.
F ig u re 6.5 Agarose gel analysis o f restriction enzyme digestions carried out on 160 the PCR product amplified from L220. The photograph shows digestion with Xbal (X), H indlll (H), X bayH indlll (H/X), Kpnl (K), XbaVKpnl (K/X), Pstl (P) and Xbal!Pstl (P/X). Lane 1 contains the
kb markers made by digesting wild type lambda DNA with Pstl.
F ig u re 6.6 This diagram shows a map o f the genomic DNA insert o f L220. The 164 sequence obtained using the T3 primer begins at 21 kb and reads to
1 kb. Each o f the predicted open reading frames are marked. These were used to search protein databases for similar proteins in order to assign a putative function to the proteins coded for by each open reading frame.
and F2) or HindUl (F3).
F ig u re 6.8 The growth curve o f S. aureus in BHI broth over 7 hours (1) 167 (00650= absorbance o f the culture at a wavelength o f 650nm) and RT-PCR o f S. aureus mRNA samples taken at time points 0 to 7 hours (2, T° to T^) using primers designed to amplify a 304bp fragment between base pairs 1139 and 1444 o f the sta gene. The agarose gel, shows: (A) PCR o f the cDNA samples, where is the positive control and (B) PCR carried out on the DNase treated RNA samples.
F ig u re 6.9 Amino acid sequence comparison o f Sta from six strains o f S. 170 aureus. In the schematic diagram the first scheme represents the sequences from strains Mu50, N315, 8325 and COL as these strains are the most similar to each other. The area marked HC region represents the high complexity region o f Sta and the area marked SX region represents the low complexity SX repeat region. A 14 amino acid insertion in both FRI326 and MRS A strains is represented by a black rectangle. A large deletion in the SX region o f MRS A is represented as a blank area.
F ig u re 6.10 Agarose gel analysis o f the sta gene amplified by PCR from S. 172 aureus FRI 326. A tenth o f the PCR product (lane 2) was run on a 0.8% agarose gel alongside Ikb DNA ladder markers (Promega) (lanel).
F ig u re 6.11 Agarose gel analysis o f the pCR®-XL-TOPO®-5/a clone digested 173 with Kpnl and Xbal. The digestion (lane 2) resulted in 2 bands, one for pCR®-XL-TOPO® (3.5kb) and another for sta (6.85kb). Ikb DNA ladder markers were run alongside the digested DNA (lane 1).
F ig u re 6.12 Agarose gel analysis o f the pW H1520-jra clone following digestion 174 with Kpnl. The linearised plasmid (lane 2) runs higher than the 1 Okb marker (lane 1). There are 2 higher molecular weight bands that are probably due to concatenated DNA.
F ig u re 6.13 Agarose gel analysis o f PCR products from five sta clones in B. 175 megaterium, using primers specific to the pWH1520 vector. Clones
1 and 2 (lanes 2 and 3) gave no product in the PCR. PCR o f clones 3 to 5 (lanes 4 to 6) resulted in the amplification o f an approximate 7kb insert.
F ig u re 6.14 SDS-PAGE analysis o f B. megaterium expression cultures over 0 to 6 hours (as labeled) after induction with xylose. Wild type cultures were compared with B. megaterium containing the construct pWH1520-5'/fl. Photograph A shows the proteins extracted from the bacterial pellet. Photograph B shows the proteins present in the supernatant. The molecular mass markers are seen in the first lane.
fragments o f the sta gene. FI (a) contains the first 2680bp o f the sta gene, F2 (b) contains base pairs 2680 to 4530 and F3 (c) contains base pairs 4530 to 6786 o f the gene. DNA markers (1) prepared using wild-type lambda DNA digested with Pst\ (a and b) or HindiW (c) were also run.
F ig u re 6.16 SDS-PAGE analysis o f soluble (A) and insoluble (B) proteins 180 fractions from expression cultures for Sta FI (1), Sta F2 (2) and Sta F3 (3). No recombinant protein was present in the soluble fractions (A). Recombinant protein was however present in the insoluble fractions (B). Sta FI expressed a protein o f approximately 83kDa, Sta F2 expressed a protein o f approximately MOkDa and the Sta F3 expressed a protein greater than 200kDa.
F ig u re 6.17 Western blotting o f the proteins produced by L220 and the 181 fragments Sta F I, Sta F2, and Sta F3 expressed in the insoluble fraction o f the pQE30 clones. The proteins were analysed on a 10% SDS-PAGE gel before blotting and detection with the rabbit antibody.
F ig u re 6.18 Western blotting o f 1) Sta F I, 2) Sta F2, 3) Sta F3, 4) negative 182 control lambda lysate 5) L220 proteins with antibody raised against Sta. Proteins were separated on 10% SDS-PAGE gels prior to blotting.
F ig u re 6.19 Staining o f glycoproteins using the DIG Glycan Detection Kit 183 (Roche). Lane 1 contains protein products from L I20, lane 2 contains products from L220 (expressing Sta), lane 3 contains products from negative control lambda clone and lane 4 contains the positive control glycoprotein transferrin.
F ig u re 7.1 Analysis o f 20pg E. coli periplasmic proteins on 12% SDS-PAGE stained with colloidal blue.
191
F ig u re 7.2 IL-6 and T N F-a release by human PBMCs stimulated with E. coli periplasmic protein with ( • ) and without ( ♦ ) polymyxin B. These are representative results from three experiments, expressed as the means o f triplicate wells ± standard deviation.
193
F ig u re 7.3 Periplasmic protein induction o f IL-6 and TN F-a release from PBMCs with (M ) and without ( ♦ ) preincubation with lOpg ml'^ o f anti-CD 14 antibody (60bca). Results are expressed as means ± standard deviation.
195
F ig u re 7.4 Analysis o f periplasmic proteins recovered from a polymyxin B column after elution with 10% deoxycholate. 12% SDS-PAGE gels
Figure 7.5 T N F -a production by PBMCs after stimulation with Ipg m l'' 197
periplasmic proteins before and after passage through a polymyxin B column. Results are expressed as means ± SD. ** f <0.001 (Student’s t-Test).
Figure 7.6 T N F -a and IL-6 production by PBMCs stimulated with periplasmic 198
proteins purified on a polymyxin B column. The graph shows results o f stimulation with (ÜÜ] ) and without ( □ ) 2 0 p g m f' o f polymyxin B. Results are expressed as means ± SD. *p<0.05, **p<0.005, when the amount o f cytokine induced by periplasmic proteins in thepresence o f polymyxin B is compared to that without, using the Student’s t-Test.
Figure 7.7 IL-6 and T N F -a production by PBMCs stimulated with FkpA with 200
( ♦ ) and w ithout ( * ) the anti-CD 14 antibody 60bca. These are representative results from three experiments expressed as the mean o f triplicate values ± standard deviation.
Figure 7.8 SDS-PAGE analysis o f the Ni-NTA-agarose purified rflagellin. The 202
photograph shows a 12 % gel stained with colloidal blue. The band o f expected size for rflagellin has been labelled.
Figure 7.9 SDS-PAGE analysis o f 20pl Ni-NTA-agarose purified flagellin 203
from a 100ml expression culture. The photograph shows a 12% gel stained with colloidal blue. The band o f expected size for rflagellin has been labelled.
Figure 7.10 SDS-PAGE analysis o f rflagellin fractions (1 to 7) eluted from a gel filtration column. lOpl o f each 50pl fraction were run on a gel. The flagellin was present in fractions 3, 4, 5 and 6. The lanes have been labelled according to the fraction numbers. The photograph shows a 12% gel stained with colloidal blue. The band o f expected size for rflagellin has been labelled.
204
Figure 7.11 IL-6 and T N F -a production by human PBMCS stimulated with 206
rflagellin ( ♦ ) in the presence o f anti CD 14 (•). The results are expressed as mean ± standard deviation.
Figure 7.12 This figure shows the capacity o f rflagellin ( M ) and heat treated 207
rflagellin ( ♦ ) to stimulate IL-6 produetion by PBMCs. These are results representative o f three experiments expressed as the mean o f triplicate values ± standard deviation.
Figure 7.13 IL-6 production by PBMCs stimulated with FkpA (5pg m l'" and 209
rflagellin (Ip g m l''), both individually and simultaneously ( □ ) • The experim ent was also earried out in the presence o f anti-CD 14
representative results o f three experiments expressed as the means o f triplicate results ± standard deviation.
Figure 8.1 Schematic representation o f the opposing action o f RgpA on lL-6 218
synthesis. RgpA autolysis and degradation o f HagA produces the fragment found in this study to induce IL-6 (Chapter 3). RgpA also degrades IL-1(3 and leaves it unable to induce lL-6 synthesis by human cells.
Figure 8.2 Schematic representation o f the relationships between the Sdr 222
proteins and Sta o f S. aureus. The diagram shows the postion and /or size o f their signal sequences (ss), A regions, B-repeat regions ( [21 ), SD/SX repeat regions ( 0 ) and the cell wall anchored/ membrane spanning region (ms). (This diagram is not drawn to scale).
Figure 8.3 Flow diagram o f the proposed procedures involved in screening a 229
functional genomic DNA library. Bacterial genomic DNA libraries would be constructed in the pINIlI-OMPA vector and hosted in an
APS Ammonium persulphate BSA Bovine serum albumin
bp Base pairs
CHAPS 3-(cyclohexamino)-l propanesulfonic acid DAB Diaminobenzidene
DNA Deoxyribonucleic acid
dNTP Deoxynucleoside triphphosphate DTT Dithiothreitol
EDTA Ethylenediaminetetraacetic acid
EGTA Ethylene glycol-bis (2-aminoethylether) -N,N,N’,N ’-tetraacetic acid ELISA Enzyme-linked immunosorbent assay
PCS Foetal calf serum
HGF Human gingival fibroblast lEF Isoelectric focusing HRP Horseradish peroxidase
IFN Interferon
IgG Immunoglobulin G
IL Interleukin
IPTG Isopropyl p-D-1 -thiogalactopyranoside lU International Units
kb Kilobase
kDa Kilodalton
LB Luria-Bertani LPS Lipopolysaccharide LTA Lipoteichoic acid
M Molar
mA Milliamps
mg Milligram
ml Millilitre
mm Millimeter
mM Millimolar
MOPS 3-Morpholinopropanesulfonic acid
nm Nanometers
nM Nanomolar
CD Optical density ORF Open reading frame
PBMCs Peripheral bood mononuclear cells PBS Phosphate buffered saline
PCR Polymerase chain reaction pfu Plaque forming units
PAGE polyacrylamide gel electrophoresis PEG polyethylene glycol
PMSF Phenylmethanesulfonyl fluoride PVDF Polyvinylidene fluoride
RNA Ribonucleic acid
SDS Sodium dodecyl sulphate Taq Thermus aquaticus TBE Tris-borate-EDTA
TEMED N ,N ,N ’,N ’-tetramethylethylenediamine TNF Tumour necrosis factor
U units
pg microgram
pi microlitre
I would like to thank Professor Brian Henderson and Dr Sean N air for their advice and support throughout the years, which has made it possible to complete this thesis.
I would also like to thank Dr Steven Poole at NIB SC for the years o f collaboration and for providing us with the cytokine ELISA reagents and raising the rabbit antisera. Many thanks also to Professor Mike Curtis and Dr Mini Ranjarajan for providing the arg- gingipain A and P. gingivalis LPS used in this work and also thank you to Mike for advise on the new nomenclature o f the cysteine proteases. Also I would like to thank Fiona Roche and Tim Foster for providing the antibody against Sta. I am also grateful to Joanna Wilkins for processing the MALDI-TOF MS samples.
Thanks to my dear sister Ali for the typing and to Richard for the loan of the memory stick, sterling work on Visio and lots o f support.
Dr Julia Ranford and Dr Jo Lewthwaite must not go un-mentioned for their enormous amount o f patience and support whilst sharing my office. I would also like to thank all my workmates at the Eastman for friendship over the years, particularly Sean for the ear over a beer.
Chapter one
Introduction
The increase in marketing o f probiotic products and drinks, has raised public awareness that not all bacteria are harmful. Despite this, the variety o f antibacterial products that are now available appears to be on the increase and apart from the usual disinfectants, these range from plastics to filters for vacuum cleaners. Thus the general public is still very concerned about bacterial infection and this is not surprising when one considers press reports about “flesh-eating bacteria” and antibiotic-resistant “superbugs”. However, this fear does not sit well with the fact that ninety percent o f the cells in the human body are bacteria (Henderson & Wilson, 1998). These bacteria are comprised o f at least 1,000 different species (Wilson et a l, 2002) and are referred to variously as the normal microflora, commensal microflora or normal microbiota. Most o f the time these bacteria live with us without causing any problems. Occasionally some o f these bacteria can cause disease and such organisms are then referred to as opportunistic pathogens. Given that the general belief is that bacteria cause illness, our ability to live with so many o f these organisms needs to be explained. For example why do we not respond to the large numbers o f bacteria living on our mucosal surfaces and exist in a constant state of mucosal inflammation?
As will be discussed in this chapter, bacteria have been shown to have many exported proteins that have a wide range o f bioactivities. This thesis describes the study o f exported proteins from three bacteria. The first o f these is the Gram-negative oral opportunistic pathogen, Porphyromonas gingivalis, believed to be an important causative agent o f periodontal disease. The lipid A-associated proteins from P. gingivalis have been tested for their ability to induce cytokine production by human cells, and the identification o f the active protein has been pursued.
Identification o f surface associated proteins from the Gram-positive opportunistic pathogen Staphylococcus aureus has also been described. Exported proteins from S. aureus were identified by immuno-screening a genomic DNA library with antibodies raised against surface associated material extracted from this bacterium.
The cytokine modulating properties o f an Escherichia coli JM83 mutant, that produces lipopolysaccharide (LPS) which is 10,000 times less active than normal E. coli LPS, has also been investigated. This study was performed as a preliminary investigation for the development o f a functional genomic library that could be screened for bacterial cytokine modulating proteins. This is discussed in more detail in chapter seven.
To orient the reader this introduction will begin with a consideration o f the most powerful agents controlling inflammation, the cytokines. This will be followed by an introduction to the bacteria investigated in this thesis.
1.1 Cytokines
1.1.1 Classification and biological actions of cytokines
fashion by effecting local ceils, but are also able to act in an autocrine manner (eg. lL-1 Dinarello et a l, 1987). IL-1, IL-6 and TNF can have systemic effects such as the induction o f fever. Cytokines are important signaling molecules during cell stress, including infection. Each cytokine has a number o f biological activities (technically termed pleiotropy) and many cytokines exhibit similar activities (this has been termed redundancy). Their activities include the activation o f cells to produce prostaglandins, proteases, and other molecules important in inflammation. Other activities include chemotaxis, induction o f cell proliferation and apoptosis.
Cytokines are difficult to classify because o f their pleiotropy but have been loosely grouped according to their biological functions. The interleukins, including IL-1 to IL-18, were so called because they were initially believed to be signaling molecules between leukocytes. It is now known however that many other cell types also produce these molecules. The cytotoxic cytokines, including the TNF family, are involved in the inhibition o f cell growth as well as the killing o f cells but are principally potent proinflammatory cytokines with ability to activate most leukocytes. Interferons are involved in the control o f leukocyte function as well as the inhibition o f the growth and spread o f viruses. The colony stimulating factors are involved in the stimulation o f growth and differentiation o f myeloid cells. The growth factors generally stimulate proliferation o f non-lymphoid cells, although TGFp actually inhibits cell proliferation and chemokines are chemoattractants for leukocytes.
in Table 1.1. IL-1 and TN F-a have similar functions. For example, they stimulate vascular endothelial cells at the site o f infection to produce intercellular adhesion molecules (ICAMs) which play an important role in the recognition and migration o f activated leukocytes to the site o f infection (Pober, 1987). These two cytokines, as well as IL-6, also have systemic effects. They can cause the liver to produce a number o f bacterial opsonins (acute phase proteins) including C-reactive proteins and serum amyloid A (Moshage, 1997). These proteins bind to bacteria and aid phagocytosis and bacterial killing. IL-8 is a chemokine that recruits leukocytes into the site o f infection (Hebert & Baker, 1993). IL-1, T N F-a and IL-6 are able to induce the production o f IL-8 as well as the colony stimulating factors. Colony stimulating factors enhance the production o f leukocytes in the bone marrow allowing a supply o f antibacterial cells to be maintained.
Table 1.1 Biological activities of a number of cytokines involved in controlling inflammation.
Cytokine Source Biological Activities
IL-1
M o n o cy tes, m acrophages lym p hocytes, epith elial c ells, fibroblasts, vascular
en d oth elial c ells, osteob lasts
B /T cell activation, lym p h op oeisis, bone resorption, pyrogen ic
IL-6
M o n o cy tes, B -c ells, fibroblasts, epith elial c e lls, osteob lasts
Plasm a cell form ation, induction o f acute ph ase respon se protein
production, pyrogen ic
IL-8
M o n o cy tes, leu k ocytes, endothelial c e lls, fibroblasts, epith elial cells,
o steob lasts
C hem oattractant, activation o f neutrophils, m on ocytes and
T-lym p hohcytes
lL -1 0 T -cells, B -cells M yeloid cell deactivation
lL -1 2 T -cells, B -c ells Induction o f IFNy syn th esis T h l cell differentiation
IFNy T h l c e lls, leu k ocytes A ctiv a tes infected m acrophages
T N F a
TGFP
M acroph ages, m on ocytes, m ast cells
P latelets, m on ocytes, lym p hocytes
Sim ilar a ctivities to IL-1
Inflam m atory inhibitor, induces proliferation o f fibroblasts and
Other cytokines have anti-inflammatory effects and are able to regulate the production o f proinflammatory cytokines. The anti-inflammatory cytokines include IL-4, IL-10, IL-13, TGPP and IL-1 receptor antagonist (IL-lra- this binds to the same receptor as IL-1 but does not activate the cell) (Letterio & Roberts, 1997; Pretolani et a l, 1999; Opal & DePalo, 2000; Arend, 2002). Growth factors are also released which enable the repair o f tissue damaged by infection.
1.1.2 Bacteria interfering with cytokine networks
Cytokines rarely act as single entities, but their paracrine, autocrine and endocrine nature causes them to induce and inhibit the production o f other cytokines resulting in a cytokine network (Henderson & Seymour, 2003). This network acts to keep a finely tuned balance between pro and anti-inflammatory cytokines in healthy tissues. It is now well established that infectious diseases interfere with this network and certain diseases induce an inappropriate production o f proinflammatory cytokines that can have damaging results (Henderson & Nair, 1998). For example IL-1 (3, TN F-a and IL-6 can induce osteoclastic bone resorption and inhibit bone formation in vitro (Dewhirst et a l, 1985; Bertolini et a l,
1986; Hughes & Howells, 1993). Cytokine induced bone resorption is mediated by the induction o f RANKL (receptor activator o f NF-kP ligand) production by T-cells or osteoblasts (Jones et a l , 2002). Binding o f RANKL to its receptor RANK, present on the surface o f both osteoclast progenitors and mature osteoclasts, leads to proliferation and activation o f osteoclasts. (Zhang et a l, 2001). Bacterial infections in bone and in the oral cavity may cause an elevated production o f these RANKL-inducing cytokines leading to bone loss. Examples o f such diseases include periodontitis (Meghji et a l, 1994; Nair et a l,
disease manifestations including, in extreme cases, septic shock and toxic shock syndrome (Holst et a l , 1996; Zanotti et al., 2002). Other examples o f chronic inflammatory diseases caused by the overproduction o f IL-1 and TN F-a include rheumatoid arthritis and periodontal disease (Bingham, 2002; Graves & Cochran, 2003).
To date it has been demonstrated that many bacterial proteins are able to induce the production o f proinflammatory cytokines. The production o f proinflammatory cytokines is normally beneficial to the host as they mediate a protective response and it is only the prolonged or over-production o f proinflammatory cytokines that leads to disease. Therefore suppression o f proinflammatory cytokine production by a bacterium, may add to its virulence as this may diminish the immune response that would normally lead to bacterial killing. A number o f bacterial molecules that suppress proinflammatory cytokine production have been identified and these have been listed Table 1.2.
Table 1.2 Examples of bacterial proteins able to suppress cytokine synthesis.
Organism Cytokines suppressed Active component Reference
Y ersin ia e n te ro litic a T N F -a from LPS stim ulated m acrophages
Y opB B eu sch er e t a l., 1995
B ru c e lla su is T N F a release from E. c o li in fected m acrophages
4 5 to 50 kDa protein Caron e t a l., 1996
B a c illu s a n th ra c is T N F a production b y LPS-stim ulated m urine m acrophages
Anthrax edem a toxin H oover c / a / ., 1994
P s e u d o m o n a s a e ru g in o sa IL1, T N F a and IFNy b y PH A -stim ulated m on ocytes
A D P -rib osylatin g toxin Staugas e t al., 1992
F ra n c is e lla tu la re n sis T N F a and IL-I production by 23 kD a protein LPS stim u lated m acrophages
T elep n ev e t a i , 2003
M y c o b a c te riu m tu b e rc u lo sis T N F a , IL-6, IL-10 and IL I2 , production by M. s m e g m a tis ind uced m acrophages
19 kD a lipoprotein Post e t a t , 2001
B o r d e te lla p e r tu s s is IL-10 d epend en t su p p ression o f Filam entous haem agglutinin IL-I 2 production by LPS
stim u lated m acrophages
There are many bacterial molecules with the ability to interfere with cytokine networks and these have been reviewed (Henderson & Nair, 1998; Wilson et a l, 1998; Henderson and Seymour, 2000). Many bacterial molecules with the ability to stimulate cytokine production by human cells have been identified and a number o f these molecules, which have relevance to the studies described in this thesis, will now be introduced.
1.1.3 Bacterial cytokine modulating molecules
1.1.3.1 Lipopolysaccharide
1.1.3.1.1 Structure o f LPS
Fatty acid
M a n W A b e
0-antigenic side chain (repeated n times)
Rha Gal Glc W N a g Gal Glc H Gal
Core polysaccharide
H e p V Hep
K D O XkDOX P lEthN P Y G I c N M G I c N X P
Lipid A
Figure 1.1 Schematic representation of the lipopolysaccharide molecule from Salmonella
spp., showing the lipid-A region, the core polysaccharide and the O-antigenic side chain. P = phosphate, GlcN = glucosamine, KDO = 2-keto-3-deoxyoctuIonic acid, EthN = ethanolamine. Hep = heptulose, Glc = glucose. Gal = galactose, NAG = N-acetylglucosamine, Rha = Rhamnose, Man = mannose and Abe = abequose.
1.1.3.1.2 Host recognition o f LPS and cytokine production
Another example o f a PAMP is lipoteichoic acid (LTA) o f Gram-positive bacteria. The recognition o f PAMPS takes place by means o f pattern recognition receptors (PRRs), which are either secreted from the host cell or present on the host cell surface.
The main PRRs for LPS are CD 14, which also recognizes other bacterial carbohydrates (Fenton & Golenbock, 1998), and the Toll-like receptor 4 (TLR4) (Means et a l , 2000a & b; Underhill & Ozinsky, 2002). Evidence for the role of TLR4 in recognizing LPS originally came from the discovery that the LPS hypo-responsive C3H/HeJ mouse strain has a point mutation in the TLR4 gene, rendering it unable to recognize LPS (Hoshino et a l, 1999).
The current understanding o f immune recognition o f LPS is that binding o f the serum protein, LPS-binding protein (LBP), catalyses the transfer o f LPS to surface bound or soluble CD 14 (Schumann et a l , 1990). CD 14 then catalyses the transfer o f LPS from the extracellular space to the membrane where it interacts with its receptor complex o f TLR4 and a protein known as MD-2 (Triantafilou & Triantafilou, 2002). The binding o f LPS to this receptor complex leads to signal transduction and activates several signaling pathways that can lead to the production o f cytokines.
1.1.3.1.3 Structure and function o f LPS
It is now well established that the lipid A portion o f the LPS molecule is responsible for its endotoxic activity (Erridge et a l , 2002; Galanos et a l , 1985) and structural studies o f both naturally occurring and synthetic lipid A have shown that the major factors contributing to endotoxicity include the number and lengths o f acyl chains present and the phosphorylation o f the disaccharide backbone (Alexander & Reitschel, 2001; Caroff et a l, 2002).). Lipid A from E. coli and Salmonella minnesota both carry six acyl chains five o f which have 14 carbons (C-14) and one o f which has 12 (C-12). They both also carry two phosphate groups, one at the 1’ position and another at the 4 ’ position (Chan et a l, 1994; Galanos et a l , 1985). Lipids A from these bacteria are more endotoxic than lipid A from Helicobacter pylori (Moran et a l , 1997) and Bacillus fragilis (Lindberg et a l, 1990). H. pylori lipid A has only 4 acyl chains that are longer in length (three with C-18 and one with
C-16) (Moran et a l , 1997) and that o f B. fragilis has five acyl chains that are also longer in length (two o f C l 6, two o f C l 5 and one o f C l7) (Weintraub et a l, 1989). Both H. pylori and B. fragilis lipid A lack the phosphate group at the 4 ’ position and this is also true o f P. gingivalis lipid A (section. 1.2.1.2)
response. The exact structure and function relationship o f lipid A and its ability to both bind to cells and elicit a response has yet to be clarified.
Polymyxin B is a cationic anti-microbial peptide that is able to augment outer membrane permeability and cause damage to the cytoplasmic membrane o f Gram-negative bacteria. Polymyxin B is also able to suppress the endotoxic activities o f lipid A, for example cytokine induction o f mammalian cells (Stokes et a l, 1989). It is believed that the amine groups present on polymyxin B are able to bind to the negatively charged phosphate groups present on lipid A (Yin et a l , 2003). Bacteria that lack the 4 ’ phosphate group o f lipid A display unusual activities with polymyxin B. For example polymyxin B blocks the activity o f E. coli LPS in the limulus amoebocyte lysate (LAL) assay (section 2.4) but has no effect on the activity in the LAL assay o f H. pylori LPS (Matsuyama et a l, 2001). Polymyxin B is also unable to block B. fragilis LPS induction o f E-selectin expression by epithelial cells but completely blocks expression induced by E. coli LPS (Sato et a l , 1998).
Core region
-O -P-0
HO
NH NH O
-P-0-0=
0=
0=
0=
Figure 1.2 Structure of lipid A from E. coli K-12. The structure enclosed in a lined box is the myristate group, not present in the mutated E. coli msbB strain or P. gingivalis, H. pylori and
1.1.3.2 Lipid A associated proteins
Endotoxin is the term used to describe LPS and proteins that are associated with the LPS in the outer membrane (Hitchcock & Morrison, 1984). These proteins have been termed Lipid A-associated proteins (LAPs) (Morrison & Jacobs, 1976) or endotoxin- associated protens, (Phillips et a l , 1989). LAPs from a number o f bacteria have been shown to have immunomodulatory properties. For example LAPs from enteric bacteria have been shown to have potent adjuvant activity and to prevent apoptosis o f monocytes (Mangan et a l , 1992). They have also been shown to induce IL-1 by human monocytes and T N F a by murine C3H/HeJ macrophages (Hogan & Vogel, 1988; Mangan et a l, 1992). The LAPs from a number o f oral bacteria, have been shown to induce IL-6 production by human gingival fibroblasts and monocytes (Reddi et a l, 1995b) and bone resorption in the murine calvarial bone resorption assay (Reddi et a l, 1995a).
1.1.3.3 Surface-associated materiai
As well as the proteins that are cell wall anchored or embedded in the outer membrane, it has also been shown that there are many exported proteins that are loosely associated with the bacterial surface. Work previously carried out at the Eastman has shown that these proteins can be removed from the bacterial surface by gentle washing with saline (Figure 1.3) (Wilson et a l , 1985). The product obtained from this washing step has been termed surface-associated material (SAM).
production by human peripheral blood mononuclear cells (PBMCs) and IL-6 by human gingival fibroblasts (Reddi et a i, 1996). It has also been shown that SAM from these same organisms can induce bone resorption in the murine calvarial bone resorption assay (Reddi et a l, 1995a). One component purified from the SAM of A. actinomycetemcomitans, termed gapstatin, has been shown to have antiproliferative effects on various cell lines by inhibiting mammalian cell eycle progression (White et a l, 1998). Also, a component of the SAM o f A. actinomycetemcomitans that induced bone resorption, was purified and identified as homologue of the E. coli molecular chaperone, GroEL (chaperonin 60; Kirby g /a /., 1995).
Figure 1.3 Transmission electron micrograph of S. aureus cells before (a) and after (b) gentle washing with saline to remove surface-associated material. Cells were fixed with ruthenium red in order to stabilise the cell surface.
Having introduced cytokines and cytokine-modulating bacterial factors the bacteria studied in the work described in this thesis will now be discussed along with their exported virulence factors.
1.2
Porphyromonas gingivalis
Porphyromonas gingivalis is a black pigmented. Gram-negative anaerobe. It is highly proteolytic and able to readily agglutinate erythrocytes and lyse them in order to release haem and other essential nutrients. This bacterium is part o f the normal oral microflora and a well-recognised causative agent o f periodontal diseases. Periodontal diseases are common chronic inflammatory diseases that comprise a group o f infections o f the supporting tissues o f the teeth. These infections range from mild inflammation o f the gums to chronic destruction o f periodontal tissues such as gums, periodontal ligament and alveolar bone. This tissue destruction can then lead on to loss o f the teeth.
The mechanisms o f pathogenesis o f this bacterium are still not fully understood but many virulence factors and their functions have been identified and characterized. This section will describe some o f these factors and their possible role in the periodontal diseases.
1.2.1 P. gingivalis exported virulence factors
1.2.1.1 P. gingivalis proteases
(Fletcher et a l , 1997 & 1998; Calkins et a l, 1998). The proteases therefore appear to perturb many o f the host systems and thus may give rise to the symptoms o f periodontal disease.
Table 1.3 A list of P. gingivalis exported proteases. Enzyme
A rg-gin gip ain A (R g p A )
A rg-gingip ain B (R gp B )
L ys-gin gip ain (K gp )
C o lla g en a se (prtC)
d ip ep tid yl p eptidase (D pp IV )
endothelin converting-like en zy m e (P ep O )
periodontain
PrtT
thiol protease (Tpr)
arginine carb oxypeptid ase (R ep )
References
Curtis e t a l., 1999
Curtis e t a l ., 1999
Curtis e t a l ., 1999
Kato e / a / ., 1992
K iyam a e t a l ., 1998
A w an o e t a l ., 1999
N elso n e t a l., 1999
O togoto & K uram itsu, 1995
Bourgeau e t a l ., 1992
M asuda e t al., 2 0 0 2
The catalytic domains o f RgpA and RgpB are homologous, but RgpB lacks the haemagglutinin domains o f RgpA. The haemagglutinin/adhesin domains o f RgpA and Kgp are also homologous to protein sequences present in four contiguous repeats that make up the protein, haemagglutinin A (HagA; Han et a l, 1995). This sequence is also present in the TonB linked adhesin (Aduse-Opoku et a l, 1997). The organisation o f these related proteins and their similarities are presented schematically in Figure 1.4.
colonisation as well as the processing of nutrients and will be discussed in more detail in chapters three and seven of this thesis. They are therefore accepted as important virulence factors o f P. gingivalis, which contribute to the pathology that is typical of the periodontal diseases.
c a ta ly tic d o m a in < h a e m a g g lu tin in d o m a in
RgpA ///////////////////
c a ta ly tic d o m a in
P q q Q y77777777777777777X
X ct t { i { 1 1 1 i t 1 1 < L t i t i
c a ta ly tic d o m a in < h a e m a g g lu tin in d o m a in >
Kgp
HagA
TIa
w w w w w w w w w
h a e m a g g lu tin in d o m a in s
< h a e m a g g lu tin in d o m a in >
Figure 1.4 Structural organization of the gingipains and related proteins.
1.2.1.2 P. gingivalis lipopolysaccharide
The LPS of P. gingivalis (P-LPS) has been extensively studied and has been shown to have a wide range of biological activities. It has been shown to be a potent mitogen (Fujiwara et a l, 1988), activate B-cells (Koga et a l, 1985), induce apoptosis (Isogai et a l,
1996) and induce the production o f the proinflammatory cytokines IL-1 (5, IL-6 and TNFa (Roberts et a l, 1997; Kent et a l, 1998 & 1999). P-LPS is also able to induce bone resorption (Bom-Van-Noorloos et a l, 1990; Nair et a l, 1983).