O R I G I N A L R E S E A R C H
Identi
fi
cation of novel biomarkers and candidate
small molecule drugs in non-small-cell lung cancer
by integrated microarray analysis
This article was published in the following Dove Press journal:
OncoTargets and Therapy
Qiong Wu1,2,* Bo Zhang1,2,* Yidan Sun3 Ran Xu1 Xinyi Hu4 Shiqi Ren4 Qianqian Ma5 Chen Chen6 Jian Shu7 Fuwei Qi7 Ting He7 Wei Wang2 Ziheng Wang2
1Medical School of Nantong University,
Nantong 226001, People’s Republic of China;
2The Hand Surgery Research Center,
Department of Hand Surgery, Affiliated Hospital of Nantong University, Nantong 226001, People’s Republic of China;
3Department of Oncology, First Teaching
Hospital of Tianjin University of Traditional Chinese Medicine, Tianjin 300193, People’s Republic of China;4Department of
Biochemistry & Molecular Biology, Nantong University, Nantong, Jiangsu 226001, People’s Republic of China;5Emergency Office, Wuxi
Center for Disease Control and Prevention, Wuxi 214023, People’s Republic of China;
6Department of Oncology, The Affiliated
Cancer Hospital of Nanjing Medical University, Nanjing, People’s Republic of China;7The First
People‘s Hospital of Taicang City, Taicang Affiliated Hospital of Soochow University, Suzhou 215400, People’s Republic of China
*These authors contributed equally to this work
Background: Non-small-cell lung cancer (NSCLC) remains the leading cause of cancer
morbidity and mortality worldwide. In the present study, we identified novel biomarkers
associated with the pathogenesis of NSCLC aiming to provide new diagnostic and therapeu-tic approaches for NSCLC.
Methods: The microarray datasets of GSE18842, GSE30219, GSE31210, GSE32863 and GSE40791 from Gene Expression Omnibus database were downloaded. The differential
expressed genes (DEGs) between NSCLC and normal samples were identified by limma
package. The construction of protein–protein interaction (PPI) network, module analysis and
enrichment analysis were performed using bioinformatics tools. The expression and prog-nostic values of hub genes were validated by GEPIA database and real-time quantitative
PCR. Based on these DEGs, the candidate small molecules for NSCLC were identified by the
CMap database.
Results: A total of 408 overlapping DEGs including 109 up-regulated and 296
down-regulated genes were identified; 300 nodes and 1283 interactions were obtained from the
PPI network. The most significant biological process and pathway enrichment of DEGs were
response to wounding and cell adhesion molecules, respectively. Six DEGs (PTTG1, TYMS,
ECT2, COL1A1, SPP1 and CDCA5) which significantly up-regulated in NSCLC tissues,
were selected as hub genes according to the results of module analysis. The GEPIA database
further confirmed that patients with higher expression levels of these hub genes experienced
a shorter overall survival. Additionally, CMap predicted the 20 most significant small
molecules as potential therapeutic drugs for NSCLC. DL-thiorphan was the most promising small molecule to reverse the NSCLC gene expression.
Conclusions: Based on the gene expression profiles of 696 NSCLC samples and 237
normal samples, we first revealed that PTTG1, TYMS, ECT2, COL1A1, SPP1 and
CDCA5 could act as the promising novel diagnostic and therapeutic targets for NSCLC. Our work will contribute to clarifying the molecular mechanisms of NSCLC initiation and progression.
Keywords: non-small-cell lung cancer, novel biomarkers, candidate small molecules, prognosis, bioinformatics analysis
Introduction
Lung cancer remains the leading cause of cancer morbidity and mortality worldwide. In 2018, there are 234,030 newly diagnosed lung cancer patients, accounting for 13.5% of all types of malignant tumors. In addition, lung cancer results in approximately 154,050 death cases each year, accounting for 25.3% of all cancer-related deaths; 80–85% of all
Correspondence: Ziheng Wang; Wei Wang The Hand Surgery Research Center, Department of Hand Surgery, Affiliated Hospital of Nantong University, Nantong 226001, People’s Republic of China Tel +86 159 6297 0534; +86 136 1521 3504 Email [email protected]; [email protected]
OncoTargets and Therapy
Dove
press
open access to scientific and medical research
Open Access Full Text Article
OncoTargets and Therapy downloaded from https://www.dovepress.com/ by 118.70.13.36 on 25-Aug-2020
lung cancer patients are diagnosed with non-small-cell lung cancer (NSCLC) subtype and 80% lung cancer-associated deaths are caused by NSCLC. The subtypes of NSCLC mainly consist of lung adenocarcinoma, lung squamous cell carcinoma and large cell lung cancer based on histological sub-classification.1–4Although great advance has been made in the therapeutic methods for NSCLC such as surgical resection, chemotherapy, radiotherapy and targeted therapy, the patients’ prognosis is still far from ideal, with 5-year survival rate less than 20%. For advanced patients who are inoperable, chemotherapy such as platinum still remains the
most ideal and important treatment strategy for NSCLC.5–7
The poor long-term survival rate of NSCLC patients is mainly attributed to the lack of specific symptoms and effec-tive diagnostic methods at an early stage. In additionally, high metastasis rate and drug resistance are also vital factors
that can not be ignored.8–10 In recent years, with our
increased understanding of molecular characterization of NSCLC, molecular targeting therapies especially individua-lized precision treatment have undergone remarkable
developments.11,12 Despite the prominent progress in the
molecular diagnosis and treatment for NSCLC, substantive breakthroughs have not yet been made in patients’survival.13 Therefore, there is still an urgent demand to identify the novel biomarkers correlated with NSCLC diagnosis and prognosis to elucidate the precise molecular mechanism of NSCLC occurrence and progression. In this study, the micro-array data of GSE18842, GSE30219, GSE31210, GSE32863 and GSE40791 from Gene Expression Omnibus (GEO) data-base was used to identify the differential expressed genes (DEGs) between NSCLC and adjacent normal tissues. Gene Ontology (GO) and pathway enrichment analysis were per-formed to better understand the biological functions of these
DEGs. We also established a protein–protein interaction
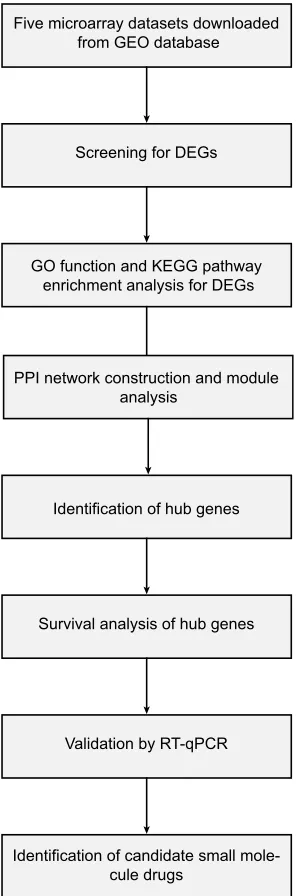
(PPI) network associated the DEGs. Furthermore, we also identified potential candidate small molecules for a better treatment of NSCLC. Six novel biomarkers were found to be related to the pathogenesis and prognosis of NSCLC. In summary, this study aimed to exploit promising novel bio-markers for NSCLC diagnosis, prognosis and molecular targeting therapies from new insights. Figure 1 shows the workflow of our study.
Materials and methods
Data resources
Series matrix files of GSE18842, GSE30219, GSE31210,
GSE32863 and GSE40791 were downloaded from GEO data-base (http://www.ncbi.nlm.nih.gov/geo/). The platforms were
based on GPL9948 (Agilent Human 0.6 K miRNA Microarray G4471A; Agilent Technologies, Santa Clara, CA, USA) (GSE32863) and GPL570 (Affymetrix Human Genome U113 Plus 2.0 Array) (GSE18842, GSE30219, GSE31210 and GSE40791). A total of 696 NSCLC samples and 237 normal samples were included in our study, of which 46 tumor samples and 45 normal samples were in GSE18842
profile, 272 tumor samples and 14 normal samples in
GSE30219 profile, 226 tumor samples and 20 normal samples
in GSE31210 profile, 58 tumor samples and 58 normal
sam-ples in GSE32863 profile, and 94 tumor samples and 100
normal samples in GSE40791 profile.
Screeningfor DEGs
The matrix data of each dataset was performed log2 con-version and normalization using limma package of R/
Bioconductor software.14 The limma package was also
utilized to screen and identify the DEGs between
NSCLC samples and normal tissue sample. Adjust P
-value <0.05 and |log2FC| >1 were considered the statistical significance of differential expression.
Functional enrichment analysis
GO and Kyoto Encyclopedia of Genes and Genomes (KEGG) pathway enrichment analysis were performed to determine the biological functions of the overlapping DEGs. GO enrichment analysis is an extensively used method to investigate the molecular function (MF), cell component (CC) and biological process (BP) of genes or gene products. KEGG is a widely used database for systema-tic analysis of high-level gene functions. In this study, we carried out GO function and KEGG pathway enrichment analysis based on the platform of Database for Annotation Visualization and Integrated Discovery (DAVID, http:// david.ncifcrf.gov), an online database rich in comprehensive
annotation information of gene and protein functions. P
-value <0.05 was considered statistically significant.15–19
Protein
–
protein interaction (PPI)
network construction and module
analysis
We used the online database STRING (Search Tool for the Retrieval of Interacting Genes, https://string-db.org/) to better illustrate the potential interactive relationships among the
overlapping DEGs.20Then the Cytoscape software was
uti-lized for analyzing the interactions with a combined score >0.4
(http://www.cytoscape.org/).21 Finally, the plug-in MCODE
OncoTargets and Therapy downloaded from https://www.dovepress.com/ by 118.70.13.36 on 25-Aug-2020
(Molecular Complex Detection) was used tofilter the signifi -cant modules from the PPI network for the selection of hub genes (degree cutoff = 2, node score cutoff = 0.2, k-core = 2,
and max. depth = 100).22We also performed functional and
pathway enrichment analysis for the genes in the significant modules. The heat map of module genes was constructed using UCSC Cancer Genomics Browser (http://genome-can cer.ucsc.edu). The Networks Gene Oncology tool (BiNGO), a plugin in Cytoscape, was used to explore and visualize the BP of the selected hub genes.23
Survival analysis and validation of hub
genes
To further explore the roles of module genes in the NSCLC occurrence and development, we predicted the co-expression genes of module genes and the co-expression network was constructed by cBioPortal online platform (http://www.cbio portal.org).24,25 The Gene Expression Profiling Interactive Analysis (GEPIA) database was utilized to assess the impact of hub genes on the patients’prognosis.26The NSCLC patients were divided into high expression and low expression groups
Five microarray datasets downloaded from GEO database
Screening for DEGs
GO function and KEGG pathway enrichment analysis for DEGs
PPI network construction and module analysis
Identification of hub genes
Survival analysis of hub genes
Validation by RT-qPCR
Identification of candidate small mole-cule drugs
Figure 1The workflow of this study.
OncoTargets and Therapy downloaded from https://www.dovepress.com/ by 118.70.13.36 on 25-Aug-2020
according to the median expression levels of hub genes. The hazard ratio (HR) with 95% CI of overall survival was calcu-lated for each group. And the GEPIA platform was applied to further verify the expression level of hub genes between NSCLC and normal samples. We analyzed the protein expres-sion of hub genes by using the human protein atlas (HPA, www.proteinatlas.org) database considering that gene expres-sion was not always consistent with its protein level.27
Identi
fi
cation of small molecules
The CMap database (http://www.broadinstitute.org/cmap/) was used to explore potential small molecule drugs for use in patients based on the gene signature of NSCLC. CMap
collects >7,000 gene expression profile changes induced
by various small molecular agents.28The overlapping
dif-ferently expressed probesets among five datasets were
classified into up-regulated and down-regulated groups.
Then, these probesets from the two groups were uploaded into CMap database to match corresponding active small
molecules. Finally, the enrichment scores between−1 and
1, which represent similarity, were calculated. A positive connectivity score (closer to +1) indicated the correspond-ing small molecule is able to induce the state of NSCLC cells, whereas a negative connectivity score (closer to−1) demonstrate greater similarity between the genes. We investigated and calculated negative connectivity scores with potential therapeutic value.
Real-time quantitative PCR
Total RNA from tumor tissues and non-tumorous tissues was extracted with Trizol reagent (Invitrogen, Carlsbad, CA, USA) according to the protocol. cDNA was synthe-sized using an Omniscript Reverse Transcription kit (Qiagen, Valencia, CA, USA). Quantitative real-time PCR (qPCR) assays were performed using EvaGreen Master Mix (Biotium Inc., Hayward, CA, USA). The
conditions for qPCR amplification were as follows: 95°C
for 120 s followed by 40 cycles of 95°C for 15 s, anneal-ing temperature for 45 s. Each sample was run in triplicate. Relative expression level for each target gene was normal-ized by the Ct value of GAPDH (endogenous reference) using a 2−ΔΔCtrelative quantification method. The primers are as follows:
PTTG1 gene 5ʹ-GACTCAGGCTGGAAGATTTG-3ʹ
(sense) and 5ʹ- GGGAAGGTGGGAGAAGC-3ʹ(anti-sense).
CDCA5 gene 5ʹ-TTTTCAGTTCCGTGGGTTTC-3ʹ
(sense) and 5ʹ-CCCAACTAAGGCTCCCTACAT-3ʹ
(anti-sense).
TYMS gene 5ʹ-AGCGAGAACCCAGACCTT-3ʹ(sense)
and 5ʹ-AATAGTTGGATGCGGATTGTA-3ʹ(anti-sense).
ECT2 gene 5ʹ-AGGCGGAATGAACAGGA-3ʹ (sense)
and 5ʹ-TTCATCTCCAAGCGGTAAA-3ʹ(anti-sense)
COL1A1 gene 5ʹ-CAAGGTGTTGTGCGATGACG-3ʹ
(sense) and 5ʹ-CGACGCCGGTGGTTTCTT-3ʹ(anti-sense)
SPP1 gene 5ʹ-CTGCCAGCAACCGAAGT-3ʹ (sense)
and 5ʹ-GTGATGTCCTCGTCTGTAGC-3ʹ(anti-sense);
All reactions were performed on the Eppendorf
Mastercycler ep realplex (2S; Eppendorf, Hamburg,
Germany). using following cycling parameters, 95°C for 2 min, followed by 40 cycles of 95°C for 15 s, 60°C for 45 s.
Ethics statement
This study was performed with the approval of the
institu-tional ethics committee of the Affiliated Hospital of
Nantong University. And written informed consent had been provided for the NSCLC patients included in the present study, which was conducted in accordance with the Declaration of Helsinki.
Results
Identi
fi
cation of DEGs in NSCLC
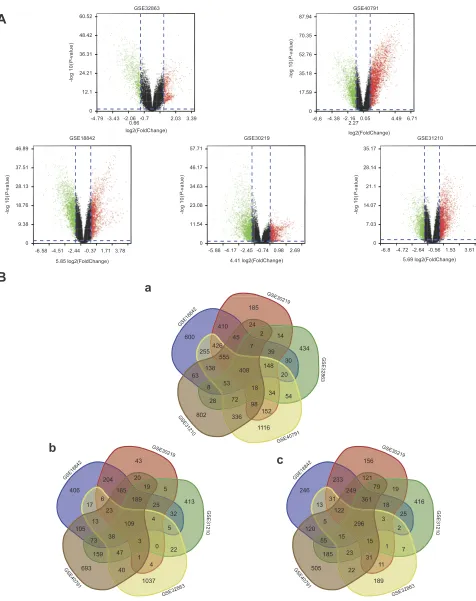
After integrated bioinformatical analysis for GSE18842, GSE30219, GSE31210, GSE32863 and GSE40791 data-sets, a total of 408 overlapping genes were found to be differentially expressed. The volcano plot showed the up-regulated and down-up-regulated DEGs in each dataset with the cutoff criterion ofP<0.05 and |log2FC| >1. The Venn diagrams showed the 408 overlap DEGs among the three
datasets (Figure 2Ba) including 109 significantly
up-regu-lated genes (Figure 2Bb) and 296 down-reguup-regu-lated genes (Figure 2Bc).
Enrichment analyses
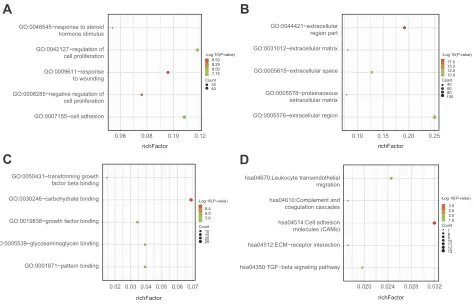
In order to investigate the biological functions of these DEGs in NSCLC, GO and KEGG pathway, enrichment analysis was performed using DAVID. For BPs, GO ana-lysis results indicated that up-regulated and
down-regu-lated DEGs were significantly enriched in response to
wounding, negative regulation of cell proliferation, regula-tion of cell proliferaregula-tion, cell adhesion and response to
OncoTargets and Therapy downloaded from https://www.dovepress.com/ by 118.70.13.36 on 25-Aug-2020
GSE32863 GSE40791
A
60.52 87.9448.42 70.35
36.31 52.76
24.21 35.18
12.1 17.59
0 0
-4.79 -3.43 -2.06 -0.7 0.66 log2(FoldChange)
2.03 3.39 -6.6 -4.38 -2.16 0.05
2.27 log2(FoldChange) 4.49 6.71
a
B
185 24 410 2 14 600 45 426 555 7 434 255 39 30 148 138 408 20 63 53 8 18 34 54 72 28 98 152 802 336 1116b
c
43 156 20 121 204 23319 5 79 19
406 165 246 249
6 31
122
189 413 361 416
17 25 13 18
23 32 25
4 3
13 109 5 296
5 2
105 120
38 15
73 3 55 15
0 22 1 7
47 23
159 1 185 31
4 11
693 40 505 22
1037 189 -l og 1 0 ( P -v a lu e ) -l og 1 0 ( P -v a lu e ) -l og 1 0 ( P -v al ue) -l og 1 0 ( P -v a lu e ) -l og 1 0 ( P -v a lu e ) GSE31210 35.17 28.14 21.1 14.07 7.03 0
-6.8 -4.72 -2.64 -0.56 1.53
5.69 log2(FoldChange) GSE30219 57.71 46.17 34.63 23.08 11.54 0
-5.88 -4.17 -2.45 -0.74 0.98 2.69
4.41 log2(FoldChange) GSE18842 46.89 37.51 28.13 18.76 9.38 0
-6.58 -4.51 -2.44 -0.37 1.71 3.78
5.85 log2(FoldChange)
3.61
Figure 2(A) Volcano plot of gene expression profile data between NSCLC and normal tissues in each dataset. Red dots: significantly up-regulated genes in NSCLC; green
dots: significantly down-regulated genes in NSCLC; black dots: non-differentially expressed genes. Adj.P<0.01 and |log2FC|>1 were considered as significant. (Ba) Venn
diagram of 408 overlapping DEGs from GSE18842, GSE30219, GSE31210, GSE32863 and GSE40791 datasets. (Bb) Up-regulated DEGs (Bc) Down-regulated DEGs.
OncoTargets and Therapy downloaded from https://www.dovepress.com/ by 118.70.13.36 on 25-Aug-2020
steroid hormone stimulus. CC analysis showed that these DEGs were particularly involved in extracellular region part, extracellular region, extracellular space,
proteinac-eous extracellular matrix and extracellular matrix.
Similarly, changes in MF of DEGs were significantly
enriched in carbohydrate binding, growth factor binding, glycosaminoglycan binding, transforming growth factor beta binding and pattern binding. Furthermore, KEGG pathway enrichment analysis revealed that these DEGs
were mainly enriched in cell adhesion molecules
(CAMs), leukocyte transendothelial migration, TGF-beta signaling pathway, complement and coagulation cascades and ECM-receptor interaction (Figure 3 and Table 1).
PPI network construction and module
analysis
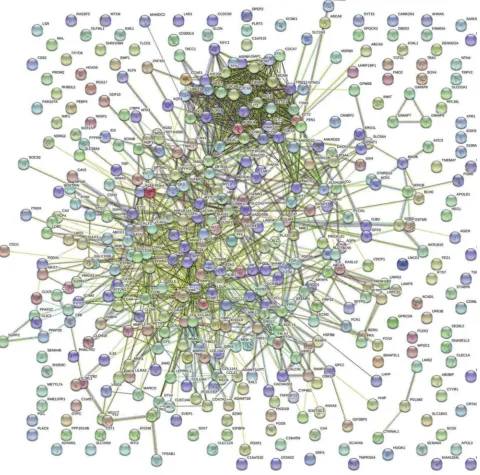
The STRING database and Cytoscape were used to construct a PPI network of the potential interactions between the over-lapping DEGs. As presented in Figure 4, there were 300 nodes and 1283 interactions found in the network. The top three
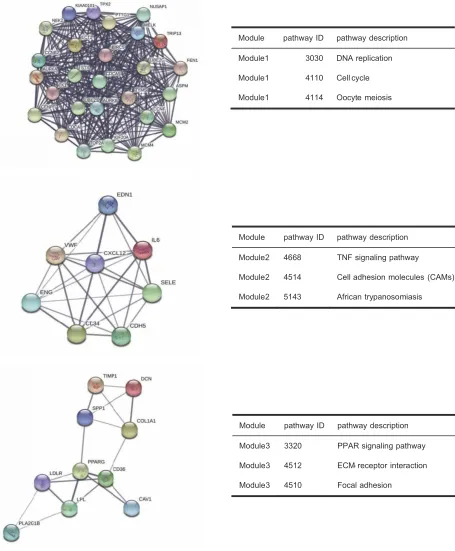
significant modules were detected by MCODE (Figure 5).
Pathway enrichment analysis suggested that the module1
genes were mainly enriched in DNA replication, cell cycle and oocyte meiosis (Figure 5A). The genes in module 2 were mainly enriched in tumor necrosis factor signaling pathway, CAMs and African trypanosomiasis (Figure 5B). The genes in module 3 were significantly enriched in PPAR signaling path-way, ECM-receptor interaction and Focal adhesion (Figure
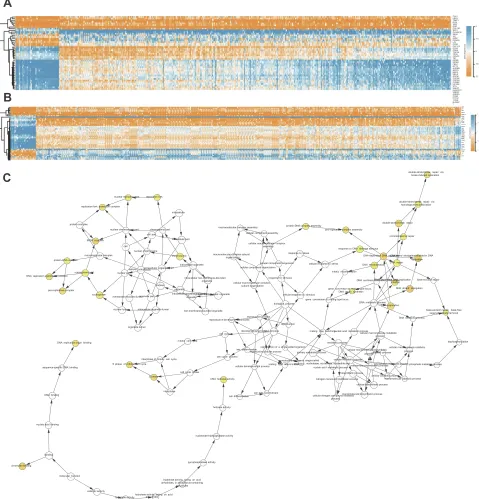
5C) (Table 2). The heat map clearly showed the significant
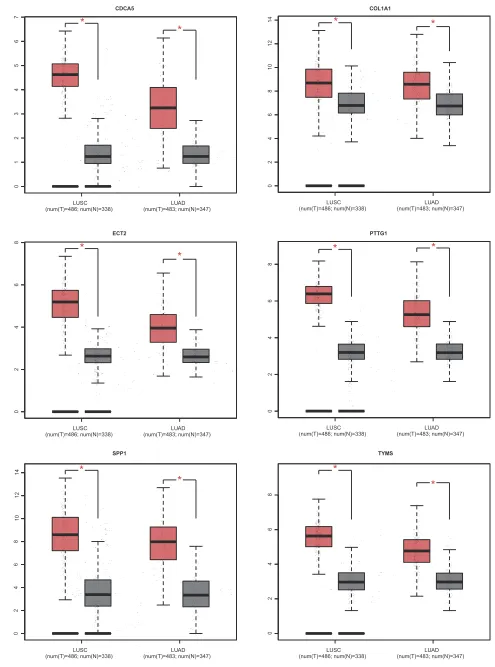
difference of module genes between cancer tissues and adja-cent tissues(Figure 6A and B). Macromolecular complex sub-unit organization, S phase and cell cycle phase were the main BP of module genes (Figure 6C). Among the module genes, we selected PTTG1, TYMS, ECT2, COL1A1, SPP1 and CDCA5 with high degree of connectivity as hub genes (Table 3). The expression of hub genes in NSCLC tissues was significantly up-regulated compared to normal tissues.
Analysis and validation of hub genes
The prognostic information of PTTG1, TYMS, ECT2, COL1A1, SPP1 and CDCA5 was freely obtained from GEPIA database. A total of 962 NSCLC patients were available for survival analysis. It was found that the high expression level of PTTG1, TYMS, ECT2,
A
B
GO:0048545~response to steroid hormone stimulus
GO:0044421~extracellular region part
GO:0042127~regulation of cell proliferation
GO:0031012~extracellular matrix -Log 10(P-value)
8.50 17.5
8.25 15.0
8.00 12.5
GO:0009611~response to wounding
GO:0005615~extracellular space
7.75 10.0
Count
40 60 80 100 30
40 GO:0008285~negative regulation of
cell proliferation
GO:0005578~proteinaceous extracellular matrix
GO:0007155~cell adhesion GO:0005576~extracellular region
0.06 0.08 0.10 0.12 0.10 0.15 0.20 0.25
richFactor richFactor
C
D
GO:0050431~transforming growth factor beta binding
hsa04670:Leukocyte transendothelial migration
GO:0030246~carbohydrate binding hsa04610:Complement and
coagulation cascades
-Log 10(P-value) -Log 10(P-value)
3.0
6.4 2.5
6.0 2.0
5.6 1.5
GO:0019838~growth factor binding hsa04514:Cell adhesion
molecules (CAMs) Count
Count
7 8 9 10 11 12 13 10
15 20 25
GO:0005539~glycosaminoglycan binding hsa04512:ECM−receptor interaction
GO:0001871~pattern binding hsa04350:TGF−beta signaling pathway
0.02 0.03 0.04 0.05
richFactor
0.06 0.07 0.020 0.024
richFactor
0.028 0.032
-Log 10(P-value)
Count
Figure 3Functional and signaling pathway analysis of the overlapped DEGs in NSCLC. (A) Biological processes, (B) cellular components, (C) molecular function and (D) KEGG pathway.
OncoTargets and Therapy downloaded from https://www.dovepress.com/ by 118.70.13.36 on 25-Aug-2020
COL1A1, SPP1 and CDCA5 was markedly associated with worse overall survival for NSCLC patients
(Figures 7and 8A). This finding further confirmed the
key role of these hub genes in the onset of NSCLC. Based on the immunohistochemical staining results from HPA database, the protein expression level of PTTG1, TYMS, ECT2, COL1A1, SPP1 and CDCA5 was consistent with their gene expression, that is, the protein levels of hub genes were also in a higher expression state in NSCLC tissues compared to normal tissues (Figure 7B). In addition, we established a net-work of module genes and their co-expression genes (Figure 9A). In summary, PTTG1, TYMS, ECT2, COL1A1, SPP1 and CDCA5 could represent the important diagnostic and prognostic biomarkers for NSCLC.
Identi
fi
cation of related active small
molecules
To identify candidate small molecule drugs targeting the gene expression of NSCLC, all the overlapping DEGs, which were divided into up-regulated and down-regu-lated groups, were submitted to the CMap database. The
20 most significant small molecules matched to the
NSCLC gene expression changes are listed in Table 4
and Figure 9B. Among these small molecules,
DL-thior-phan (enrichment score = −0.826) and
phenoxybenza-mine (enrichment score = −0.823) showed a highly
significant negative correlation and have the potential to
reverse the tumoral status of NSCLC. This analysis pro-vided novel insights into the treatment of NSCLC. However, further studies were still needed to explore the molecular mechanism of these small molecules in NSCLC. To futher investigate the moleuclar mechinism of the hub genes in NSCLCS, we predicted potential transcription factors (Figure S1) and constructed a regu-latory network of lncRNA, miRNA and mRNA (Figure S2) by Gene-Cloud Biotechnology Information (GCBI) database.
Evaluation of gene expression in NSCLC
To further verify the expression of PTTG1, CDCA5, TYMS, ECT2, COL1A1 and SPP1 genes in NSCLC tis-sues and corresponding adjacent normal tistis-sues, we choose seven pairs of tumor tissues and corresponding adjacent tissues. Relative expression of PTTG1, CDCA5, TYMS, ECT2, COL1A1 and SPP1 mRNA in NSCLC and adjacent
non-tumorous tissues were quantified by qPCR. The
results showed that the average PTTG1, CDCA5, TYMS, ECT2, COL1A1 and SPP1 mRNA expression level in
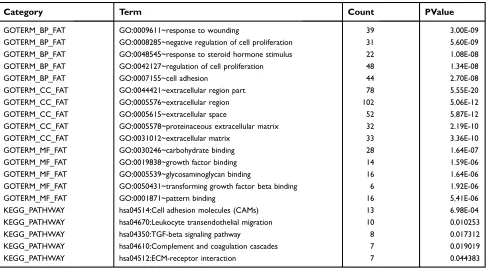
Table 1.Functional and pathway enrichment analysis of the overlap DEGs
Category Term Count PValue
GOTERM_BP_FAT GO:0009611~response to wounding 39 3.00E-09
GOTERM_BP_FAT GO:0008285~negative regulation of cell proliferation 31 5.60E-09
GOTERM_BP_FAT GO:0048545~response to steroid hormone stimulus 22 1.08E-08
GOTERM_BP_FAT GO:0042127~regulation of cell proliferation 48 1.34E-08
GOTERM_BP_FAT GO:0007155~cell adhesion 44 2.70E-08
GOTERM_CC_FAT GO:0044421~extracellular region part 78 5.55E-20
GOTERM_CC_FAT GO:0005576~extracellular region 102 5.06E-12
GOTERM_CC_FAT GO:0005615~extracellular space 52 5.87E-12
GOTERM_CC_FAT GO:0005578~proteinaceous extracellular matrix 32 2.19E-10
GOTERM_CC_FAT GO:0031012~extracellular matrix 33 3.36E-10
GOTERM_MF_FAT GO:0030246~carbohydrate binding 28 1.64E-07
GOTERM_MF_FAT GO:0019838~growth factor binding 14 1.59E-06
GOTERM_MF_FAT GO:0005539~glycosaminoglycan binding 16 1.64E-06
GOTERM_MF_FAT GO:0050431~transforming growth factor beta binding 6 1.92E-06
GOTERM_MF_FAT GO:0001871~pattern binding 16 5.41E-06
KEGG_PATHWAY hsa04514:Cell adhesion molecules (CAMs) 13 6.98E-04
KEGG_PATHWAY hsa04670:Leukocyte transendothelial migration 10 0.010253
KEGG_PATHWAY hsa04350:TGF-beta signaling pathway 8 0.017312
KEGG_PATHWAY hsa04610:Complement and coagulation cascades 7 0.019019
KEGG_PATHWAY hsa04512:ECM-receptor interaction 7 0.044383
OncoTargets and Therapy downloaded from https://www.dovepress.com/ by 118.70.13.36 on 25-Aug-2020
NSCLC tissues was significantly higher compared with
non-tumorous tissues (*p<0.05, compared with adjacent
non-tumorous tissues, Figure 9C).
Discussion
Recently, the rapid advance in microarray and high-throughput technologies has expanded the application bio-medicine in clinical practice, such as cancer early diagnosis, novel targeted drug discovery and prognosis prediction.
GEO database, as a public repository for archiving high-throughput microarray experimental data, has provided the powerful tools to determine key genes and pathways
associated with the pathogenesis of tumors.29,30 In the
present study, based on the GEO database, five gene
expression profiles including 696 NSCLC samples and
237 normal samples were integrated for a comprehensive
bioinformatics analysis. The aim of our study was tofind
the potential small molecule drugs for the treatment of
Figure 4The protein–protein interaction networks of overlapping DEGs.
OncoTargets and Therapy downloaded from https://www.dovepress.com/ by 118.70.13.36 on 25-Aug-2020
NSCLC and to identify the novel biomarkers correlated with the pathogenesis and prognosis of NSCLC. A total of 408 overlapping DEGs between tumor tissues and
corre-sponding adjacent normal tissues were identified, which
consisted of 109 up-regulated genes and 296 down-regu-lated genes. For a better in-depth understanding of these
overlapping DEGs, the GO function and KEGG pathway enrichment for these DEGs were performed. GO term analysis was carried out via the following aspects: BP, MF and CC. The BP analysis showed that these DEGs were mainly enriched in response to wounding, negative regulation of cell proliferation and regulation of cell
Module pathway ID pathway description
Module1 3030 DNA replication
Module1 4110 Cell cycle
Module1 4114 Oocyte meiosis
Module pathway ID pathway description
Module2 4668 TNF signaling pathway
Module2 4514 Cell adhesion molecules (CAMs)
Module2 5143 African trypanosomiasis
Module pathway ID pathway description
Module3 3320 PPAR signaling pathway
Module3 4512 ECM- receptor interaction
Module3 4510 Focal adhesion
Figure 5The three most significant modules extracted from PPI network and KEGG pathway analysis of module genes.
OncoTargets and Therapy downloaded from https://www.dovepress.com/ by 118.70.13.36 on 25-Aug-2020
proliferation. MF analysis indicated that these DEGs were
significantly associated with carbohydrate binding, growth
factor binding and glycosaminoglycan binding. Changes in CC were mainly enriched in extracellular region part, extracellular region and extracellular space. The KEGG
pathway enrichment analysis revealed nine significant
sig-naling pathways including CAMs, leukocyte transendothe-lial migration, TGF-beta signaling pathway, complement and coagulation cascades and ECM-receptor interaction. Multiple CAM are involved in the tumor growth,
metas-tasis and angiogenesis. Vascular CAM-1 wasfirst noted as
an endothelial cell adhesion receptor for more than two decades, which plays a key role in leukocyte recruitment in cellular immune responses. The L1 cell adhesion mole-cule (L1CAM), as neural adhesion molemole-cules, extensively participates in the progression of human malignant
tumors.31,32 Targeting the TGFβ pathway has been used
for various cancer therapy.33,34 An increasing number of
studies reveal that the ECM-receptor interaction pathway
is significantly associated with the various cancer cells
proliferation and invasion. Zhang et al demonstrated that Twist2 is involved in the proliferation and invasion of kidney cancer cells through regulating the expression of two molecules in the ECM-receptor interaction pathway:
ITGA6 and CD44.35 In summary, the above theories
strongly supported our findings from bioinformatics
ana-lysis. The PPI network complex based on DEGs-encoding proteins was constructed and 300 nodes with 1283 inter-actions were obtained. The MCODE plug-in extracted
three modules with the most significant degree from the
PPI network. TTG1, TYMS, ECT2, COL1A1, SPP1 and CDCA5 with high degree of connectivity were selected as hub genes. Survival analysis for 962 NSCLC patients from GEPIA database showed that patients with high expression
levels of PTTG1, TYMS, ECT2, COL1A1, SPP1 and CDCA5 experienced a worse prognosis than those with low expression. To validate the results of bioinformatics analysis, we performed qPCR analysis to evaluate the expression of hub genes expression in seven paired NSCLC tissues. The qPCR analysis showed the same gene expression trend as found in the GEO database,
thereby verifying the reliability of our results.
Additionally, the establishment of a network of lncRNA–
miRNA–mRNA and the prediction of transcription factors
will enhance our understanding of the mechanism of PTTG1, TYMS, ECT2, COL1A1, SPP1 and CDCA5 in the pathogenesis of NSCLC. Previous studies have proved that PTTG1 protein is abundantly expressed in various invasive tumors and hematopoietic malignant tumors, but its expression level is low or undetectable in most normal tissues. Several studies have further emphasized the role of PTTG1 in the growth and metastasis of tumors. They have shown that ectopic expression of PTTG1 enhances prolif-eration or invasiveness in various histologically derived cancer cell lines, whereas silencing of PTTG1 produces
the opposite result.36,37CDCA5 plays a key role in
ensur-ing the accurate separation of sister chromatids in S and G2/M phases of cell cycle by interacting with coherents and cdk1. Additionally, CDCA5 also interacts with the key regulatory factors ERK and cyclin E1 of G1/Smitotic checkpoint. Recent studies have shown that the expression of CDCA5 in oral squamous cell carcinoma, urothelial cell carcinoma and gastric cancer, which is related to
tumor-igenesis and tissue invasion.38,39 ECT2 is a guanine
nucleotide exchange factor (GEF), which is related to tumor cell differentiation, TNM stage, prognosis and lymph node metastasis, such as breast cancer,
osteosar-coma cells, gastric cancer, and gliomas.40,41COL1A1 is a
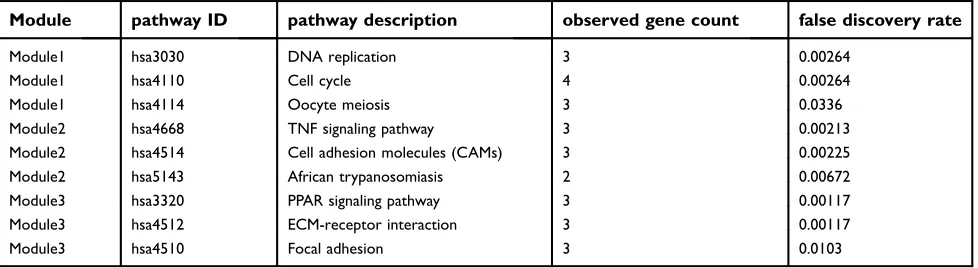
Table 2The pathway enrichment analysis of module genes
Module pathway ID pathway description observed gene count false discovery rate
Module1 hsa3030 DNA replication 3 0.00264
Module1 hsa4110 Cell cycle 4 0.00264
Module1 hsa4114 Oocyte meiosis 3 0.0336
Module2 hsa4668 TNF signaling pathway 3 0.00213
Module2 hsa4514 Cell adhesion molecules (CAMs) 3 0.00225
Module2 hsa5143 African trypanosomiasis 2 0.00672
Module3 hsa3320 PPAR signaling pathway 3 0.00117
Module3 hsa4512 ECM-receptor interaction 3 0.00117
Module3 hsa4510 Focal adhesion 3 0.0103
OncoTargets and Therapy downloaded from https://www.dovepress.com/ by 118.70.13.36 on 25-Aug-2020
target gene of miR-133a-3p in oral squamous cell
carci-noma and miR-129-5p in gastric cancer.42,43However, no
studies have reported the potential mechanism of ITGB5 and RGS4 in the initiation and progression of NSCLC. The above studies indicated PTTG1, TYMS, ECT2, COL1A1, SPP1 and CDCA5 may also play an important role in the occurrence and development of NSCLC.
In additionally, analyzed with the overlapping DEGs and CMap database, we determined a set of small mole-cule drugs that had potential to reverse the gene expres-sion changes of NSCLC. The small molecules with a
highly significant negative enrichment value may become
new targeted drugs for the treatment of NSCLC.
DL-thiorphan, as the most significant small molecule
A
CAV1 LDLR TIMP1 DCN VWF ENG COL1A1 SPP1 PLA2G1B SELE IL6 EDN1 PPARG LPL CD36 CXCL12 CD34 CDH5 TOP2A TPX2 CENPF TK1 MCM2 MCM4 FEN1 ECT2 AURKB BIRC5 NEK2 MELK ASPM CDCA8 CDCA5 CCNB2 KIF20A STIL UBE2T KIAA0101 UBE2C AURKA CCNF PTTG1 TYMS NUSAP 1 6 7.5 9 10.5 12B
LDLR VWF TIMP1 COL1A1 PLA2G1B MCM2 TPX2 TK1 ECT2 CCNF KIAA0101 AURKB NEK2 TYMS NUSAP1 AURKA CDCA8 KIF20A BIRC5 CCNB2 SELE CD34 CD36 IL6 PPARG CAV1 ENG DCN 6 SPP1 TOP2A MCM4 CENPF 7.5 STIL MELK UBE2T PTTG1 9 FEN1 ASPM 10.5 UBE2C CDCA5 CXCL12 CDH5 LPL EDN1 12double-strand break repair via break-induced replication
C
nuclear replication fork replication fork
double-strand break repair via homologous recombination replication fork protection complex
intracellular
double-strand break repair protein complex protein-DNA complex assembly
pre-replicative complex assembly macromolecular complex assembly
nuclear chromosome part chromosomal part
cellular component assembly cell part
recombinational repair intracellular part
MCM complex
cellular macromolecular complex assembly cell
response to DNA damage stimulus nuclear chromosome
response to stress macromolecular complex subunit
organization
macromolecular complex DNA-dependent DNA reDplNicAatisotnrand elongation involved in DNA replication chromosome
protein-DNA complex
DNA repair cellular component biogenesis cellular response to stress
intracellular organelle DNA recombination cellular component organization
cellular_compionntreanctellular organelle part
nuclear part mitotic recombination nucleoplasm part
DNA replication preinitiation complex intracellular non-membrane-bounded organelle
response to stimulus cellular macromolecular complex
subunit organization
DNA-dependent DNA replication base-excision repair DNA synthesis involved in DNA repair
initiation nucleus
DNA strand elongation gene conversion at mating-type locus,
DNA repair synthesis organelle
pre-replicative complex
intracellular membranem-beomubnrdaende-bounded organelle organelle
nucleoplasm cellular response to stimulus membrane-enclosed lumoerganelle part
gene conversion at mating-type locus
DNA metabolic process DNA replication biological_process
nuclear lumen intracellular organelle lumen base-excision repair, base-free sugar-phosphate removal DNA catabolic process non-membrane-bounded organelle
reproductive process reproductive developmental process
reproduction organelle lumen
developmental procelsluslar process mating type switchingnucleic acid metabolic process cellular macromolecule metabolic
process cell cycle
mitotic cell cycle dephosphorylation DNA replication origin binding metabolic process
reproduction of a single-celled organism cellular macromolecule catabolic sex determinationreproductive cellular process primary metabolic process cellular macromolecule biosyntheticprocesccsatabolic process process cell cycle process
interphase of mitotic cell cycle S phase of mitotic cell cycle
cellular metabolic process reproductive process in single-celled
mating type determinaotrigoannism nucleobase, nucleoside, nucleotide and phosphorus metabolic process phosphate metabolic process macromolecule metabolic process
cellular developmental process
sequence-specific DNA binding nucleic acid metabolic process cell cycle phase biosynthetic process
cellular catabolic process macromolecule catabolic process S phase
DNA helicase activity nitrogen compound metabolic process cellular biosynthetic process interphase cell fate commitment macromolecule biosynthetic process DNA binding cellular nitrogen compound metabolic
process cell differentiation
helicase activity
nucleic acid binding
nucleoside-triphosphatase activity
binding
pyrophosphatase activity chromatin binding
molecular_function
hydrolase activity, acting on acid anhydrides, in phosphorus-containing
anhydrides catalytic activity
hydrolase activity, acting on acid hydrolase activity anhydrides
Ge n e Ex pre s sio n Gene Exp re ssio n
Figure 6(A,B) The heatmap of module genes between NSCLC (LUAD and LUSC) and normal samples. (C) The BiNGO revealed the biological process of module genes.
The color depth of nodes represents the correctedP-value. The size of nodes represents the number of genes involved.
OncoTargets and Therapy downloaded from https://www.dovepress.com/ by 118.70.13.36 on 25-Aug-2020
(enrichment score = −0.826), was the most promising small molecule to reverse the abnormal NSCLC gene expression. It is worth noting that so far no research has focused on the potential role of this small molecule in NSCLC. Similarly, the relationship between
phenoxy-benzamine (enrichment score = −0.823) and NSCLC was
also not investigated. This information is beneficial for
the development of novel targeted drugs for the treatment of NSCLC. Given the emergence of these candidate biomarkers in silico, in vitro studies (with cell lines, etc.) and then in vivo experiments could be worth of interest in functional validation.
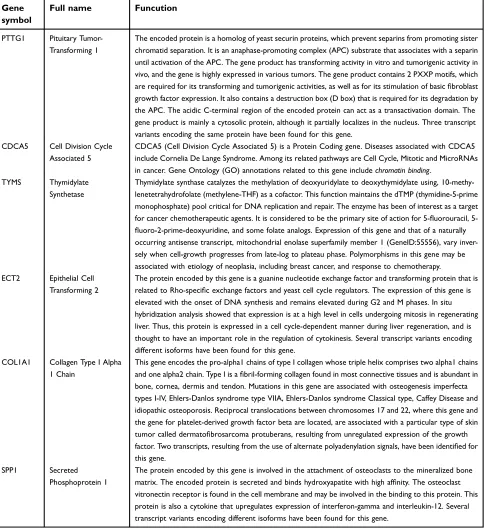
Table 3The full name and functional roles of hub genes
Gene symbol
Full name Funcution
PTTG1 Pituitary Tumor-Transforming 1
The encoded protein is a homolog of yeast securin proteins, which prevent separins from promoting sister chromatid separation. It is an anaphase-promoting complex (APC) substrate that associates with a separin until activation of the APC. The gene product has transforming activity in vitro and tumorigenic activity in vivo, and the gene is highly expressed in various tumors. The gene product contains 2 PXXP motifs, which are required for its transforming and tumorigenic activities, as well as for its stimulation of basicfibroblast growth factor expression. It also contains a destruction box (D box) that is required for its degradation by the APC. The acidic C-terminal region of the encoded protein can act as a transactivation domain. The gene product is mainly a cytosolic protein, although it partially localizes in the nucleus. Three transcript variants encoding the same protein have been found for this gene.
CDCA5 Cell Division Cycle Associated 5
CDCA5 (Cell Division Cycle Associated 5) is a Protein Coding gene. Diseases associated with CDCA5 include Cornelia De Lange Syndrome. Among its related pathways are Cell Cycle, Mitotic and MicroRNAs in cancer. Gene Ontology (GO) annotations related to this gene includechromatin binding.
TYMS Thymidylate
Synthetase
Thymidylate synthase catalyzes the methylation of deoxyuridylate to deoxythymidylate using, 10-methy-lenetetrahydrofolate (methylene-THF) as a cofactor. This function maintains the dTMP (thymidine-5-prime monophosphate) pool critical for DNA replication and repair. The enzyme has been of interest as a target for cancer chemotherapeutic agents. It is considered to be the primary site of action for 5-fluorouracil, 5-fluoro-2-prime-deoxyuridine, and some folate analogs. Expression of this gene and that of a naturally occurring antisense transcript, mitochondrial enolase superfamily member 1 (GeneID:55556), vary inver-sely when cell-growth progresses from late-log to plateau phase. Polymorphisms in this gene may be associated with etiology of neoplasia, including breast cancer, and response to chemotherapy. ECT2 Epithelial Cell
Transforming 2
The protein encoded by this gene is a guanine nucleotide exchange factor and transforming protein that is related to Rho-specific exchange factors and yeast cell cycle regulators. The expression of this gene is elevated with the onset of DNA synthesis and remains elevated during G2 and M phases. In situ hybridization analysis showed that expression is at a high level in cells undergoing mitosis in regenerating liver. Thus, this protein is expressed in a cell cycle-dependent manner during liver regeneration, and is thought to have an important role in the regulation of cytokinesis. Several transcript variants encoding different isoforms have been found for this gene.
COL1A1 Collagen Type I Alpha 1 Chain
This gene encodes the pro-alpha1 chains of type I collagen whose triple helix comprises two alpha1 chains and one alpha2 chain. Type I is afibril-forming collagen found in most connective tissues and is abundant in bone, cornea, dermis and tendon. Mutations in this gene are associated with osteogenesis imperfecta types I-IV, Ehlers-Danlos syndrome type VIIA, Ehlers-Danlos syndrome Classical type, Caffey Disease and idiopathic osteoporosis. Reciprocal translocations between chromosomes 17 and 22, where this gene and the gene for platelet-derived growth factor beta are located, are associated with a particular type of skin tumor called dermatofibrosarcoma protuberans, resulting from unregulated expression of the growth factor. Two transcripts, resulting from the use of alternate polyadenylation signals, have been identified for this gene.
SPP1 Secreted
Phosphoprotein 1
The protein encoded by this gene is involved in the attachment of osteoclasts to the mineralized bone matrix. The encoded protein is secreted and binds hydroxyapatite with high affinity. The osteoclast vitronectin receptor is found in the cell membrane and may be involved in the binding to this protein. This protein is also a cytokine that upregulates expression of interferon-gamma and interleukin-12. Several transcript variants encoding different isoforms have been found for this gene.
OncoTargets and Therapy downloaded from https://www.dovepress.com/ by 118.70.13.36 on 25-Aug-2020
CDCA5 COL1A1
*
LUSC (num(T)=486; num(N)=338)
LUAD (num(T)=483; num(N)=347) LUSC
(num(T)=486; num(N)=338)
LUAD (num(T)=483; num(N)=347)
ECT2 PTTG1
*
LUSC (num(T)=486; num(N)=338)
LUAD (num(T)=483; num(N)=347) LUSC
(num(T)=486; num(N)=338)
LUAD (num(T)=483; num(N)=347)
SPP1 TYMS
*
LUSC (num(T)=486; num(N)=338)
LUAD (num(T)=483; num(N)=347)
LUSC (num(T)=486; num(N)=338)
LUAD (num(T)=483; num(N)=347)
02
4
68
10
12
14
0246
8
01234567
0
24
68
0
2
4
6
80
24
6
81
0
1
2
14
*
•
*
*
*
*
*
*
*
*
Figure 7The expression level of hub genes according to the GEPIA database.
OncoTargets and Therapy downloaded from https://www.dovepress.com/ by 118.70.13.36 on 25-Aug-2020
A
Overall survival
Low CDCA5 TPM
Overall survival
Low COL1A1 TPM
Overall survival
Low ECT2 TPM High CDCA5 TPM
Logrank p=0.022 HR(high)=1.3 P(HR)=0.022 n(high)=481 n(low)=481
High COL1A1 TPM Logrank p=0.015 HR(high)=1.3 P(HR)=0.015 n(high)=481 n(low)=481
High ECT2 TPM Logrank p=0.046 HR(high)=1.2 P(HR)=0.047 n(high)=481 n(low)=481
0 50 100 150 200 250 0 50 100 150 200 250 0 50 100 150 200 250
Months
Overall survival
Low PTTG1 TPM
Months
Overall survival
Low SPP1 TPM
Months
Overall survival
Low TYMS TPM High PTTG1 TPM
Logrank p=0.033 HR(high)=1.2 P(HR)=0.034 n(high)=481 n(low)=481
High SPP1 TPM Logrank p=0.01 HR(high)=1.3 P(HR)=0.011 n(high)=481 n(low)=481
High TYMS TPM Logrank p=0.028 HR(high)=1.3 P(HR)=0.028 n(high)=481 n(low)=481
0 50 100 150 200 250 0 50 100 150 200 250 0 50 100 150 200 250
Months Months Months
B
NSCLC
NORMAL
P ercent sur v iv a l P ercent sur v iv al 0.0 0.2 0.4 0.6 0.8 1.0 0.0 0.2 0.4 0.6 0.8 1.0 P ercent su rvi va l P ercent su rvi v al 0.0 0 .2 0.4 0.6 0.8 1.0 0.0 0.2 0.4 0.6 0 .8 1.0 P ercent su rv iv a l P e rcent su rv iv al 0.0 0.2 0.4 0.6 0.8 1.0 0.0 0.2 0.4 0.6 0.8 1.0Figure 8(A) The survival analysis for hub genes according to the GEPIA database.(B) The protein level expression of hub genes in NSCLC and normal tissues using immunohistochemistry.
OncoTargets and Therapy downloaded from https://www.dovepress.com/ by 118.70.13.36 on 25-Aug-2020
Conclusion
In this study, six key genes were identified for the first
time in NSCLC by integrated bioinformatics analysis. Survival analysis revealed that high expression levels of PTTG1, TYMS, ECT2, COL1A1, SPP1 and CDCA5 were markedly associated with worse prognosis of patients. These hub genes could act as the promising novel biomarkers for the diagnosis, prognosis and
treatment of NSCLC. We also revealed several crucial signaling pathways correlated with the NSCLC initiation
and progression. Furthermore, we identified a set of
can-didate small molecule drugs which could reverse the abnormal gene expression of NSCLC. We hope the pre-sent study could provide powerful evidence for the future development of genomic individualized treatment in NSCLC.
A
B
Y−27632 sulconazole sanguinarine rottlerin repaglinide pyrvinium
-Log10(PValue)
puromycin
phenoxybenzamine 3
milrinone 2
menadione 1
medrysone Count
2 3 4 5 6 ginkgolide A
estriol DL−thiorphan blebbistatin 8−azaguanine 5255229 5224221 4,5−dianilinophthalimide 0297417−0002B
−0.90 −0.85 −0.80
enrichment
−0.75 −0.70
C
Data from PCR*
Control Tumor 8
*
*
*
*
6
*
4
2
0
PTTG1 CDCA5 TYMS ECT2 COL1A1 SPPA
n
oi
s
s
er
p
x
e
e
n
e
G
Molecule
A
Figure 9(A) The network of module genes and their expression genes constructed by cBioPortal. Nodes with thick outline: hub genes; nodes with thin outline:
co-expression genes.(B) The 20 most small molecules drugs identified by CMap database. (C) qPCR validation of these six hub genes in seven paired NSCLC samples.
*P<0.05.
OncoTargets and Therapy downloaded from https://www.dovepress.com/ by 118.70.13.36 on 25-Aug-2020
Disclosure
The authors report no conflicts of interest in this work.
References
1. Siegel RL, Miller KD, Jemal A. Cancer statistics, 2018.CA Cancer J Clin. 2018;68(1):7–30. doi:10.3322/caac.21442
2. Ulahannan SV, Brahmer JR. Antiangiogenic agents in combination with chemotherapy in patients with advanced non-small cell lung cancer. Cancer Invest. 2011;29(4):325–337. doi:10.3109/ 07357907.2011.554476
3. Ramalingam SS, Owonikoko TK, Khuri FR. Lung cancer: new biological insights and recent therapeutic advances. CA Cancer J Clin. 2011;61(2):91–112. doi:10.3322/caac.20102
4. Herbst RS, Heymach JV, Lippman SM. Lung cancer.N Engl J Med. 2008;359(13):1367–1380.
5. Boolell V, Alamgeer M, Watkins DN, Ganju V. The evolution of therapies in non-small cell lung cancer. Cancers. 2015;7(3):1815– 1846.
6. Khakwani A, Rich AL, Powell HA, et al. Lung cancer survival in England: trends in non-small-cell lung cancer survival over the dura-tion of the nadura-tional lung cancer audit. Br J Cancer. 2013;109 (8):2058–2065.
7. Rothschild SI. [Advanced and metastatic lung cancer - What is new in the diagnosis and therapy?].Praxis. 2015;104(14):745–750. 8. Song W, Tang Z, Li M, et al. Polypeptide-based combination of
paclitaxel and cisplatin for enhanced chemotherapy efficacy and reduced side-effects.Acta Biomater. 2014;10(3):1392–1402. 9. Sibille A, Paulus A, Martin M, et al. [MANAGEMENT OF
NON-SMALL CELL LUNG CANCER].Rev Med Liege. 2015;70(9):432–441. 10. Lu X, Zhou D, Hou B, et al. Dichloroacetate enhances the antitumor efficacy of chemotherapeutic agents via inhibiting autophagy in non-small-cell lung cancer. Cancer Manag Res. 2018;10:1231–1241. doi:10.2147/CMAR.S156530
11. Niu FY, Wu YL. Personalized treatment strategies for non-small-cell lung cancer in Chinese patients: the role of crizotinib.Onco Targets Ther. 2015;8:999–1007. doi:10.2147/OTT.S64664
12. Toro M, Gomez-Lojero C, Montal M, Estrada OS. Charge transfer mediated by nigericin in black lipid membranes.J Bioenerg. 1976;8 (1):19–26.
13. Ni M, Liu X, Wu J, et al. Identification of candidate biomarkers correlated with the pathogenesis and prognosis of non-small cell lung cancer via integrated bioinformatics analysis. Front Genet. 2018;9:469. doi:10.3389/fgene.2018.00173
14. Ritchie ME, Phipson B, Wu D, et al. limma powers differential expression analyses for RNA-sequencing and microarray studies.
Nucleic Acids Res. 2015;43(7):e47. doi:10.1093/nar/gkv007 15. Gene Ontology Consortium. The Gene ontology (GO) project in
2006. Nucleic Acids Res. 2006;34(Databaseissue):D322–D326. doi:10.1093/nar/gkj021
16. Ashburner M, Ball CA, Blake JA, et al. Gene ontology: tool for the unification of biology. The Gene Ontology Consortium.Nat Genet. 2000;25(1):25–29. doi:10.1038/75556
17. Kanehisa M, Goto S. KEGG: kyoto encyclopaedia of genes and genomes.Nucleic Acids Res. 2000;28(1):27–30(24).
18. Dennis G Jr., Sherman BT, Hosack DA, et al. DAVID: Database for annotation, visualization, and integrated discovery. Genome Biol. 2003;4(5):P3. doi:10.1186/gb-2003-4-5-p3
19. Huang DW, Sherman BT, Lempicki RA. Systematic and integrative analysis of large gene lists using DAVID bioinformatics resources.
Nat Protoc. 2009;4(1):44–57. doi:10.1038/nprot.2008.211
20. Damian S, Andrea F, Stefan W, et al. STRING v10: protein-protein interaction networks, integrated over the tree of life.Nucleic Acids Res. 2015;43(Database issue):D447. doi:10.1093/nar/gku1003
21. Smoot ME, Ono K, Ruscheinski J, Wang PL, Ideker T. Cytoscape 2.8: new features for data integration and network visualization.
Bioinformatics. 2011;27(3):431–432. doi:10.1093/bioinformatics/btq675 22. Bandettini WP, Kellman P, Mancini C, et al. MultiContrast delayed enhancement (MCODE) improves detection of subendocardial myo-cardial infarction by late gadolinium enhancement cardiovascular magnetic resonance: a clinical validation study.J Cardiovasc Magn Reson. 2012;14:83. doi:10.1186/1532-429X-14-83
23. Maere S, Heymans K, Kuiper M. BiNGO: a cytoscape plugin to assess overrepresentation of gene ontology categories in biological networks. Bioinformatics. 2005;21(16):3448–3449. doi:10.1093/ bioinformatics/bti551
24. Cerami E, Gao J, Dogrusoz U, et al. The cBio cancer genomics portal: an open platform for exploring multidimensional cancer geno-mics data. Cancer Discov. 2012;2(5):401–404. doi:10.1158/2159-8290.CD-12-0095
25. Gao J, Aksoy BA, Dogrusoz U, et al. Integrative analysis of complex cancer genomics and clinical profiles using the cBioPortal. Sci Signal. 2013;6(269):pl1. doi:10.1126/scisignal.2004088
26. Tang Z, Li C, Kang B, Gao G, Li C, Zhang Z. GEPIA: a web server for cancer and normal gene expression profiling and interactive analyses.Nucleic Acids Res. 2017;45(W1):W98–w102. doi:10.1093/ nar/gkx247
27. Maier T, Guell M, Serrano L. Correlation of mRNA and protein in complex biological samples. FEBS Lett. 2009;583(24):3966–3973. doi:10.1016/j.febslet.2009.10.036
28. Lamb J, Crawford ED, Peck D, et al. The connectivity map: using gene-expression signatures to connect small molecules, genes, and disease. Science. 2006;313(5795):1929–1935. doi:10.1126/ science.1132939
29. Kulasingam V, Diamandis EP. Strategies for discovering novel cancer biomarkers through utilization of emerging technologies. Nat Rev Clin Oncol. 2008;5(10):588–599. doi:10.1038/ncponc1187 30. Edgar R, Domrachev M, Lash AE. Gene expression omnibus: NCBI
gene expression and hybridization array data repository. Nucleic Acids Res. 2002;30(1):207–210.
Table 4List of the 20 most significant small molecule drugs
cmap name enrichment p
DL-thiorphan -0.92 0.01312
phenoxybenzamine -0.9 0.00016
sanguinarine -0.844 0.04873
blebbistatin -0.826 0.05964
repaglinide -0.797 0.00334
medrysone -0.795 0.00016
8-azaguanine -0.792 0.00378
menadione -0.778 0.09664
milrinone -0.774 0.02354
Y-27632 -0.774 0.10102
4,5-dianilinophthalimide -0.757 0.11651
puromycin -0.748 0.00806
5255229 -0.748 0.12557
pyrvinium -0.736 0.0007
rottlerin -0.736 0.03758
5224221 -0.736 0.13802
ginkgolide A -0.733 0.01011
0297417-0002B -0.72 0.04521
estriol -0.718 0.01281
sulconazole -0.71 0.01428
OncoTargets and Therapy downloaded from https://www.dovepress.com/ by 118.70.13.36 on 25-Aug-2020
31. Schlesinger M, Bendas G. Vascular cell adhesion molecule-1 (VCAM-1)–an increasing insight into its role in tumorigenicity and metastasis.Int J Cancer. 2015;136(11):2504–2514.
32. Yu X, Yang F, Fu DL, Jin C. L1 cell adhesion molecule as a therapeutic target in cancer.Expert Rev Anticancer Ther. 2016;16(3):359–371. 33. Ahmadi A, NajafiM, Farhood B, Mortezaee K. Transforming growth
factor-beta signaling: tumorigenesis and targeting for cancer therapy.
J Cell Physiol. 2018.
34. Gotovac JR, Fujihara KM, Phillips WA, Clemons NJ. TGF-beta signaling and its targeted therapy in gastrointestinal cancers.Discov Med. 2018;26(142):103–112.
35. Zhang HJ, Tao J, Sheng L, et al. Twist2 promotes kidney cancer cell proliferation and invasion by regulating ITGA6 and CD44 expression in the ECM-receptor interaction pathway.Onco Targets Ther. 2016;9:1801– 1812.
36. Pei L, Melmed S. Isolation and characterization of a pituitary tumor-transforming gene (PTTG).Mol Endocrinol. 1997;11(4):433–441. 37. Panguluri SK, Yeakel C, Kakar SS. PTTG: an important target gene
for ovarian cancer therapy.J Ovarian Res. 2008;1(1):6.
38. Chang IW, Lin VC, He HL, et al. CDCA5 overexpression is an indicator of poor prognosis in patients with urothelial carcinomas of the upper urinary tract and urinary bladder.Am J Transl Res. 2015;7 (4):710–722.
39. Tokuzen N, Nakashiro K, Tanaka H, Iwamoto K, Hamakawa H. Therapeutic potential of targeting cell division cycle associated 5 for oral squamous cell carcinoma.Oncotarget. 2016;7(3):2343–2353.
40. Jin Y, Yu Y, Shao Q, et al. Up-regulation of ECT2 is associated with poor prognosis in gastric cancer patients. Int J Clin Exp Pathol. 2014;7(12):8724–8731.
41. Sano M, Genkai N, Yajima N, et al. Expression level of ECT2 proto-oncogene correlates with prognosis in glioma patients.Oncol Rep. 2006;16(5):1093–1098.
42. Oleksiewicz U, Liloglou T, Tasopoulou KM, et al. COL1A1, PRPF40A, and UCP2 correlate with hypoxia markers in non-small cell lung cancer.J Cancer Res Clin Oncol. 2017;143(7):1133–1141. 43. Li J, Ding Y, Li A. Identification of COL1A1 and COL1A2 as candidate prognostic factors in gastric cancer.World J Surg Oncol. 2016;14(1):297.
OncoTargets and Therapy downloaded from https://www.dovepress.com/ by 118.70.13.36 on 25-Aug-2020
Supplementary materials
Figure S1The potential transcription factors associated with the expression of hub genes.
OncoTargets and Therapy downloaded from https://www.dovepress.com/ by 118.70.13.36 on 25-Aug-2020
OncoTargets and Therapy
Dove
press
Publish your work in this journal
OncoTargets and Therapy is an international, peer-reviewed, open access journal focusing on the pathological basis of all cancers, potential targets for therapy and treatment protocols employed to improve the management of cancer patients. The journal also focuses on the impact of management programs and new therapeutic
agents and protocols on patient perspectives such as quality of life, adherence and satisfaction. The manuscript management system is completely online and includes a very quick and fair peer-review system, which is all easy to use. Visit http://www.dovepress.com/ testimonials.php to read real quotes from published authors.
Submit your manuscript here:https://www.dovepress.com/oncotargets-and-therapy-journal
Figure S2A regulatory network of lncRNA-miRNA-mRNA constructed by GCBI. Purple nodes: related lncRNA; Blue nodes: targeted miRNA.
OncoTargets and Therapy downloaded from https://www.dovepress.com/ by 118.70.13.36 on 25-Aug-2020