2567 IJSTR©2019
The Effect Of Degradation On Changes In
Physical And Hydraulic Characteristics Of
Organic Waste
Febrian Hadinata, Betty Susanti, Muthia Soraya, Aprina Sriwita Silaban
Abstract:— The number of landslides occurring in landfills reminds us that landfills are an engineering structure that must be assessed for stability. Due to variations in Municipal Solid Waste (MSW) composition and the effects of organic waste degradation, MSW geotechnical parameters vary greatly and can change in a short time. Therefore, it is necessary to study the geotechnical parameters of MSW for a more reliable calculation of stability. This research is an initial study that examines changes in physical characteristics (unit weight and grain size distribution) and hydraulics (hydraulic conductivity) of (artificial) organic waste, which is made from leaf litter. The results showed that the characteristics of organic waste samples change in a fast time, where the hydraulic conductivity of organic waste decreases, whereas bulk density and moisture content increase along with the degradation process, while the dry density does not show a significant increase. The results of this study indicate that the geotechnical characteristics of MSW in landfills can vary and change, related to the pattern of compaction and management of leachate (waste water). Rapid changes of the geotechnical parameters of the test results make this research must be continued with a wider sample variant and a longer observation time.
Index Terms:— bulk density, degradation, dry density, grain size, hidraulic conductivity, moisture content, organic waste.
—————————— ——————————
1
I
NTRODUCTIONLandfilling at the Solid Waste Disposal Site (SWDS) is the main alternative in the final processing of Municipal Solid Waste (MSW) in Indonesia [1], the terminology is known as the ―Tempat Pemrosesan Akhir (TPA)‖. However, the lack of studies on the characteristics of waste in landfills makes landslides always occur in Indonesian landfills. Landslides are related to physical, mechanical and hydraulic aspects of waste. [2] provided a discussion about the importance of under-drain to control groundwater levels to prevent waste landslides in landfills. The characteristics of the stockpiled waste have a major influence on the design, operation, and management of landfills, which affects settlement, slope stability, and integrity of leachate/gas suppliers [3]. [4] mentioned that there is a relationship between the ability to flow water with MSW compressibility, where the effect of the water flow out of waste cells may be more dominant than the mechanical settlement of (artificial) MSW. Indonesian waste has high compressibility due to the condition of the initial compaction which is not optimum, as well as the high of moisture content and organic matter content, so that settlement is quite large and occurs quickly [5], this condition results in a large risk of landslides in SWDS Indonesia. The effect of rising water levels in landfills is evident among others in (a) DonaJuana landfill in Columbia which collapsed due to too high leachate levels [6], [7] in [8], (b) Payatas landfill in the Philippines in 2000 due to continuous heavy rains, leaving 278 people dead and 100 missing, [9] in [8].
In Indonesia, the TPA Leuwigajah landslide occurred due to a combination of rainwater infiltration that was softening the bottom layer of the landfill and the waste cohesivity [10] and [2], killing 147 people. Many landfill landslides occur every year in Indonesia. In 2019 (from various news sources), landslides in the landfill occurred in (1) TPA Sumur Batu, Bekasi so that the Ciasem river around the landfill overflowed and was heavily polluted, (2) TPA Bakung, Bandarlampung, landslides after four days of rain and dragged 5 workers, (3) TPA Cilowong, Serang landslide killed 2 people, and (4) TPA Pasir Sembung, Cianjur which occurred after rain, stemmed the Cibodas river and caused flooding. These accidents make the study related to the geotechnical (physical, mechanical and hydraulic) characteristics of the MSW is very important in relation to the drainage of water and the stability of a landfill. However, observing the geotechnical characteristics of waste is complex because it can change rapidly with the MSW degradation process [11]. As the MSW degradation process, physical characteristics, unit weight, and hydraulic conductivity of MSW changed [3]. For safety considerations, [12] in analyzing the relationship between relative water levels and minimum safety factors. For organic waste that has been degraded, increasing the moisture content can reduce the value of the friction angle and the safety factor of landfill [13]. The effect of precipitation depends on the hydraulic conductivity of the MSW, where the smaller of the hydraulic conductivity of the MSW, will be the greater of the precipitation effect on the safety factor [14]. [15] showed that MSW hydraulic conductivity is affected by voids ratios. Hydraulic conductivity of waste in landfill also determines the amount of leachate, closely related to the height and unit weight of the MSW [8]. According to [16], hydraulic conductivity decreases significantly with the reduced pressure and degradation, due to the density increasing and the finer fraction of MSW particles, resulting in lower MSW porosity. From the physical aspect, the unit weight of MSW is another key parameter that affects the stability and performance of landfills but has high uncertainty [17]. The reliability index in the estimation of safety factors decreases with the increasing of unit weight variation related to MSW height [18]. MSW unit weight can affect the shear strength of MSW, where shear strength decreases with ————————————————
• Febrian Hadinata, Civil Engineering and Planning Department, Faculty of Engineering, Sriwijaya University, Indonesia.
• Betty Susanti, Civil Engineering and Planning Department, Faculty of Engineering, Sriwijaya University, Indonesia.
• Muthia Soraya, Civil Engineering and Planning Department, Faculty of Engineering, Sriwijaya University, Indonesia.
2568 the unit weight decreasing of MSW with the same composition
[19]. The MSW unit weight value depends on the composition and operational of landfilling (compaction, soil placement and leachate management [17]. Grain size is one of the parameters that affect the unit weight of MSW. As an illustration, the value of specific gravity (Gs) increases with the decreasing of particle size, compaction, and the increasing age of waste, where Gs from MSW is linearly correlated with the level of decomposition [20]. Gs is unit weight divided by the unit weight of the same volume of water [21] in [22]. [14] suggests the study of hydraulic and geotechnical parameters from MSW for more reliable stability calculations. This underlines the importance of research related to the physical and hydraulic characteristics of waste, and the changes that occur due to the degradation process of organic waste. This research is an initial study that examines the changes in physical characteristics (unit weight and grain size distribution) and hydraulics (permeability) of artificial organic waste, which is made from leaf and garden waste. Organic waste was chosen as a sample because Indonesian waste is dominated by organic waste [1].
2
M
ETHODOLOGY2.1 Sample Preparation
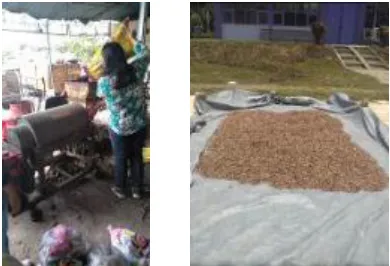
Organic waste samples were leaf litter taken directly from an area in Kalidoni Subdistrict, Palembang City. The waste sample is chopped (Figure 1) and filtered so that the sample has a maximum diameter of 1 cm. Then the chopped organic waste sample is spread and dried with solar heat (Figure 2).
2.2 Laboratory Test
After the drying process, a Standard Proctor Test [23] was carried out on organic waste samples so that optimum moisture content and maximum dry density were obtained (Figure 3). Because the test was carried out at optimum moisture content, the moisture content was maintained and kept unchanged. Moisture content was maintained by closing the reactor, storing the reactor in a closed room, and leachate was not allowed to come out. Samples were put into 13 reactors with a capacity of 30 liters (Figure 4), where each reactor would be opened, and samples were taken to be tested for grain size distribution and hydraulic conductivity. 13 Reactors would be opened, and samples would be tested on days 0, 5, 10, 15, 20, 25, 30, 35, 40, 45, 50, 55 and 60. Biological processes usually take quite a long time, ± 30 days [24], so that the testing time of up to 60 days was estimated to adequately describe the process of characteristics changing of fresh waste into degraded waste.
Fig. 1. The sample chopping. Fig. 2. The sample drying.
Fig. 3. Standard Proctor Test. Fig. 4. Sample boxes
(reactors).
Hydraulic conductivity was measured using a constant head permeameter [25], with diameter and height of the mold, 6.4 cm and 17 cm respectively (Figure 5). The constant head method was used because of the coarse rubbish. Samples of all time variants were inputted by the same method, i.e. put in as three layers, where each layer was pounded (with compactor) for 25 times. Unit weight was obtained from the dividing between the volume of waste that inputted to the permeameter mold and the volume of the mold itself. The homogeneity of the hydraulic conductivity test was maintained by applying the same procedure in each test. Due to the coarse waste sample grain, grain size distribution was only tested by sieve analysis [26], see Figure 6. Then the hydraulic conductivity value, unit weight of the sample in the permeameter mold and grain size distribution were recorded for each sample variant.
Fig. 5. Constant head permeameter. Fig.6. analysis.
3 R
ESULTS AND DISCUSSION3.1 Laboratory Test Results
3.1.1 Test Result of Standard Proctor Test
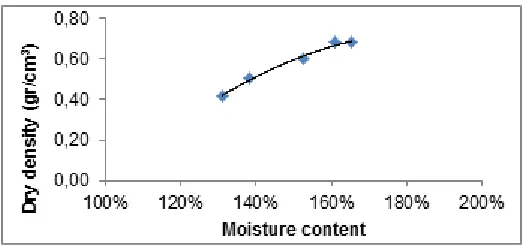
Compaction tests were carried out on dried chopped organic samples, based on the testing procedure as described in Chapter 2.2. The maximum density of the dry sample was 0.2613 tons/m3, with an optimum moisture content of 160.97%
(Figure 7). Next, the dry sample was added with water, so that the water level reaches the optimum water level, and then it was directly put into the 13 reactors (Figure 4). Moisture content was kept constant by closing the reactor and not letting the leachate out of the reactor.
2569 IJSTR©2019
Fig. 7. The compaction (standard Proctor) test results.
3.1.2 Permeability Test Result
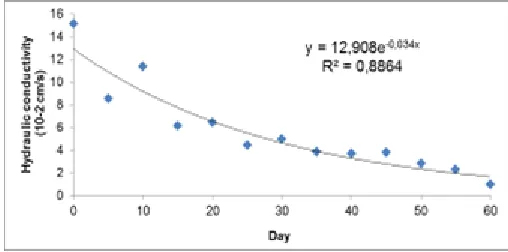
Permeability test was carried out using the constant head method [25]. All 13 samples were tested (at different times / days) at optimum moisture content, and compacted in 3 layers by a predetermined method (see Chapter 2.2). The permeability test results with the constant head method for all sample variants were given in Figure 8. The hydraulic conductivity of the sample varies from 1.5x10⁻¹ cm/s to 1x10⁻²
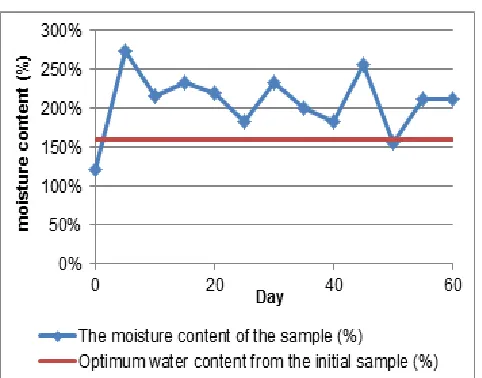
cm/s (Fig. 8). However, the moisture content of the sample being tested varies greatly, even though the initial mixture was made close to the optimum moisture content, but at the time of the test, the samples were often not in optimum conditions, but above the optimum. This may be caused by the process of waste degradation, where water (H2O) is one of the results of
the decomposition of organic matter waste, this was a record for further research, how the sample of organic waste that has been kept moisture content was constant (reactor in closed conditions and leachate water not allowed to flow out) have variations in moisture content when removed from the reactor on the test day. For the record, it was carried out triple (3 samples taken at different points), each time a moisture content test was carried out, so that the measured moisture
content value was assumed to be representative of all samples in the reactor (30-liter capacity).
TABLE 2
Hydraulic Conductivity of Organic Waste Sample
Day
Hydraulic conductivity (10-2 cm/detik)
Moisture content
(%)
Day
Hydraulic conductivity (10-2 cm/detik)
Moisture content
(%)
0 15.11 122% 35 3.89 200,00%
5 8.53 273% 40 3.72 183,33%
10 11.35 216% 45 3.83 255,56%
15 6.17 233% 50 2.86 155,56%
20 6.45 219% 55 2.33 211,11%
25 4.44 183% 60 1.00 211,11%
30 5.00 233%
3.1.3 Test Results of Sieve Analysis
For each time variant (reactor), 200 grams of sample were used for grain size distribution analysis. Samples were filtered with a No.04 sieve (the grain diameter passed less than 4.67 mm) to the No.200 sieve (the grain diameter passed less than 0.075 mm). Figure 2 shows the percentage of grain size from five sample variants that smaller than 0.075 mm (clay fraction).
3.1.4 The weight of the sample inputting to the permeameter mold
The weight of the sample that put into the permeameter mold was recorded to see the change of waste density that was tested at the permeameter. This was done because the same density control, for each variant of the sample, could not be done. So that the control carried out was to do the same test procedure (3 layers were added, and pounded 25 times). Table 3 shows the sample weight data that put into the permeameter mold. With a sample volume in the mold of 31.15 cm3 (diameter and height of the mold, respectively 6.4 cm, and 17 cm), then the change in the density of the sample in the mold could be known.
TABLE 2
Sieve Analysis Results
The weight of retained waste sample in the filter:
Day No. 4 No. 10 No. 20 No. 40 No. 60 No.100 No.200
Ø 4,76 mm Ø 2,00 mm Ø 0,85 mm Ø 0,425 mm Ø 0,25 mm Ø 0,15 mm Ø 0,075 mm
Day - 0 94 10 2 0 0 0 0
Day - 5 30 8 8 0,252 0 0 0
Day - 10 43,5 8,5 1,5 0 0 0 0
Day -15 36,5 27,5 4 2 0 0 0
Day - 20 18 17,5 3 0,5 1 0 0
Day - 25 17 19 3 0,5 0,5 0 0
Day - 30 16,5 19 3 1 0,5 0 0
Day - 35 11 22 5,5 1 0,5 0 0
Day - 40 11 20,5 6 1,5 1 0 0
Day - 45 16 14,5 6,5 1,5 1,5 0 0
Day - 50 15,5 15 6,5 2 1 0 0
Day - 55 13,5 14,5 9 2,5 0,5 0 0
2570
TABLE 3
The weight of the sample put into the permeameter mold
Day Sample weight put into the mould (gram) Day
Sample weight put into the mould (gram)
0 104 35 180
5 126 40 235
10 117 45 180
15 130 50 250
20 140 55 255
25 150 60 285
30 150
3.1 Changes in Physical and Hydraulic Characteristics of Organic Waste
3.2.1 Changes in hydraulic conductivity of organic waste Table 1 shows that the hydraulic conductivity of organic waste (leaves) is getting lower, starting from 1.5.10-1 cm/s on the first
day of testing to 1.10-2 cm/s (Figure 8). The high hydraulic
conductivity is correlated with a large enough waste diameter, so that many pores are contained in the waste material. These results are in accordance with the research of [27], [28, [29] who obtained the waste hydraulic conductivity range between 10-1 to 10-4 cm/s.
Fig. 8. Changes in the hydraulic coefficient of organic waste.
The high hydraulic conductivity of waste, which is linearly correlated with the amount of seepage, successfully confirms [4], which states that the effect of the flow of water out of the waste cell may be more dominant than the mechanical settlement of the waste itself. The decreasing of hydraulic conductivity of waste samples until the 60th day (Figure 8), makes this kind of research need to be continued until the
hydraulic conductivity of garbage reaches the lowest value. [11] also found that the hydraulic conductivity of MSW decreases with the increasing of fine components due to degradation. [30, with a borehole permeameter, found that for old waste in landfills, the hydraulic conductivity of waste can reach 10-5 to 10-6 cm / s. However, [30] carried out sampling in the field, where there are various types of waste, and may have been mixed with daily cover soil. This needs to be observed further, whether organic waste can achieve hydraulic conductivity as small as that number. However, in this study, the hydraulic conductivity value of old waste can be estimated based on a simple equation formed from the data, namely (Equation 1):
y = 12,908 e-0,034x (1)
where y is the estimated hydraulic conductivity value, in
(cm/s), and x is the day. However, this equation needs to be formed from the actual MSW sample (not just an organic waste) and requires further verification. Table 4 shows the comparison between the value of hydraulic conductivity from the estimation results and hydraulic conductivity from several observations in the field. This confirms that old waste has quite low hydraulic conductivity, between 10-5 to 10-6 cm/s (Jain et
al., 2006, [8]).
3.2.2 Changes in grain size distribution of organic waste Table 2 and Figure 9 show that the coarse grain components from the waste were getting less and less, starting from 94% held by filter No. 4 (grain diameter greater than 4.76 mm) on day 0, to only 13% were retained by filter No. 4 on 60th day. This answers why the hydraulic conductivity of organic waste decreases with time. Increasing the percentage of waste with finer diameters (due to the degradation process) makes waste more solid, and porosity decreases [16]. Nearly all of the waste was held by filter No. 4, but pass the filter 1 cm in diameter (in the sample preparation phase). This should be noted, that it is necessary to modify the filter analysis test in Soil Mechanics [26], which is by adding filters with a larger diameter. Observations with a longer number of days are also needed for further research.
TABLE 4
Hydraulic conductivity estimates & literature results
Hari Hydraulic conductivity (cm/s) Equation (1)
estimation
Field measuring
Qty Source
365 5,3.10-5 1,34.10-5 Thakur et al. (2019)
3.2.3 Changes in waste sample density
In addition to the reducing result of hydraulic conductivity from the waste sample, increasing the fine particles of the waste sample causes an increase in waste density. To observe this change in density, measurements were taken of the weight of the sample putting into the mold permeameter, where the treatment of the sample putting into the mold permeameter was the same (see Chapter 2.2). Figure 10 shows changes in waste density, both in bulk density and dry density, that put into the mold permeameter. The results are in accordance with the theory proposed by [16], [18] and [20]. Although the bulk density value rises quickly, this is not linear with an insignificant increase in dry density. This is due to the increase in moisture content in the waste sample caused by the waste degradation process (Figure 11). H2O is one of the results of
waste decomposition. This should be a concern in the analysis of landfill stability, due to differences in leachate (waste water) management patterns, resulting in changes in the geotechnical parameters of the waste itself.
2571 IJSTR©2019
Fig. 10. Changes in organic waste density entering the
permeameter.
Fig. 11. Changes in sample waste moisture content.
4 C
ONCLUSIONSAlong with the degradation process, the characteristics of organic waste, which are dominant in Indonesia, change in a fast time. The hydraulic conductivity value of organic waste decreases with the degradation process. In contrast, bulk density rises rapidly, but dry density does not show a significant increase. This is due to rising water levels that may be caused by the result of the degradation process, this phenomenon needs to be further observed. The increasing of waste density and decreasing the hydraulic conductivity of the waste sample are linearly correlated with the change of coarse particles from organic waste into finer particles. For the sake of landfill stability analysis, this research must be continued with geotechnical parameters and more of waste composition and longer observation time.
A
CKNOWLEDGMENTThe author wishes to thank the Ministry of Research and Technology of the Republic of Indonesia (Kemenristekdikti) and the Institute of Research and Community Services at the
University of Sriwijaya (LPPM UNSRI), where this paper is one of the results of the 2019 National Competitive Grant Research Program from the Ministry of Research, Technology through the LPPM UNSRI.
R
EFERENCES[1] Damanhuri E. and Tri Padmi, Pengelolaan Sampah Terpadu, Bandung: ITB Press, 2016.
[2] Wahyono S., "Mitigasi Bencana Longsor Sampah, Analisis Penyebab Dan Upaya Pencegahannya", Jurnal Sains Dan Teknologi Mitigasi Bencana, vol. 9, no. 2, pp. 6-18, Des 2014.
[3] Yang R., Z. Xu, and J. Chai, ―A Review of Characteristics of Landfilled Municipal Solid Waste in Several Countries: Physical Composition, Unit Weight, and Permeability Coefficient‖, Pol. J. Environ. Stud., vol. 27, no.6, pp. 2425-2435, 2018.
[4] Hadinata F., E. Damanhuri, and B. Rahardyan, "Preliminary Study of The Compressibility of Municipal Solid Waste in Indonesian Landfill", International Journal of GEOMATE, vol. 13, no.39, pp. 191-197, Nov 2017.
[5] Hadinata F., E. Damanhuri, B. Rahardyan and I M. W. Widyarsana, ―Identification Of Initial Settlement Of Municipal Solid Waste Layers In Indonesian Landfill‖, Waste Management & Research, vol. 36, no. 8, pp. 737-743, 2018.
[6] Blight, G, ―Slope Failures in Municipal Solid Waste Dumps and Landfills: A Review‖, Waste Manage. Res. 26:448–463, doi:10.1177/0734242X07087975, 2008.
[7] Koerner R.M. and T.Y. Soong, ―Stability Assessment of Ten Large Landfill Failures‖, In: Advances in Transportation and Geoenvironmental Systems Using Geosynthetics, GeoDenver 2000 Congress, pp. 1–38, Geotechnical Special Publication: Denver, Colorado, August 2000.
[8] Yang R., Z. Xu, J. Chai, Y. Qin and Y. Li, ―Permeability Test and Slope Stability Analysis of Municipal Solid Waste in Jiangcungou Landfill, Shaanxi, China‖, Journal of the Air & Waste Management Association, vol. 66, no. 7, pp. 655–662, 2016.
[9] Merry, S. M., E. Kavazanjian, and W. U. Fritz, ―Reconnaissance of the July 10, 2000, Payatas Landfill Failure‖, J. Perform. Constr. Fac. 19:100–107, doi:10.1061/(ASCE)0887-3828(2005)19:2(100), 2005. [10]Kolsch F., K. Fricke, C. Mahler and E. Damanhuri,
―Stability of Landfills – the Bandung Dumpsite Disaster. Proc. Sardinia 2005, Tenth International Waste Management and Landfill Symposium, Cagliari, Italy, 2005.
[11]Thakur D., R. Ganguly, and A. Gupta, ‖ Geotechnical Properties of Fresh and Degraded MSW in the Foothill of Shivalik Range Una, Himachal Pradesh‖, International Journal of Recent Technology and Engineering (IJRTE), vol. 8, no. 2, pp. 363-374, July 2019
2572 and Specific Composition of Indonesia‖, Proc.
International Conference on Waste Management & Environment 2015: Paradigm Transformation in Waste Management towards a Greener Environment, University of Malaya, pp. 97-108, Agustus 2015. [14]Albert G. and K. B. Faur, ―Effect of Precipitation on
the Slope Stability of Landfills‖, Geosciences and Engineering, vol. 3, no. 5, pp 155-163, 2014.
[15]Reddy K. R., H. Hettiarachchi, N. Parakalla, J. Gangathulasi, J. Bogner and T. Lagier, ―Hydraulic Conductivity of MSW in Landfills‖, J. Environ. Eng. 135: 677–683, doi:10.1061/(ASCE)EE.1943-7870.0000031, 2009.
[16]Zeng G., L. Liu, Q. Xue, Y. Wan, J. Ma and Y. Zhaoa, ‖ Experimental Study of the Porosity and Permeability of Municipal Solid Waste‖, Environmental Progress & Sustainable Energy, DOI: 10.1002/ep.12632, April 2017.
[17]Zekkos D., J. D. Bray, E. Kavazanjian Jr., N. Matasovic, E. M. Rathje, M. F. Riemer, and K. H. Stokoe, ―Unit Weight of Municipal Solid Waste‖, J. Geotech. Geoenvironm. Eng, 132:1250–1261. doi:10.1061/(ASCE)1090-0241(2006)132:10 (1250), 2006.
[18]Datta S. and G. L. S. Babu, ―Prediction of the Slope Stability of Municipal Solid Waste Landfills Using the Reliability Analysis‖, Proc. Conference: Geo-Chicago
2016, Chicago, IL, USA, DOI:
10.1061/9780784480144.066, August 2016.
[19]Zekkos D., G. A. Athanasopoulos, J. D. Bray, Jr., E. Kavazanjian, N. Matasovic, E. M. Rathje, M. F. Riemer, and K.H. Stokoe, ―Large-scale Direct Shear Testing of Municipal Solid Waste‖, Waste Manage. 30:1544–1555, doi:10.1016/j.wasman.2010.01.024, 2010.
[20]Yesiller, N., J. L. Hanson, J. T. Cox, and D. E. Noce, ―Determination of Specific Gravity of Municipal Solid Waste‖, Waste Management, vol. 34, no. 5, pp. 848-858, May 2014.
[21]Lambe, T. W. and R. V. Whitman, Soil Mechanics, John Wiley & Sons, New York, 1969.
[22]Castro R. L., K. Basaure, S. Palma, and J. Vallejos, ―Geotechnical Characterization of Orerelated to Mudrushes in Block Caving Mining‖, Journal of the Southern African Institute of Mining and Metallurgy, vol. 117, no. 3, pp. 275-284, Mar 2017.
[23]ASTM D698: Standard Test Methods for Laboratory Compaction Characteristics of Soil Using Standard Effort.
[24]Wiharyanto O., H. Mochtar, B. P. Ika, and P. Purwono, ―Decomposition of Food Waste Using Bulking Agent and Bio-drying Technology‖, E3S Web Conf. Vol. 73., Proc. The 3rd International Conference on Energy, Environmental and Information System (ICENIS 2018), Semarang, August 14th – 15th, 2018. [25]ASTM D 2434 : 1968, Test Method for Permeability
Of Granular Soils.
[26]ASTM D6913 / D6913M-17: Standard Test Methods for Particle-Size Distribution (Gradation) of Soils Using Sieve Analysis.
[27]Koerner, R. M. and W.A. Eith. ―Drainage Capability of Fully Degraded MSW With Respect to Various Leachate Collection and Removal Systems‖,
Geotech. Sp. 130:4233–4237,
doi:10.1061/40782(161)46, 2005.
[28]Hossain, M. S., K. K. Penmethsa, and L. Hoyos, ―Permeability of Municipal Solid Waste in Bioreactor Landfillwith Degradation‖, Geotech. Geol. Eng. 27:43– .2009, doi:10.1007/s10706-008-9210-7.