2293
Perception And Attitudes Toward Science:
Condition Of Students In Learning Natural
Sciences In Indonesia
Dwi Agus Kurniawan, Astalini, Darmaji, Yolanda Eka Putri, Nurdatul Jannah, Tari Okta Puspitasari
Abstract:The purpose of this study is to determine the relationship between student perceptions and student attitudes towards natural science. The perceptions of the students studied were reviewed through three indicators, namely observation, understanding, and assessment of science teachers, materials and media. The attitude of the students studied was reviewed through three indicators, namely the social implications of science, the adoption of scientific attitudes, and the interest in increasing science learning time. The research uses associative quantitative research. The instruments in this study were in the form of student perceptions of questionnaires on science subjects and student attitude questionnaires on science subjects. The data analysis technique uses descriptive statistics and inferential statistics. The results of the study stated that students' perceptions of natural science belong to the good category. The attitude of students towards natural science is included in the good category. The relationship between students 'perceptions and students' attitudes towards natural science showed a significant positive correlation.
Index Terms: Perceptions; Attitudes toward Science; Students.
—————————— ——————————
1.
INTRODUCTION
ducation is an activity that has the purpose of preparing students to be people who have a positive contribution to the community [1]; [2]. Indonesia has several levels of education, namely elementary school, junior high school, high school, and college. Every level of education has different levels of difficulty. At the junior high school level, students are expected to be able to use thinking skills to solve problems in everyday life, one of them is in Science / Science. Junior High School Curriculum focuses on students in studying events in everyday life so as to provide students with direct experience [3]. Through science has actually provided provisions for solving the problems of everyday life, given that science is a science that seeks answers to questions of what, why, and how symptoms of nature relating to the composition of structure and nature, changes and dynamics of nature. Essentially science lessons are products, processes, attitudes and technology. Attitude is a reaction to a situation or object that is positive or negative. Whereas according to [4]; [5]; [6] attitudes are defined as individual beliefs and feelings towards an object. The above opinion states that attitude is an important component that must be possessed by students in natural science subjects. According to [7]; [8] Attitudes toward science are considered important because they can affect the performance of students and can improve student learning achievement. The importance of attitudes in natural science learning can be seen in the actions of students who show positive attitudes and negative attitudes. [9]; [10] there are two perceptions or attitudes of students to natural science is a positive attitude and negative nature in which both attitudes greatly affect the success of a student in learning science. A positive attitude is indicated by students tend to be more diligent in learning so that they get satisfying results, whereas a negative attitude is characterized by students being less diligent in learning so that they get unsatisfactory results [11]; [12]. It causes students to have a negative attitude towards science so do not like science lessons [13][14], "If students have negative attitudes towards science, they also do not like science courses and science teachers. The attitudes of students towards Natural Sciences measured in this study are represented by three indicators adopted from TOSRA [15][16] social implications of science, 2) adoption of scientific
2294
The findings in this study are expected to contribute to improving students' perceptions of science subjects and student attitudes towards natural science.
2
METHODOLOGY
2.1 Research Design
This study uses a type of associative quantitative research. The research design is using correlational design. In correlational research designs, investigators use the correlation statistical test to describe and measure the degree of association (or relationship) between two or more variables or sets of scores [20]. The purpose of the research is to find out the relationship between students 'perceptions and students' attitudes towards science subjects.
2.2 Research Sample
The population of this study were all students at Muaro Jambi 5 Public High School, Muaro Jambi 6 Public Middle School, and Muaro Jambi 26 Public High School totaling 1292 students. The number of research samples was determined using the techniques of Isaac and Michael, while the sampling of the study was determined using a simple random sampling technique. According to [21] ―In simple random sampling, each member of the population under study has an equl chance of being selected and the method involves selecting at random from a list of the population (a sampling frame) the required number of subjects for the sample‖. The sample used in this study was 784 students consisting of 261 students of Muaro Jambi Middle School 5, 261 students of Muaro Jambi 6th Middle School, and 262 students of Muaro Jambi Public Middle School 26.
2.3 Research Sample
The instrument of this research was a questionnaire. This questionnaire is in the form of student perception questionnaires for natural science and student attitude questionnaires for natural science. Questionnaire of student perceptions of natural science has 3 indicators which contain 22 items of statements. Questionnaire of perception using Likert scale measurement. Assessment of the Likert scale is Always (A), Often (O), Sometimes (S), Rarely (R), and Never (N). For statements that are positive (+) the measurement starts from the values 1, 2, 3, 4, and 5 on the Always scale (SL). Whereas for statements that are negative (-) the measurement starts from the value of 5,4,3,2,1 on the scale Never (TP).
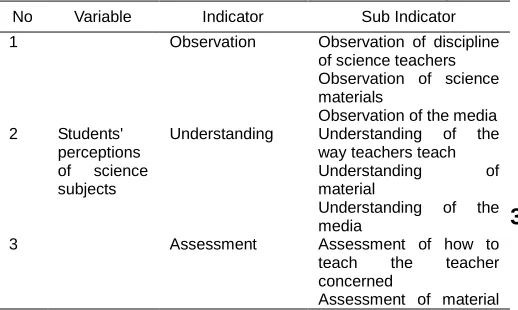
Table 1. Questionnaire Indicator for Student Perception
No Variable Indicator Sub Indicator 1
Students' perceptions of science subjects
Observation Observation of discipline of science teachers Observation of science materials
Observation of the media 2 Understanding Understanding of the
way teachers teach Understanding of material
Understanding of the media
3 Assessment Assessment of how to teach the teacher concerned
Assessment of material
provided
Evaluation of the media Assessment of facilities
Questionnaire for student attitudes towards natural science has 3 indicators which contain 18 statements. Questionnaire of attitude using Likert scale measurement. Assessment of the Likert scale is Strongly Agree (SA), Agree (A), Neutral (N), Disagree (D), and Strongly Disagree (SD). For statements that are positive (+) the measurement starts from the values 1, 2, 3, 4, and 5 on the Always scale (SL). Whereas for statements that are negative (-) the measurement starts from the value of 5,4,3,2,1 on the scale Never (TP).
Table 2. Questionnaire Indicator for Attitudes toward Natural Science
No Variable Indicator
1 Attitudes towards natural science
Social implications of science
Adoption of scientific attitudes
Interest increases the learning time of science
2.4 Data Analysis
To determine the perceptions of students in the good category or not, a grouping of categories is used using a range of scores. The score range is influenced by the scale used and the number of statements. The following is a category of student perceptions of natural science:
Table 3. Categories of Student Perception of Natural Sciences
Range
Category Indicator 1 Indicator 2 Indicator 3
9 sd 16,2 6 sd 10,8 7 sd 12,6 Very bad 16,3 sd 23,4 10,9 sd 15,6 12,7 sd 18,2 Bad 23,5 sd 30,6 15,7 sd 20,4 18,3 sd 23,8 Pretty good 30,7 sd 37,8 20,5 sd 25,2 23,9 sd 29,4 Good
37,9 sd 45 25,3 sd 30 29,5 sd 35 Very good
To determine the attitude of students in the good category or not, then grouping categories is done using a range of scores. The score range is influenced by the scale used and the number of statements. The following is the category of student attitudes towards natural science:
Table 4. Student Attitude Categories of Natural Sciences
Range
Category Indicator 1 Indicator 2 Indicator 3
5 sd 9 6 sd 10,8 7 sd 12,6 Very bad 10 sd 13 10,9 sd 15,6 12,7 sd 18,2 Bad 14 sd 17 15,7 sd 20,4 18,3 sd 23,8 Pretty good 18 sd 21 20,5 sd 25,2 23,9 sd 29,4 Good 22 sd 25 25,3 sd 30 29,5 sd 35 Very good
Data analysis in this research using inferential statistics consisting of mean, median and product moment correlation test.
3 3
RESULTS
AND
DISCUSSION
2295
towards natural science.
a. Student Perception of Natural Science
Students' perceptions of natural science consist of three perceptual indicators, namely observation, understanding, and assessment.
1. Observation of the Discipline of Science Teachers, Science and Media Materials
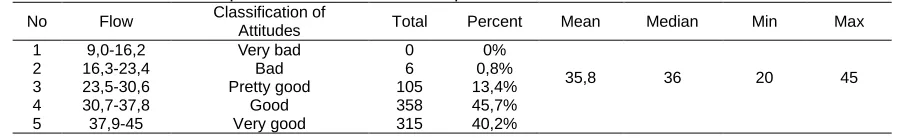
Observation indicators have sub-indicators of observation on the discipline of science teachers, observations of science materials, and observations of the media. The results of descriptive statistical analysis of observational indicators can be seen in table 5.
Table 5. Observational Descriptive Statistics on the Discipline of Science Teachers, Science and Media Materials
No Flow Classification of
Attitudes Total Percent Mean Median Min Max
1 9,0-16,2 Very bad 0 0%
35,8 36 20 45
2 16,3-23,4 Bad 6 0,8%
3 23,5-30,6 Pretty good 105 13,4%
4 30,7-37,8 Good 358 45,7%
5 37,9-45 Very good 315 40,2%
Based on the above table as many as 0 students categorized as very bad with a percentage of 0%, 6 students categorized as not good with a percentage of 0.8%, 105 students categorized quite well with a percentage of 13.4%, 358 students categorized well with a percentage of 45.7%, and 315 students were categorized very well with a percentage of 40.2%. So it can be concluded that students tend to have good perceptions of the observation indicators with sub-indicators of observation on the discipline of science teachers, science and media material.
2. Understanding of the way teachers teach, material and media
Understanding indicators have sub indicators of understanding of the way teachers teach, understanding of the material, and understanding of the media. The results of descriptive statistical analysis of understanding indicators can be seen in table 6.
Table 6. Descriptive Statistics Understanding of How Teachers Teach, Materials and Media
No Flow Classification of
Attitudes Total Percent Mean Median Min Max
1 6-10,8 Very bad 0 0%
23,49 24 13 30
2 10,9-15,6 Bad 8 1%
3 15,7-20,4 Pretty good 157 20%
4 20,5-25,2 Good 379 48,3%
5 25,3-30 Very good 240 30,6%
Based on the above table as many as 0 students categorized as very bad with a percentage of 0%, 8 students categorized as not good with a percentage of 1%, 157 students categorized quite well with a percentage of 20%, 379 students categorized well with a percentage of 48.3%, and 240 students categorized very good with a percentage of 30.6%. So it can be concluded that students tend to have good perceptions of indicators of understanding.
3. Assessment of How to Teach Science Teachers, Materials, Media and Facilities
Assessment indicators have sub indicators of assessment of how to teach science teachers, assessment of material provided, assessment of media, and assessment of facilities. The results of the descriptive statistical analysis of the assessment indicators can be seen in table 7.
Table 7. Descriptive Statistics Assessment of How to Teach Science Teachers, Material, Media and Facilities
No Flow Classification of
Attitudes Total Percent Mean Median Min Max
1 7-12,6 Very bad 1 0,1%
26,88 27 10 35
2 12,7-18,2 Bad 11 1,4%
3 18,3-23,8 Pretty good 156 19,9%
4 23,9-29,4 Good 416 53,1%
5 29,5-35 Very good 200 25,5%
Based on the above table as many as 1 student categorized as very bad with a percentage of 0.1%, 11 students categorized as not good with a percentage of 1.4%, 156 students categorized quite well with a percentage of 19.9%, 416 students categorized well with a percentage of 53.1 %, and 200 students categorized very well with a percentage of 25.5%. So it can be concluded that students tend to have good perceptions of the assessment indicators.
b. Students' Attitudes towards Natural Science
The attitude of students towards natural science consists of three indicators namely the social implications of natural
science, adoption of scientific attitudes, and interest increases science learning time.
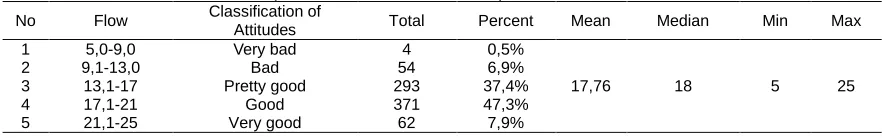
1. Social Implications of Science
2296
Table 8. Descriptive Statistics of Social Implications of Science
No Flow Classification of
Attitudes Total Percent Mean Median Min Max
1 5,0-9,0 Very bad 4 0,5%
17,76 18 5 25
2 9,1-13,0 Bad 54 6,9%
3 13,1-17 Pretty good 293 37,4%
4 17,1-21 Good 371 47,3%
5 21,1-25 Very good 62 7,9%
Based on the above table as many as 4 students categorized as very bad with a percentage of 0.5%, 54 students categorized as not good with a percentage of 6.9%, 293 students categorized quite well with a percentage of 37.4%, 371 students categorized well with a percentage of 47.3 %, and 62 students categorized very well with a percentage of 7.9%. So it can be concluded that students tend to have a good attitude on indicators of social implications of science. 1. Adoption of Scientific Attitudes
Indicators of adoption of scientific attitudes are students willing to accept new thoughts or not in accordance with their previous thoughts. This indicator can also be interpreted as students like to use new methods of conducting investigations in the field of science. The results of descriptive statistical analysis of indicators of adoption of scientific attitudes can be seen in table 9.
Table 9. Adoption Descriptive Statistics of Scientific Attitudes
No Flow Classification of
Attitudes Total Percent Mean Median Min Max
1 6,0-10,8 Very bad 0 0%
21,69 22 11 30
2 10,9-15,6 Bad 21 2,7%
3 15,7-20,4 Pretty good 254 32,4%
4 20,5-25,2 Good 445 56,8%
5 25,3-30 Very good 64 8,2%
Based on the table above as many as 0 students categorized as very bad with a percentage of 0%, 21 students categorized as not good with a percentage of 2.7%, 254 students categorized quite well with a percentage of 32.4%, 445 students categorized well with a percentage of 56.8% and 64 students were categorized very well with a percentage of 8.2%. So it can be concluded that students tend to have a good attitude on the indicator of adoption of scientific attitudes.
2. Interest Increases Science Learning Time Indicators of interest in increasing learning time Science can be measured by looking at students' interest in the world of science with attitudes that like reading about science, experimenting to spending time in the laboratory. The results of the descriptive statistical analysis of indicators of interest in increasing science learning time can be seen in table 10.
Table 10. Descriptive Statistics of Interest Increases Science Learning Time
No Flow Classification of Attitudes Total Percent Mean Median Min Max
1 7,0-12,6 Very bad 1 0,1%
25,27 25 9 35
2 12,7-18,2 Bad 40 5,1%
3 18,3-23,8 Pretty good 210 26,8%
4 23,9-29,4 Good 420 53,6%
5 29,5-35 Very good 113 14,4%
Based on the above table as many as 1 student categorized as very bad with a percentage of 0.1%, 40 students categorized as not good with a percentage of 5.1%, 210 students categorized quite well with a percentage of 26.8%, 420 students categorized well with a percentage of 53.6 %, and 113 students are categorized very well with a percentage of 14.4%. So it can be concluded that students tend to have a good attitude on the indicators of interest in increasing the time to study science.
3. Assumption Test
Assumption test is used to see whether the data is normally distributed or not, and to test data linearity. There are 2 test assumptions carried out in this study, namely:
1. Normality Test
Data normality test uses the Kolmogorov-Smirnov test to find out whether the data analyzed is normally distributed or not. The following are the results of the normality test for the perception variables:
Table 11. Results of Analysis of Perception Variable Normality Test
Test of Normality
Class Sig. Data Description
7 0,192 Normal
8 0,399 Normal
9 0,334 Normal
Based on the results of the normality test the data proved that the perception data were normally distributed. The following are the results of the normality test for the attitude variable:
Table 12. Results of Analysis of Perception Variable Normality Test
Test of Normality
2297
Based on the results of the normality test the data proved that the attitudes data were normally distributed.
2. Linearity Test
Data linearity test using linear regression test to find out the analyzed data is linear or not. The following are the results of the data linearity test:
Table 13. Results of Analysis Linearity Test
Test of Linearity
Class Sig. Data Description
7 0,000 Linear
8 0,000 Linear
9 0,000 Linear
4. Correlation Test
The purpose of this study is to find out the relationship between student perceptions and student attitudes towards natural science. Relationship analysis uses product moment correlation. The following are the results of the correlation test of students' perceptions and attitudes variables.
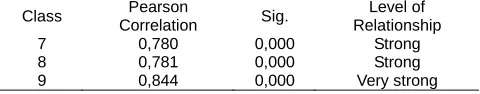
Table 14. Results of Correlation Analysis of Perception and Variable Attitudes to Use Pearson Product Moment Test
Class Pearson
Correlation Sig.
Level of Relationship
7 0,780 0,000 Strong
8 0,781 0,000 Strong
9 0,844 0,000 Very strong
The results showed that students' attitudes towards science subjects with the perception of students in grade 7 had a significance value of 0,000 (Sig. <0.05) with a correlation coefficient of 0.780. In grade 8 had a significance value of 0,000 (Sig. <0.05) with a correlation coefficient of 0.781. In grade 9 had a significance value of 0,000 (Sig. <0.05) with a correlation coefficient of 0.844. Based on the hypothesis test of students 'perceptions of students' attitudes toward science subjects that the two variables have a significant positive relationship and are classified into strong relationships, meaning Ha is accepted and Ho is patterned, meaning that the better the students 'perceptions of science subjects the better the students' attitudes toward science subjects. Attitudes are judgments or reactions to objects, people or other aspects which include likes and dislikes and are pleasant or unpleasant. Attitude is defined as an enduring positive or negative feeling about some person, object, or issue (affective domain) [22]. In the learning process, that attitude functions as "dynamic forces", namely the power to move people to learn. Attitude can be defined as the tendency to give learned, consistent, positive or negative reaction to an object [23]; [24]; [25]. Objects can be people, goods, objects and so forth. Students' attitudes towards science include love or dislike of science and use science as something boring or not boring. Perceptions formed by students can be either positive or negative perceptions. Students who have positive perceptions tend to accept the object they are capturing according to their personality, while students who tend to reject the object they are capturing for their personality are students who have negative perceptions. So it can be concluded that students who have a positive perception of science subjects are those students who receive or like science subjects. While students who have negative perceptions of science are students who reject or do not like science subjects. Based on the research findings, it can be concluded that students' perceptions of natural science for indicators of observations on the way
teachers teach, the material provided, media and facilities are in the good category. For indicators of understanding the way teachers teach, the material provided, media and facilities are in the good category. As well as indicators of the way teachers teach, the material provided, media and facilities are in the good category. So it can be concluded that students' perceptions of natural science are good. Students' attitudes towards natural science are tested based on three indicators. Based on the results of the research findings, it can be concluded that students' attitudes towards natural science for indicators of social implications of natural science are in the good category. For indicators of adoption of scientific attitudes in the good category. And for indicators of interest in increasing the time to study natural science are in the good category. So it can be concluded that students' attitudes towards natural science are good. That perceptions affect student characteristics. Human perception relates to the environment. The relationship is through the senses that are owned, namely the senses of sight, hearing, touch, feeling, and kissing. The subject of natural science aims to make students able to understand the concepts of science, have the skills to use scientific methods, encourage students to be more critical and creative in using simple technology in solving problems they face. In this study, it can be concluded that students are happy with science lessons. Students assume that science lessons are interesting and fun lessons. The condition of students in general in junior high school is in line with expectations, this is caused by: (1) relevant learning methods; (2) the media used is more varied; (3) teachers in teaching science use the environment. One effort to make students happy and enthusiastic in learning science is that the teacher embodies active, creative, effective and enjoyable learning. One effort that can be done by the teacher is to use the right and appropriate learning model to achieve the learning objectives. Teachers need to adopt existing learning models, or create their own. In addition to using the right learning model, teachers also need to use varied learning media.
4
CONCLUSION
2298
5
REFERENCES
[1]. Nurohman, S. (2008). Improving Thinking Skills Through Constructivistic Science Learning In Sekolah Alam. Jurnal Penelitian Dan Evaluasi Pendidikan, 128-144.
[2]. Asrial Asrial, Syahrial Syahrial, Dwi Agus Kurniawan, May Subandiyo, Nur Amalina. (2019). Exploring obstacles in language learning among prospective primary school teacher. International Journal of Evaluation and Research in Education (IJERE). Vol. 8, No. 2, June 2019, pp. 249~254
[3]. Welch, A. G. ―Using the TOSRA to Assess High School Students’ Attitudes toward Science after Competing In the FIRST Robotics Competition: An Exploratory Stud.‖ Eurasia Journal of Mathematics, Science & Technology Education, 2010: 187-197.
[4]. Kind, M. P., Jones, K., & Bamby, P. (2007). Developing attitudes towards science measures . International Journal Of Science education, 1-4.
[5]. Andriani, V.S, (2016). "The Effectiveness of Inquiry Learning Method to Enhance Students’ Learning Outcome: A Theoritical and Empirical Review,' J. Educ. Pract., vol. 5,
[6]. Hariyadi, B., & Kurniawan, A. D. (2018). Deceiving the Queen: Integrating Jambinese Traditional Honey Gathering into Science Learning. BIODIK, 4(2), 60-76. [7]. Usta, Erdoğan, dan Çiğdem Akkanat. ―Investigating
Scientific Creativity Level of Seventh Grade Students.‖ Social and Behavioral Sciences, p: 1408 – 1415.
[8]. Liaghatdar, M. J., Soltani, A., & Abedi, A. (2011). A Validity Study of Attitudes Toward Science Among Iranian Secondary School Students. International Education Studied.
[9]. Zanaton, Iksan, 2006. Attitudes toward Science in Science Students in Middle Rank and Matriculation. Pertanika J.Soc & Hum. 14(2). Hal: 136.
[10].Sofiani, D, A S Maulida, N Fadhilah, dan D Y Sihite. (2017). ―gender Differences in Students' Attitude Toward Science.‖ International Conference on Mathematic and Science Education. IOP Publishing, p. 895.
[11].Rijal, S & Bachtiar, S. (2015). Relationship between Attitudes, Learning Independence, and Learning Styles with Student Cognitive Learning Outcomes. Jurnal Bioedukatika, 3(2).
[12].Sethi, Urmil. (2015). ―Study Of Attitude Of The Students Towards Science In Relation To Certain Non-School Factors.‖ International Journal of Education and Information Studies, p. 75-80.
[13].Olusola, Olasimbo O. & Rotimi, C.O, 2012. Attitudes of Students towards the study of Physics in College of Education Ikere Ekiti, Ekiti State, Nigeria. American International Journal of Contemporary Research, 2(12):86.
[14].Pringle, Rose M, Jennife Mesa, dan Lynda Hayes. (2017). ―ProfesProfessional Development for Middle School Science Teachers: Does an Educative Curriculum Make a Difference?‖ Journal of Science Teacher Education, p. 57-72.
[15].Fraser, B. J. (1981). Tosra: Test Of Science-Related Attitude: Handbook. Australian Council for Educational Research.
[16].Narmadha, U, dan Dr. S Chamundeswari. (2013) ―Attitude Toward Learning of Science and Academic Achievement in Science among Students at the
Secondary Level.‖ Journal of Sociological Research, p. 114-124.
[17].Maharaj-Sharma, Rawatee, dan Aditi Sharma. ―Using ICT Secondary School Science Teaching - What Students and Teachers in Trinidad and Tobago Say?‖ European Journal of Education Studies, 2017: 2501-1111.
[18].Jebson, Sofeme Reuben, dan Amos Zamni Hena. (2016). ―Student's Attitude Toward Science Subject In Senior Secondary.‖ IMPACT: International Journal of Research in Applied, Natural and Social Sciences (IMPACT: IJRANSS), p. 117-124
[19].Manasia, Loredana. (2015). ―Enjoyment of learning in upper secondary education. An exploratory research.‖ Social and Behavioral Sciences 1, p. 639-646.
[20].Kumari, Souda Nalina, dan K Saraladevi. (2014). ―Gender Differences in Attitude towards Science Teaching and Learning Styles among Adolescents.‖ International Journal of Science and Research (IJSR), p. 50-58. [21].Creswell, J. W. (2012). Educational Research: Planning,
Conducting and Evaluating Quantitative and Qualitative Research-4th Edition. Boston: Edwards Brothers, Inc. [22].Cohen, L., Manion, L., & Morrison, K. (2005). Research
Methods in Education-5th Edition. New York: RoutledgeFalmer.
[23].Newhouse, Nancy .1990. Implications of Attitude and Behavior Research for Environmental Conservation.The Journal of Environmental Education Vol. 22, No. 1: 26-32 [24].Fishbein, M., & Ajzen, I. (1975). Belief, attitude, intention
and behavior: An introduction to theory and research. [25].Joyce, Beverly A, dan Stephen J Farenga. (2010).