Open Access Journal of Sports Medicine
Dove
press
O R I G I N A L R E S E A R C H
open access to scientific and medical research
Open Access Full Text Article
Age- and sex-related differences in the
anthropometry and neuromuscular fitness of
competitive taekwondo athletes
Pantelis Theodoros
Nikolaidis1
Krzysztof Buśko2
Filipe Manuel Clemente3
Ioannis Tasiopoulos1
Beat Knechtle4
1Exercise Physiology Laboratory,
Nikaia, Greece; 2Department of
Biomechanics, Institute of Sport-National Research Institute, Warsaw, Poland; 3School of Sport and Leisure,
Polytechnic Institute of Viana do Castelo, Melgaço, Portugal; 4Institute
of Primary Care, University of Zurich, Zurich, Switzerland
Abstract: Anthropometry and neuromuscular fitness have been shown to relate with taekwondo
(TKD) performance; however, little information is available on the variation of these fitness components by sex and age in athletes practicing this sport. The aim of the present study was to examine the anthropometry and neuromuscular fitness of TKD athletes by sex and age. A total of 393 athletes (7–48 years old), separated into six age groups (7–9, 10–11, 12–13, 14–17, 18–32, and 33+), were examined for anthropometry and performed a series of neuromuscular fitness tests (flexibility, agility, muscle power, and isometric strength). An age × sex interaction on body mass, body height, and body fat percentage (BF, p≤0.003, η2≥0.045), but not on body mass index (p=0.172, η2=0.020), was shown, where a larger increase in body mass and body height from 12–13 to 14–17 groups was observed in males than in females, and the sex differ-ence in BF increased from 12–13 to 14–17 age group. An age × sex interaction on sit-and-reach (SAR) test, mean power output in the Bosco test, and Abalakov jump (p≤0.038, η2≥0.031) was observed with larger differences between 12–13 and 18–32 groups in males than in females. In SAR, it was remarkable that the male athletes achieved similar scores as female athletes in the 18–32 group. An age × sex group interaction on measures of isometric muscle strength (right and left handgrip, trunk, and legs) was also shown (p≤0.002, η2≥0.068), where larger differ-ences in male than female athletes were observed between the 12–13 and 14–17 groups. From a practical perspective, coaches can use these findings as reference for the evaluation of their athletes. Because the anthropometric characteristics and neuromuscular fitness varied by sex (i.e., highest scores in males, except flexibility) and age (i.e., highest scores in the 18–32 age group) with unique sport-specific patterns in TKD athletes, these findings would be important for the development of specific training programs.
Keywords: agility, flexibility, isometric muscle strength, jumping ability, sit-and-reach test
Introduction
Taekwondo (TKD) is a very popular sport of Korean origin practiced in >180 coun-tries worldwide1 and an official Olympic sport event since the Sydney 2000 games.2
Performance in TKD is related to technical and certain physical fitness components.3
Among the physical fitness components, anthropometry and neuromuscular fitness have been identified as important determinants of performance4–6 and are evaluated
routinely.7 Among the anthropometric characteristics, body height, body mass, body
mass index (BMI), and body fat percentage (BF) have been shown to relate with sport performance.8,9 For instance, in a comparison between winners and nonwinners in the
Sydney 2000 Olympic Games, a younger age and lower BMI were observed in the win-ners.9 Also, a trend for taller body height and less BF was highlighted in elite female Correspondence: Pantelis Theodoros
Nikolaidis
Exercise Physiology Laboratory, Thermopylon 7, Nikaia 18450, Greece Tel +30 210 69 7782 0298
Fax +30 210 490 7557 Email pademil@hotmail.com
Journal name: Open Access Journal of Sports Medicine Article Designation: ORIGINAL RESEARCH Year: 2016
Volume: 7
Running head verso: Nikolaidis et al
Running head recto: Neuromuscular fitness in taekwondo DOI: http://dx.doi.org/10.2147/OAJSM.S120344
Open Access Journal of Sports Medicine downloaded from https://www.dovepress.com/ by 118.70.13.36 on 26-Aug-2020
For personal use only.
This article was published in the following Dove Press journal: Open Access Journal of Sports Medicine
7 December 2016
Dovepress
Nikolaidis et al
athletes compared with nonelite ones.8 Elite female athletes
had better performance in Abalakov jump (AJ), mean power in continuous jumping test, and agility than their nonelite counterparts.8 Moreover, the ability to tax the alactic and
lactic energy transfer systems through movements of maxi-mal intensity and short duration is an important determinant of performance, despite the relatively small contribution of these systems (~34%) to the overall match energy demands.10
The abovementioned studies8,11 have improved our
understanding of the role of anthropometry and neuromus-cular fitness for performance in this sport; however, there is little information about the effect of age and sex on these fitness components in TKD athletes.5 Such information
would be of great practical value for coaches, as it would provide normative values by age and sex, and offer clues for physiological adaptations to long-term TKD training. Neuromuscular fitness refers to physical fitness components such as flexibility, muscle strength, muscle power, jump-ing ability, and speed.12 We acknowledge the existence of
previous studies13,14 that have provided normative values for
physical fitness of nonathletes from the childhood through adolescence to adulthood, but such data are missing in TKD. Therefore, the aim of the present study was to examine the effect of age group and sex on anthropometry and neuro-muscular fitness of TKD athletes.
Methods
Study design and participants
A total of 393 athletes (females n=172; 7–48 years old), sepa-rated into six age groups (7–9, 10–11, 12–13, 14–17, 18–32, and 33+), participated in the present study through a public call. The oldest female and male participants were 46.6 and 47.8 years, respectively. All participants, according to their coaches, were considered as competitive athletes. TKD teams from the area of Athens (Greece) were invited to participate. The teams, which accepted to participate, received detailed information with regard to the study risks and benefits and the testing procedures. This information was communicated to the athletes of each team by its head coach. All partici-pants or their parents (in the case of underage participartici-pants) provided written informed consent. In addition, participants were requested to abstain from moderate- to high-intensity physical activity on the day of testing and were instructed to consume a habitual meal 3 h before the testing session. Ad libitum drinking water was allowed before and during testing session. Inclusion criteria included the regular participation to official combats and the absence of any injury or illness. The study had a cross-sectional design and was conducted
during the competitive period of the season 2014–2015. The local (Exercise Physiology Laboratory, Nikaia) institutional review board approved the study.
Equipment and protocols
The single 90-min testing session was carried out in each team’s indoor training place. First, participants performed a standardized warm-up consisting of 10 min running and 5 min stretching exercises. After warm-up, the anthropometric and physical fitness tests were performed in the following order: body height, body mass, skinfolds, sit-and-reach (SAR), isometric strength, jumping, and agility tests. Although warm-up is routinely administered after evalua-tion of anthropometric characteristics in a laboratory setting, performing all tests after warm-up was preferred as more time-saving for the setup of the field testing session in the present study. Chronological age for each participant was calculated using a table of decimals of year.15 An electronic
weight scale (HD-351 Tanita, Arlington Heights, IL, USA) was used for body mass measurement (in the nearest 0.1 kg), a portable stadiometer (SECA, Leicester, UK) for height in the Frankfurt plane (0.1 cm), and a caliper (Harpenden, West Sussex, UK) for skinfolds (0.5 mm). BMI was calculated as the quotient of body mass (kg) to height squared (m2), and
BF was estimated from the sum of five skinfolds (biceps, triceps, subscapular, suprailiac, and calf).16 SAR was used
to evaluate low back and hamstring flexibility using a box providing an advantage of 15 cm, that is, the participants had a score of 15 cm when they just reached the toes.17 This
test was performed twice with a 5-min break and the best trial was recorded. The participants performed four tests of isometric muscle strength using a handgrip dynamometer (Takei, Tokyo, Japan) and trunk-legs dynamometer (Takei) according to the procedures described by Heyward:18 right
(HG), left HG, trunk, and trunk-legs.
Two tests of jumping ability were performed, AJ and Bosco test, using the Opto-jump (Microgate Engineering, Bolzano, Italy). First, participants performed two trials of AJ (cm) with a 5-min break and the best one was recorded, where they were instructed to jump as high as possible, using a countermovement and an arm-swing.19 Second,
they performed the 30-s Bosco test and mean power was recorded relative to body mass (Pmean, W kg−1). In this test,
they were asked to jump continuously with their arms on hips aiming for much time as possible in the air and as little time as possible on the ground.20 The 10×5 m test was used
as an index of agility and was performed running as fast as possible between two parallel lines 5 m apart
accord-Open Access Journal of Sports Medicine downloaded from https://www.dovepress.com/ by 118.70.13.36 on 26-Aug-2020
Dovepress Neuromuscular fitness in taekwondo
ing to the guidelines of the Eurofit fitness battery.21 All
tests were performed with participants barefoot. Among all anthropometric and neuromuscular fitness tests, break lasted for 5 min.
Statistical analysis
The statistical software IBM Statistical Package for the Social Sciences (SPSS) v.23.0 (SPSS, Chicago, IL, USA) performed all statistical analyses. Mean values and standard deviations were calculated for all variables. A two-way analysis of variance examined the main effects of sex and age and the sex × age group interaction on these anthro-pometric and physiological characteristics. Subsequent comparisons on age groups were carried out using post hoc Bonferroni test. The magnitude of these differences was examined using effect size η2 and evaluated as small
(0.010<η2≤0.059), moderate (0.059<η2≤0.138), and large
(η2>0.138).11 Quintiles were calculated for all variables
using the 20th, 40th, 60th, and 80th percentile. Significance level was set at a=0.05.
Results
Anthropometry and body composition
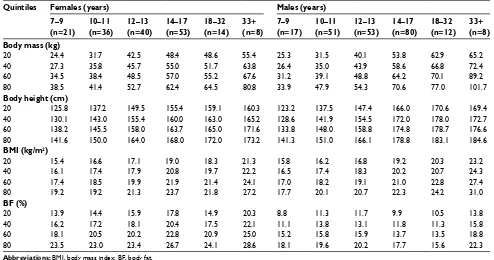
Mean values and standard deviations were calculated for all variables by sex and age group (Table 1). A main effect of age on body mass (p<0.001, η2=0.585), body height (p<0.001, η2=0.698), BMI (p<0.001, η2=0.298), and BF (p=0.009, η2=0.039) was observed, where the older age groups were
heavier and taller (but no difference among 14–17, 18–32, and 33+ groups) than their younger counterparts (Figure 1, Table 2). A main effect of sex on body mass (48.2±13.5 vs. 52.1±16.5 kg, in females and males, respectively; p<0.001,
η2=0.046), body height (154.2±12.7 vs. 159.4±16.5 cm;
p<0.001, η2=0.050), and BF (20.4%±5.0% vs. 14.8%±4.7%;
p<0.001, η2=0.169), but not on BMI (19.9±3.3 vs.
19.9±3.2 kg/m2; p=0.130, η2=0.006), was shown. An age × sex interaction on body mass (p<0.001, η2=0.057), body
height (p<0.001, η2=0.115), and BF (p=0.003, η2=0.045), but
not on BMI (p=0.172, η2=0.020), was observed, too; that is,
a larger difference in body mass and body height between 12–13 and 14–17 groups was observed in males than in females; the sex difference in BF was greater in the 14–17 than in the 12–13 age group.
Flexibility, jumping ability, and agility
A main effect of age on SAR (p<0.001, η2=0.197; best scores
in the 18–32 age group), AJ (p<0.001, η2=0.385; best scores
in the 18–32 group), Pmean (p<0.001, η2=0.339), and on agility Table 1
Descriptive characteristics (mean
±
standard deviation) of all
variables by sex and age group
Variable
Females (years)
Males (years)
7–9 (n=
21)
10–11 (n=
36)
12–13 (n=
40)
14–17 (n=
53)
18–32 (n=
14) 33 + (n = 8)
7–9 (n=
17)
10–11 (n=
51)
12–13 (n=
53)
14–17 (n=
80)
18–32 (n=
12) 33 + (n = 8) Age (years) 8.6 ± 0.8 10.6 ± 0.6 12.4 ± 0.6 15.2 ± 1.1 21.1 ± 2.9 40.8 ± 3.7 8.5 ± 0.8 10.7 ± 0.6 12.4 ± 0.6 15.1 ± 1.1 21.2 ± 5.2 41.7 ± 5.5
Body mass (kg)
31.6 ± 7.7 38.6 ± 10.0 47.7 ± 9.1 56.4 ± 8.7 56.1 ± 7.9 68.8 ± 15.3 30.4 ± 6.9 39.2 ± 8.7 47.1 ± 10.3 62.3 ± 10.4 70.5 ± 11.3 82.9 ± 16.9
Body height (cm)
133.8 ± 7.8 144.7 ± 9.0 156.9 ± 8.0 161.9 ± 6.4 164.9 ± 5.7 167.5 ± 6.1 131.9 ± 8.6 144.7 ± 7.6 156.0 ± 10.0 172.7 ± 8.1 177.2 ± 6.7 175.8 ± 7.0 BMI (kg/m 2) 17.5 ± 3.0 18.2 ± 2.6 19.3 ± 2.6 21.5 ± 2.9 20.6 ± 2.2 24.4 ± 4.5 17.3 ± 2.3 18.5 ± 2.9 19.2 ± 2.9 20.8 ± 2.4 22.4 ± 2.6 26.6 ± 3.8 BF (%) 18.5 ± 4.9 19 ± 4.7 20 ± 4.9 22.1 ± 4.7 19.4 ± 4.8 24.1 ± 4.7 14 ± 5.1 15.5 ± 5 15.6 ± 5.1 13.7 ± 4.2 13 ± 3.1 18.2 ± 4.9 SAR (cm) 27.0 ± 3.3 24.3 ± 5.1 25.6 ± 6.5 30.1 ± 5.6 30.0 ± 8.2 24.8 ± 7.2 20.5 ± 5.5 20.0 ± 5.4 19.0 ± 6.5 26.5 ± 7.9 32.6 ± 6.7 22 ± 8.8 AJ (cm) 21.4 ± 2.7 24.8 ± 4.5 27.1 ± 4 27.3 ± 4.9 30.6 ± 5.4 21.3 ± 6.3 20.2 ± 4.4 25.3 ± 4.7 29.2 ± 6.4 37.8 ± 6.8 43.7 ± 7.3 34 ± 7.1
Bosco (W kg
− 1) 20.6 ± 3.9 22.1 ± 4.4 24.4 ± 5.2 26.1 ± 5.4 27.5 ± 4.4 18.0 ± 4.8 17.7 ± 4.4 20.2 ± 4.2 23.6 ± 5.4 31.3 ± 6.7 36.1 ± 9 24.7 ± 6.5 Agility (s) 20.05 ± 1.72 19.30 ± 1.29 18.42 ± 1.06 17.82 ± 1.31 17.23 ± 1.39 20.44 ± 1.59 19.76 ± 1.67 18.61 ± 1.33 18.02 ± 1.47 16.14 ± 1.00 15.78 ± 1.07 16.91 ± 1.72
Right handgrip strength (kg)
15.3 ± 3.6 19.5 ± 3.7 25.1 ± 4.9 28.4 ± 4.1 31.8 ± 4.3 32.5 ± 4.4 14.4 ± 3.2 20.3 ± 3.7 25.5 ± 5.6 39.4 ± 7.0 48.8 ± 6.7 48.1 ± 6.0
Left handgrip strength (kg)
14.5 ± 3.8 18.5 ± 3.9 24.9 ± 4.4 28.2 ± 3.7 30.3 ± 4.1 31 ± 5.3 14.2 ± 3.0 19.5 ± 3.5 24.6 ± 6.0 38.7 ± 7.6 47.5 ± 5.5 49.0 ± 4.0
Trunk strength (kg)
32.2 ± 7.3 36.8 ± 8.7 56.5 ± 10.1 70.9 ± 13.2 72.7 ± 10.7 78.0 ± 24.1 31.0 ± 6.5 50.0 ± 13.5 60.5 ± 15.8 99.7 ± 23.1 139.6 ± 36.5 123.9 ± 17.1
Trunk-legs strength (kg)
42.3 ± 15.7 49.2 ± 13 65.3 ± 13.5 88.5 ± 19.3 93.9 ± 13.4 92.8 ± 29.4 37.5 ± 9.5 60.4 ± 18.8 69.8 ± 20.1 119.8 ± 33.6 168.3 ± 49.3 150.6 ± 23.1 Sum (kg) 103.8 ± 26.7 124.1 ± 24.7 171.0 ± 27.2 217.8 ± 35.2 225.9 ± 27.8 234.3 ± 57.3 97.9 ± 20.0 150.7 ± 35.2 179.5 ± 45.3 298.9 ± 65.2 404.8 ± 94.5 371.6 ± 43.3
Relative sum (kg.kg
−
1 of body mass)
3.41 ± 0.70 3.31 ± 0.64 3.58 ± 0.54 3.84 ± 0.67 4.19 ± 0.64 3.53 ± 1.06 3.21 ± 0.67 3.88 ± 0.82 3.94 ± 0.87 4.81 ± 0.89 5.46 ± 0.77 4.60 ± 0.86 Abbreviations:
AJ, Abalakov jump; BF, body fat; BMI, body mass index; SAR, sit-and-reach test.
Open Access Journal of Sports Medicine downloaded from https://www.dovepress.com/ by 118.70.13.36 on 26-Aug-2020
Dovepress
Nikolaidis et al
(p<0.001, η2=0.393) was observed (Figure 2, Table 3). Also,
a main effect of sex on SAR (27.2±6.2 vs. 22.9±7.9 cm in females and males, respectively; p<0.001, η2=0.043),
AJ (26.0±5.1 vs. 31.7±8.9 cm; p<0.001, η2=0.163), P mean
(23.9±5.4 vs. 25.9±8.0 W kg−1; p=0.001, η2=0.030), and
agility (18.65±1.63 vs. 17.51±1.81 s; p<0.001, η2=0.134)
was shown. An age × sex interaction on SAR (p=0.038,
η2=0.031), P
mean (p<0.001, η2=0.110), and AJ (p<0.001, η2=0.183) was observed with greater differences between
the 12–13 and 18–32 groups in males than in females for both fitness components.
Isometric strength
There was a large main effect of age (p<0.001) on right HG (η2=0.708), left HG (η2=0.705), trunk (η2=0.675),
trunk-legs (η2=0.605), absolute sum (η2=0.702), and
rela-tive sum (η2=0.232), with higher values in the older than in
the younger age groups (Figure 3, Table 4). In addition, a large main effect of sex on these parameters was observed
(p<0.001, η2=0.241, η2=0.260, η2=0.302, η2=0.211, η2=0.300, and η2=0.115, respectively), with higher values
in males than in females. A sex × age group interaction on these parameters was shown (p≤0.002, η2=0.273, η2=0.279, η2=0.232, η2=0.176, η2=0.252, and η2=0.068), too, with
greater sex differences in the older age groups compared with the younger one.
Discussion
The main findings of the present study were 1) a greater dif-ference in body mass and body height between the 12–13 and 14–17 groups in males than in females, whereas the sex difference in BF being greater in the 14–17 compared to the 12–13 age group, 2) greater differences in SAR, Bosco test, and AJ between the 12–13 and 18–32 groups in males than in females, 3) male athletes achieving SAR similar to that of female athletes in the 18–32 group, and 4) greater difference in isometric muscle strength between the 12–13 and 14–17 groups in male than female athletes.
90 1.8
1.7
1.6
1.5
1.4
1.3
24
22
20
18
16
14
12 80
70
60
Body mass (kg
)
BMI (kg/m
2)
Body height (m)
Body fat (%
)
50
40
30
27.5
25.0
22.5
20.0
17.5
7–9 10–11 12–13
Age group (years)14–17 18–32 33+
7–9 10–11 12–13
Age group (years)14–17 18–32 33+ 7–9 10–11 12–13Age group (years)14–17 18–32 33+ 7–9 10–11 12–13
Age group (years)14–17 18–32 33+
Figure 1 Body mass, body height, BMI, and body fat (%) by sex and age group.
Notes: females, ○ males.
Abbreviation: BMI, body mass index.
Open Access Journal of Sports Medicine downloaded from https://www.dovepress.com/ by 118.70.13.36 on 26-Aug-2020
Dovepress Neuromuscular fitness in taekwondo
Table 2 Quintiles of body mass, body height, BMI, and BF (%) by sex and age group
Quintiles Females (years) Males (years)
7–9 (n=21)
10–11 (n=36)
12–13 (n=40)
14–17 (n=53)
18–32 (n=14)
33+
(n=8) 7–9 (n=17)
10–11 (n=51)
12–13 (n=53)
14–17 (n=80)
18–32 (n=12)
33+
(n=8) Body mass (kg)
20 24.4 31.7 42.5 48.4 48.6 55.4 25.3 31.5 40.1 53.8 62.9 65.2
40 27.3 35.8 45.7 55.0 51.7 63.8 26.4 35.0 43.9 58.6 66.8 72.4
60 34.5 38.4 48.5 57.0 55.2 67.6 31.2 39.1 48.8 64.2 70.1 89.2
80 38.5 41.4 52.7 62.4 64.5 80.8 33.9 47.9 54.3 70.6 77.0 101.7
Body height (cm)
20 125.8 137.2 149.5 155.4 159.1 160.3 123.2 137.5 147.4 166.0 170.6 169.4
40 130.1 143.0 155.4 160.0 163.0 165.2 128.6 141.9 154.5 172.0 178.0 172.7
60 138.2 145.5 158.0 163.7 165.0 171.6 133.8 148.0 158.8 174.8 178.7 176.6
80 141.6 150.0 164.0 168.0 172.0 173.2 141.3 151.0 166.1 178.8 183.1 184.6
BMI (kg/m2)
20 15.4 16.6 17.1 19.0 18.3 21.3 15.8 16.2 16.8 19.2 20.3 23.2
40 16.1 17.4 17.9 20.8 19.7 22.2 16.5 17.4 18.3 20.2 20.7 24.3
60 17.4 18.5 19.9 21.9 21.4 24.1 17.0 18.2 19.1 21.0 22.8 27.4
80 19.2 19.2 21.3 23.7 21.8 27.2 17.7 20.1 20.7 22.3 24.2 31.0
BF (%)
20 13.9 14.4 15.9 17.8 14.9 20.3 8.8 11.3 11.7 9.9 10.5 13.8
40 16.2 17.2 18.1 20.4 17.5 22.1 11.1 13.8 13.1 11.8 11.3 15.8
60 18.1 20.5 20.2 22.8 20.9 25.0 15.2 15.8 15.9 13.7 13.5 18.8
80 23.5 23.0 23.4 26.7 24.1 28.6 18.1 19.6 20.2 17.7 15.6 22.3
Abbreviations: BMI, body mass index; BF, body fat.
32 21
20
19
18
17
16
15
35
30
25
20
15 30
28
26
24
SAR (cm)
AJ (cm)
Mean power (W kg
–1)
10
×
5 m (s)
22
20
40
35
30
25
20
15
7–9 10–11 12–13
Age group (years)14–17 18–32 33+
7–9 10–11 12–13
Age group (years)14–17 18–32 33+ 7–9 10–11 12–13Age group (years)14–17 18–32 33+ 7–9 10–11 12–13
Age group (years)14–17 18–32 33+
Figure 2 SAR, agility, AJ, and Bosco test by sex and age group.
Notes: females, ○ males.
Abbreviations: AJ, Abalakov jump; SAR, sit-and-reach test.
Open Access Journal of Sports Medicine downloaded from https://www.dovepress.com/ by 118.70.13.36 on 26-Aug-2020
Dovepress
Nikolaidis et al
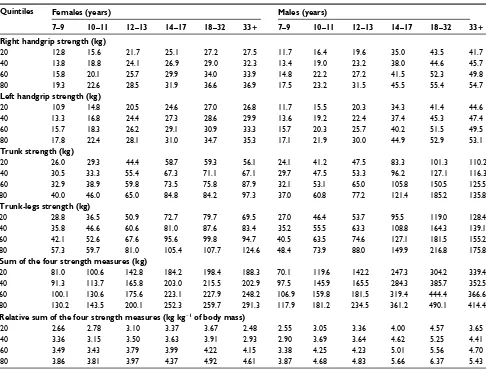
Table 3 Quintiles of SAR, agility, AJ, and Bosco test by sex and age group
Quintiles Females (years) Males (years)
7–9 10–11 12–13 14–17 18–32 33+ 7–9 10–11 12–13 14–17 18–32 33+
SAR (cm)
20 24.9 19.7 18.8 26.5 23.3 15.5 14.9 15.0 13.9 19.3 26.4 12.3
40 26.9 23.4 24.6 29.0 30.8 23.1 20.8 18.7 16.9 23.5 33.3 21.3
60 28.0 26.6 29.0 32.0 33.1 27.3 23.4 22.0 18.7 30.8 35.4 23.3
80 29.4 28.5 31.2 33.2 37.1 31.3 24.7 24.1 24.2 33.0 38.4 31.5
AJ (cm)
20 18.5 20.9 24.0 22.9 25.2 13.6 17.0 21.0 24.1 30.6 37.3 25.7
40 20.3 23.2 25.8 25.8 30.5 20.0 18.9 25.0 26.2 36.0 41.3 31.7
60 22.1 25.5 28.4 28.5 33.4 24.0 21.4 26.6 30.4 38.5 48.0 37.3
80 24.6 28.4 30.0 32.0 36.0 26.0 23.7 29.6 35.2 44.6 50.1 39.6
Bosco (W kg−1)
20 16.5 19.2 19.6 20.7 26.3 11.8 13.9 16.2 18.2 25.4 26.3 19.0
40 19.1 21.1 23.2 23.5 27.3 17.7 16.9 18.2 22.4 29.1 31.8 21.4
60 21.7 22.8 25.1 26.6 29.3 19.4 18.7 20.9 24.5 32.5 41.2 25.7
80 24.9 25.1 30.0 32.8 30.7 22.8 24.2 24.2 29.1 36.9 44.5 32.2
Agility (s)
20 18.54 18.07 17.53 16.51 16.13 18.68 18.22 17.35 16.76 15.23 14.86 15.71
40 19.66 18.73 18.14 17.36 16.69 19.89 19.37 18.29 17.43 15.97 15.73 16.24
60 20.25 19.72 18.50 18.00 17.40 21.22 20.27 18.75 18.50 16.46 16.04 16.56
80 22.15 20.75 19.49 18.64 18.28 22.20 20.89 19.99 19.23 16.97 16.44 18.65
Notes: Bosco=30 s continuous jumping test, agility=10×5 m agility test.
Abbreviations: AJ, Abalakov jump; SAR, sit-and-reach test.
Anthropometry and body composition
Although both females and males differed in body dimen-sions in the 12–13 and 14–17 age groups, a greater differ-ence between these two age groups in body mass and body height was observed in males than in females. There was no sex difference in BMI, which was in agreement with the previous studies on TKD.9,22 This lack of difference should be
attributed to the relatively low BMI of males rather than to the increased BMI of females and reflected a likely advantage of the athletes with relatively low BMI, that is the athletes who were relatively tall (and consequently with long limbs) and competed in relatively “light” weight categories.
The increase in the competitive level in the older TKD athletes leads to a typical reduction in BF and body mass to compete in selected body mass divisions.23 A main concern
of coaches is to ensure that the decrease in body mass and BF does not affect the musculature.24 Typically, a range of
BF 7%–14% in males and 12%–19% in females is observed in TKD elite athletes.5,25 The BF in the present study for the
adult category (18–32 years old; ~13% in males and ~19% in females) is in line with these references. Also, the percentage of the 14–17 group (~14% in males and ~22% in females) was in agreement with the data on South African athletes (15.5 years old), where lower BF and higher scores of body mass and body height were found also in males than in females.26
This evidence is in line with a previous study that suggested
the variation in body composition between different levels of expertise, revealing that expert athletes of both sexes had lower BF than novice athletes.27 With the beginning of competitive
level (~20 years old), BF reduces for values closer to 12%.28
Flexibility, jumping ability, and agility
The TKD techniques require a considerable range of motion, especially in the lower limbs.29 For this reason, the flexibility
is a common test used in this sport to characterize the athletes with SAR being the most used test.22,30 Typical values for
senior TKD athletes vary between 36 and 36.9 cm for males and 35.2 and 56.6 cm for females.5 The values found in our
study are close to 32 cm for both male and female senior athletes (18–32 group), thus being considerably lower than the reference TKD values. Our results in the younger groups are also considerably different than the previous reports. For instance, a study conducted in South African junior athletes showed that females were more flexible than males in the SAR test (42.6 and 40.1 cm, respectively).26 In addition, female
and male members of the Czech national team had SAR 38 and 37 cm, respectively.22 This is almost a 5–8 cm difference
between the results of the present study and those of the above-mentioned values in South African and Czech athletes, which should be attributed to the different competitive level.
However, the findings of the present study were in agree-ment with the previous studies showing high scores in SAR in
Open Access Journal of Sports Medicine downloaded from https://www.dovepress.com/ by 118.70.13.36 on 26-Aug-2020
Dovepress Neuromuscular fitness in taekwondo
50
40
30
Right HG strength (kg
)
Tr
unk strength (kg
)
Tr
unk-legs strength (kg
)
To
tal strength (kg
)
To
tal strength (kg kg
–1 BM)
Left HG strength (kg
)
20
10
125
100
75
50
25
400
300
200
100
125 150
100
75
50
25
5.0
4.5
4.0
3.5
3.0 50
40
30
20
10 7–9 10–11 12–13
Age group (years)14–17 18–32 33+
7–9 10–11 12–13
Age group (years)14–17 18–32 33+
7–9 10–11 12–13
Age group (years)14–17 18–32 33+ 7–9 10–11 12–13Age group (years)14–17 18–32 33+ 7–9 10–11 12–13
Age group (years)14–17 18–32 33+
7–9 10–11 12–13
Age group (years)14–17 18–32 33+
Figure 3 Right and left HG, trunk and legs isometric strength, and their sum (total strength) in absolute and relative values by sex and age group.
Notes: females, ○ males
Abbreviations: HG, handgrip; BM, body mass.
TKD athletes compared with nonathletes. The unique similar tendency is that females tend to be more flexible than males.27
The high flexibility in this sport may result from the specific-ity of range of motion during the combat and also from the training adaptations.31 The muscular power and an adequate
resynthesis of creatine phosphate may be a determinant to increase the performance of TKD athletes.32,33 The muscular
power of these athletes has been assessed through the use of squat jump (SJ) and counter-movement jump (CMJ).5 The
results of the previous studies for SJ range between 35.8– 45.4 cm for males and 23.7–29.8 cm for females, whereas the CMJ varies between 39.3–43.9 cm for males and 26.4–32.8 cm for females.8 It was also possible to verify that senior
athletes had greater performances than the younger groups
Open Access Journal of Sports Medicine downloaded from https://www.dovepress.com/ by 118.70.13.36 on 26-Aug-2020
Dovepress
Nikolaidis et al
Table 4 Quintiles of right and left handgrip, trunk and legs isometric strength, and their sum (total strength) in absolute and relative
values by sex and age group
Quintiles Females (years) Males (years)
7–9 10–11 12–13 14–17 18–32 33+ 7–9 10–11 12–13 14–17 18–32 33+
Right handgrip strength (kg)
20 12.8 15.6 21.7 25.1 27.2 27.5 11.7 16.4 19.6 35.0 43.5 41.7
40 13.8 18.8 24.1 26.9 29.0 32.3 13.4 19.0 23.2 38.0 44.6 45.7
60 15.8 20.1 25.7 29.9 34.0 33.9 14.8 22.2 27.2 41.5 52.3 49.8
80 19.3 22.6 28.5 31.9 36.6 36.9 17.5 23.2 31.5 45.5 55.4 54.7
Left handgrip strength (kg)
20 10.9 14.8 20.5 24.6 27.0 26.8 11.7 15.5 20.3 34.3 41.4 44.6
40 13.3 16.8 24.4 27.3 28.6 29.9 13.6 19.2 22.4 37.4 45.3 47.4
60 15.7 18.3 26.2 29.1 30.9 33.3 15.7 20.3 25.7 40.2 51.5 49.5
80 17.8 22.4 28.1 31.0 34.7 35.3 17.1 21.9 30.0 44.9 52.9 53.1
Trunk strength (kg)
20 26.0 29.3 44.4 58.7 59.3 56.1 24.1 41.2 47.5 83.3 101.3 110.2
40 30.5 33.3 55.4 67.3 71.1 67.1 29.7 47.5 53.3 96.2 127.1 116.3
60 32.9 38.9 59.8 73.5 75.8 87.9 32.1 53.1 65.0 105.8 150.5 125.5
80 40.0 46.0 65.0 84.8 84.2 97.3 37.0 60.8 77.2 121.4 185.2 135.8
Trunk-legs strength (kg)
20 28.8 36.5 50.9 72.7 79.7 69.5 27.0 46.4 53.7 95.5 119.0 128.4
40 35.8 46.6 60.6 81.0 87.6 83.4 35.2 55.5 63.3 108.8 164.3 139.1
60 42.1 52.6 67.6 95.6 99.8 94.7 40.5 63.5 74.6 127.1 181.5 155.2
80 57.3 59.7 81.0 105.4 107.7 124.6 48.4 73.9 88.0 149.9 216.8 175.8
Sum of the four strength measures (kg)
20 81.0 100.6 142.8 184.2 198.4 188.3 70.1 119.6 142.2 247.3 304.2 339.4
40 91.3 113.7 165.8 203.0 215.5 202.9 97.5 145.9 165.5 284.3 385.7 352.5
60 100.1 130.6 175.6 223.1 227.9 248.2 106.9 159.8 181.5 319.4 444.4 366.6
80 130.2 143.5 200.1 252.3 259.7 291.3 117.9 181.2 234.5 361.2 490.1 414.4
Relative sum of the four strength measures (kg kg−1 of body mass)
20 2.66 2.78 3.10 3.37 3.67 2.48 2.55 3.05 3.36 4.00 4.57 3.65
40 3.36 3.15 3.50 3.63 3.91 2.93 2.90 3.69 3.64 4.62 5.25 4.41
60 3.49 3.43 3.79 3.99 4.22 4.15 3.38 4.25 4.23 5.01 5.56 4.70
80 3.86 3.81 3.97 4.37 4.92 4.61 3.87 4.68 4.83 5.66 6.37 5.43
and that males jump higher than females. Elite athletes tend to be more powerful than the younger ones because of the patterns of neuromuscular activation,22 muscular adaptations,
and training adaptations, and, thus, this can be a justification for the best results obtained in the senior athletes.5
In addition to the use of vertical jump tests (SJ, CMJ, or AJ) as a measure of legs’ muscle strength, previous studies have used continuous jumping tests to assess anaerobic power (e.g., 15 s protocol).8 The study conducted in elite Croatian
TKD athletes showed an overall power of 24.4 W kg−1.8
Our values lie between 27 and 35 W kg−1 in the competitive
group (18–32) for females and males, respectively. This fol-lowed a previous work that assessed the Wingate anaerobic test and revealed that it was higher in the elite males than in the females.34 Moreover, differences were found among
various age groups, with the values being more powerful in the 18–32 age group.
Finally, agility was also assessed in our study. We have applied the 10×5 m shuttle run as used in the previous
studies.31 Our results revealed significant differences between
sexes, being males faster than females. This is in line with the study conducted in South African junior athletes that revealed that male participants were faster than female in the agility T test (12.6 and 14.2 s, respectively).26
Isometric strength
HG, back, and leg tests have been used previously to assess isometric strength in TKD athletes.35 A study conducted in
South African junior TKD athletes revealed that males had greater isometric strength in HG test than female participants (32.9 kg left and 33.0 kg right; and 24.6 kg left and 25.3 kg right, respectively).26 Our results for similar age group
(14–17) were similar to those findings. It was also found that the senior group (18–32) had greater strength in HG and trunk tests than the younger groups. Nevertheless, regular training programs in the younger groups may also improve muscle strength. A study conducted in children revealed that TKD training improved HG strength.36
Open Access Journal of Sports Medicine downloaded from https://www.dovepress.com/ by 118.70.13.36 on 26-Aug-2020
Dovepress Neuromuscular fitness in taekwondo
Limitations, strengths, and implications
A limitation of the present study was that the variation of anthropometric and neuromuscular fitness characteristics by weight category within each age group was not considered. Although such analysis would add important information of practical value for TKD practitioners, the classification of athletes into many weight categories would result in small sample size in each category and, thus, it would make it impossible to examine differences among categories. The cross-sectional design did not allow controlling for the pos-sible effect of self-selection on the findings, that is older age groups likely would not include weaker or less dedicated practitioners. Moreover, this study did not consider the com-petition level of participants (e.g., belt-level), training history, duration and frequency of practice, maturity, and their effect on anthropometric characteristics and neuromuscular fitness.
Despite these limitations, the present study, being the larg-est relevant study in TKD, to the blarg-est of our knowledge, was carried out on 393 athletes, from 7 to >33 years old. Moreover, anthropometrics, flexibility, power, and isometric strength were examined, thus covering the majority of variables that associate with successful TKD performance.22,34 These
find-ings have both theoretical and practical implications. From a theoretical perspective, the effect of long-term TKD training on flexibility of male athletes was highlighted. From a practi-cal perspective, coaches can use these findings as reference for the evaluation of their athletes with regard to anthropometry, flexibility, isometric strength, muscle power, and agility.
Conclusion
On the basis of these findings, it was concluded that the dif-ferent patterns of age trends between sexes should be consid-ered by TKD coaches and fitness trainers in the evaluation of neuromuscular fitness of their athletes. As the anthropometric characteristics and neuromuscular fitness varied by sex (i.e., highest scores in males, except flexibility) and age (i.e., high-est scores in the 18–32 age group) with unique sport-specific patterns in TKD athletes, these findings would be important for the development of specific training programs.
Disclosure
The authors report no conflicts of interest in this work.
References
1. Fong SSM, Ng GYF. Does Taekwondo training improve physical fitness?
Phys Ther Sport. 2011;12(2):100–106.
2. Casolino E, Lupo C, Cortis C, Chiodo S, Minganti C, Capranica L, Tessitore A. Technical and tactical analysis of youth taekwondo per-formance. J Strength Cond Res. 2012;26(6):1489–1495.
3. Čular D, Krstulović S, Katić R, Primorac D, Vučić D. Predictors of fitness status on success in Taekwondo. Coll Antropol. 2013;37(4): 1267–1274.
4. Sadowski J, Gierczuk D, Miller J, Cieśliński I. Success factors in elite WTF taekwondo competitors. Arch Budo. 2012;8(3):141–146. 5. Bridge CA, Ferreira Da Silva Santos J, Chaabène H, Pieter W, Franchini
E. Physical and physiological profiles of Taekwondo athletes. Sports Med. 2014;44(6):713–733.
6. Nikolaidis PT, Chtourou H, Torres-Luque G, Tasiopoulos IG, Heller J, Padulo J. Effect of a six-week preparation period on acute physiological responses to a simulated combat in young national-level taekwondo athletes. J Hum Kinet. 2015;47(1):115–125.
7. Ball N, Nolan E, Wheeler K. Anthropometrical, physiological, and tracked power profiles of elite taekwondo athletes 9 weeks before the Olympic competition phase. J Strength Cond Res. 2011;25(10): 2752–2763.
8. Marković G, Mišigoj-Duraković M, Trninić S. Fitness profile of elite Croatian female taekwondo athletes. Coll Antropol. 2005;29(1):93–99. 9. Kazemi M, Waalen J, Morgan C, White AR. A profile of Olympic
Taekwondo competitors. J Sports Sci Med. 2006;5(CSSI-1):114–121. 10. Campos FAD, Bertuzzi R, Dourado AC, Santos VGF, Franchini E.
Energy demands in taekwondo athletes during combat simulation. Eur J Appl Physiol. 2012;112(4):1221–1228.
11. Cohen J. Statistical Power Analysis for the Behavioral Sciences. 2nd ed. Hillsdale, NJ: Lawrence Erlbaum Associates; 1988.
12. Burfeind K, Hong J, Stavrianeas S. Gender differences in the neuro-muscular fitness profiles of NCAA Division III soccer players. Isokinet Exerc Sci. 2012;20(2):115–120.
13. Artero EG, Espana-Romero V, Ortega FB, et al. Health-related fitness in adolescents: underweight, and not only overweight, as an influenc-ing factor. The AVENA study. Scand J Med Sci Sports. 2010;20(3): 418–427.
14. Ortega FB, Artero EG, Ruiz JR, et al. Physical fitness levels among European adolescents: the HELENA study. Br J Sports Med.
2011;45(1):20–29.
15. Ross WD, Marfell-Jones MJ. Kinanthropometry. In: MacDougall JD, Wenger HA, Green HJ, editors. Physiological Testing of the High-Performance Athlete. Champaign, IL: Human Kinetics; 1991. 16. Parizkova J. Lean body mass and depot fat during autogenesis in
humans. In: Parizkova J, Rogozkin V, editors. Nutrition, Physical Fitness and Health: International Series on Sport Sciences. Baltimore, MD: University Park Press; 1978.
17. Ayala F, Sainz de Baranda P, De Ste Croix M, Santonja F. Absolute reliability of five clinical tests for assessing hamstring flexibility in professional futsal players. J Sci Med Sport. 2012;15(2):142–147. 18. Heyward VH. Advanced Fitness Assessment and Exercise Prescription.
Champaign, IL: Human Kinetics; 2010.
19. Aragon-Vargas LF. Evaluation of four vertical jump tests: methodol-ogy, reliability, validity, and accuracy. Meas Phys Educ Exerc Sci.
2000;4:215–228.
20. Sands WA, McNeal JR, Ochi MT, Urbanek TL, Jemni M, Stone MH. Comparison of the Wingate and Bosco anaerobic tests. J Strength Cond Res. 2004;18(4):810–815.
21. Adam C, Klissouras V, Ravazzolo M, Renson R, Tuxworth W. The Eurofit Test of European Physical Fitness Tests. Strasbourg, France: Council of Europe; 1988.
22. Heller J, Perič T, Dlouhá R, Kohlíková E, Melichna J, Nováková H. Physiological profiles of male and female taekwon-do (ITF) black belts.
J Sports Sci. 1998;16(3):243–249.
23. Brito CJ, Roas AFCM, Brito ISS, Marins JCB, Córdova C, Franchini E. Methods of body-mass reduction by combat sport athletes. Int J Sport Nutr Exerc Metab. 2012;22(2):89–97.
24. Langan-Evans C, Close GL, Morton JP. Making weight in combat sports.
Strength Cond J. 2011;33(6):25–39.
25. Bouhlel E, Jouini A, Gmada N, Nefzi A, Ben Abdallah K, Tabka Z. Heart rate and blood lactate responses during Taekwondo training and competition. Sci Sports. 2006;21(5):285–290.
Open Access Journal of Sports Medicine downloaded from https://www.dovepress.com/ by 118.70.13.36 on 26-Aug-2020
Dovepress
Open Access Journal of Sports Medicine
Publish your work in this journal
Submit your manuscript here: http://www.dovepress.com/open-access-journal-of-sports-medicine-journal
The Open Access Journal of Sports Medicine is an international, peer-reviewed, open access journal publishing original research, reports, reviews and commentaries on all areas of sports medicine. The journal is included on PubMed. The manuscript manage-ment system is completely online and includes a very quick and fair
peer-review system. Visit http://www.dovepress.com/testimonials.php to read real quotes from published authors.
Dove
press
Nikolaidis et al
26. Mathunjwa ML, Mugandani SC, Ncgobo M, Djarova-Daniels T, Ivanov S. Physical, anthropometric and physiological profiles of experienced junior male and female South African Taekwondo athletes. Afr J Phys Health Educ Recr Dance. 2015;21(4):1402–1416.
27. Toskovic NN, Blessing D, Williford HN. Physiologic profile of recre-ational male and female novice and experienced Tae Kwon Do practi-tioners. J Sports Med Phys Fitness. 2004;44(2):164–172.
28. Catikkas F, Kurt C, Atalag O. Kinanthropometric attributes of young male combat sports athletes. Coll Antropol. 2013;37(4): 1365–1368.
29. Wąsik J. Structure of movement of a turning technique used in the event of special techniques in Taekwon-do ITF. Arch Budo.
2009;1(5):111–115.
30. Suzana M, Pieter W. Motor ability profile of junior and senior taekwondo club athletes. Braz J Biomotricity. 2009;3:325–333.
31. Kim HB, Stebbins CL, Chai JH, Song JK. Taekwondo training and fitness in female adolescents. J Sports Sci. 2011;29(2):133–138. 32. Matsushigue KA, Hartmann K, Franchini E. Taekwondo: physiological
responses and match analysis. J Strength Cond Res. 2009;23(4):1112–1117. 33. Santos VGF, Franchini E, Lima-Silva AE. Relationship between attack and skipping in taekwondo contests. J Strength Cond Res. 2011; 25(6):1743–1751.
34. Lin WL, Yen KT, Lu CYD, Huang YH, Chang CK. Anaerobic capacity of elite Taiwanese Taekwondo athletes. Sci Sports. 2006;21(5):291–293. 35. Cetin C, Keçeci AD, Erdòan A, Baydar ML. Influence of custom-made mouth guards on strength, speed and anaerobic performance of taekwondo athletes. Dent Traumatol. 2009;25(3):272–276.
36. Lee B, Kim K. Effect of Taekwondo training on physical fitness and growth index according to IGF-1 gene polymorphism in children.
Korean J Physiol Pharmacol. 2015;19(4):341–347.
Open Access Journal of Sports Medicine downloaded from https://www.dovepress.com/ by 118.70.13.36 on 26-Aug-2020