CSEIT1724127 | Received : 10 August 2017 | Accepted : 25 August 2017 | July-August-2017 [(2)4: 776-780]
International Journal of Scientific Research in Computer Science, Engineering and Information Technology © 2017 IJSRCSEIT | Volume 2 | Issue 4 | ISSN : 2456-3307
776
Virus Image Classification using PHOG and SGLDM Texture
Features
Archana
1, Syeda Asra
21PG Student, Department of Computer Science and Engineering, Appa Institute of Engineering and Technology Kalaburagi, Karanataka, India
2Associate Professor, Department of Computer Science and Engineering, Appa Institute of Engineering and Technology Kalaburagi, Karanataka, India
ABSTRACT
Plant virus classification is one of the emerging application areas of image processing. The design of plant classification module must need to recognize the disease, continue with this research some image processing designers focused on designing the such module which classify the virus which are responsible particular plant disease. In this paper we briefly explain the designed system which efficiently classifies the real time virus present at the given input image. The given is processed, based on the collected features the virus present at the given is classified by using ANN classifiers. The module is trained with five different set of virus, the system design and its performance is briefly explained in below section.
Keywords:Contrast Limited Adaptive Histogram Equalization, Adaptive Weiner Filtering, PHOG, SGLDM and Machine Learning Classifier.
I.
INTRODUCTION
Agriculture is one of the effective and essential working fields in fast growing nations like India. Here more than 70% peoples life style is completely depend on agriculture. A slight change in the plant production and quality is directly affect the individual health and economy condition of that person or nation directly or indirectly.
On earth, plant is one of the significant sources of energy. Today change in this life style will directly affect the environment condition, this change in environmental condition will directly effecting plants. This leads to various diseases in human as well as in the plants. As previously mentioned the people who completely depend agriculture is more in our country, hence damage in plant production directly affect the human health system and economic system. This plant diseases spreading worldwide, so it is significant to recognize the disease at its initial stage. Farmer is the closest labors to the plants and they recognize the plant related disease as their experiences and knowledge they have. But sometime plant disease are completely not recognized by the human eye and some time some time
what farmer predicted based on their knowledge which is may not be correct one. In such cases there must be necessary design a module recognize the plant disease automatically. This is the one of the case how we can design a system who classify the plant diseases and one more method is plant disease are also identified by recognizing the virus which is can cause the particular disease[01]. In the proposed paper we implemented an architecture which identifies the respective virus present in given input plant image. A low of image processing engineers are working on this modules to best module, the standard research work done on the same concepts are summarized in section 2 i.e. in literature survey.
II.
LITERATURE SURVEY
some image processing techniques for image analysis and disease classification.
H. Sabrol et.al [03] has designed a plant disease classification which is related to Tomato plant. The designed first recognize healthy and unhealthy plant, when the plant is classified as unhealthy then it is again classified into five different types of disease. The disease classification is completely depends on fungal, bacteria and virus. Disease is classified based on the collected features i.e. it include color, shape and texture information. At the result section author briefly summarized that presented module gives best accuracy in plant disease classification.
Megha S et.al [04] implemented a color, shape and structured based plant disease classification system by using SVM classifier. The disease part present at the input leaf is recognized by using FCM clustering technique. A three separate feature extraction algorithms are used to extract the color, shape and structure information of the segmented image. Based on the collected features a SVM classifier is classify the given input image whether it is disease affected or not.
From the survey it is clear that so many researchers are concentrated on plant disease classification not for virus classification which causes the disease. Hence keeping these concepts in mind we mainly focused on virus classification rather than disease classification. The implemented system architecture its functional block diagram is briefly summarized in below section.
III. METHODOLOGY
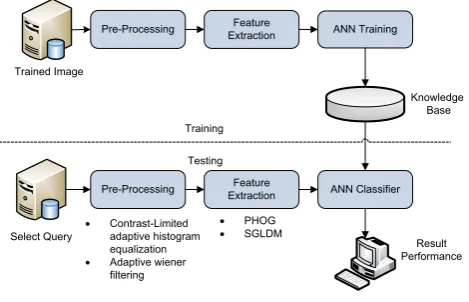
The proposed system architecture is represented in below Figure 1. The overall system working is divided into two sectors i.e. training and testing phase. In training phase the set of different plant virus which are responsible for specific plant disease. The input images are preprocessed by using contrast limited adaptive histogram equalization and adaptive wiener filters, both preprocessing steps remove the noise content involved in the given image. This preprocessed inputs are passed to feature files, feature file sub function is implemented by using PHOG and SGLDM feature extraction algorithms. The preprocessing block output is always as image whereas features files output is in the form of numbers (i.e. in proposed system).
Pre-Processing ExtractionFeature ANN Training
Pre-Processing ExtractionFeature ANN Classifier Knowledge
Figure 1: Proposed System Functional Diagram
The collected set of numerical features of the given input image is stored in .dat file. During training the collected feature file i.e. .dat of the set of input images are passed to ANN training function. Depending on the collected features an ANN module is create the knowledge base. In testing phase a real time image is considered to test the designed system response. Testing phase follows the same steps as training did, here also input image is first preprocessed by using contrast limited adaptive histogram equalization and adaptive wiener filtering. The shape and structure features of the image is collected by using feature extraction algorithm and extracted numerical features values are stored in .mat file for further technical analysis. The stored . mat files is loads in ANN classifier for image classification. The classifier designed such that depending on the trained feature file and a tested feature files are classified. The intermediate working of each block is briefly explained in below section.
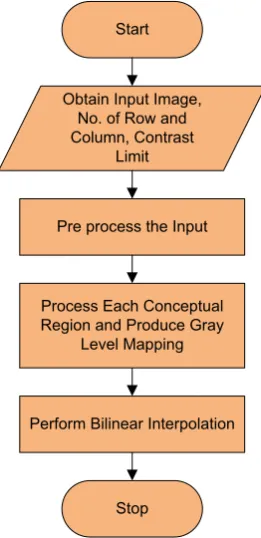
3.1. Contrast Limited Adaptive Histogram Equalization
is limiting from 0 to 1 [05]. The operational flow chart of the CHAE is shown in below Figure 1.2.
3.2. Adaptive Weiner Filtering
Weiner filtering is a linear filtering method used to deal with non stationalrity of the signal. The main purpose of using filtering method is used to denoise the given image. In the proposed system we used an adaptive wiener filtering is just to eliminate the effect of noise present at the given input image. The operation is called as preprocessing method, this preprocessed images passed to the feature extraction techniques for
Figure 2: Contrast Limited Adaptive Histogram Equalization
3.3. Feature Extraction
Image classification task is performed based on the set of features collected by using feature extraction algorithms. Based on the application dependent a specific feature extraction techniques are used to collect the color, texture and shape features of the given input image. In the proposed system we used a Spatial Gray Level Dependent Matrix (SGLDM) and Pyramid Histogram Oriented Gradients (PHOG).
A.Spatial Gray Level Difference Method
The spatial distribution of the gray level of each pixel is computed in SGLDM. The texture of pixel intensity
is arranged in second order conditional provability function. The application of different distance value and angle value presents the direction of texture of input image. In image analysis the angle value is limited with 0, 45, 90 and and distance value is always multiple of integer pixel value. The co occurrence matrix is formed for each angle values, the generated probability density function value is integrated to form a single SGLDM features[ 06].
B. Pyramid Histogram of Orientation Gradients
HOG is one of the robust feature extraction algorithm frequently used in object detection. HOG feature extraction technique frequently responses illumination, local geographic structure and photometric changes in the given image. In HOG given image is divided into a small operating block and for the corresponding block pixel magnitude and its orientation is calculated. To increase the spatial relationship between the oriented gradients is enhanced by pyramid of histogram of oriented gradients. A spatial pyramid HOG features are encoded in such way that obtain or extract information, the PHOG mainly present the shape information and spatial layout data for better image processing and analysis [07].
The collected SGLDM and PHOG numerical features are integrated and stored in .dat file for further image classification. The stored feature files are passed to the classifier for image classification.
3.4. ANN Classifier
Figure 3: ANN Classification Function
The computational equation involved in output classification is given Eq. (1)
{
∑
∑
}
Where data vectors (i.e. Input features) are represented by a variable x and the corresponding weight values are
denoted by the variable w. The system response for respective real time input images and its intermediate output i.e. CAHE and Weiner filtering output is briefly presented at the result section.
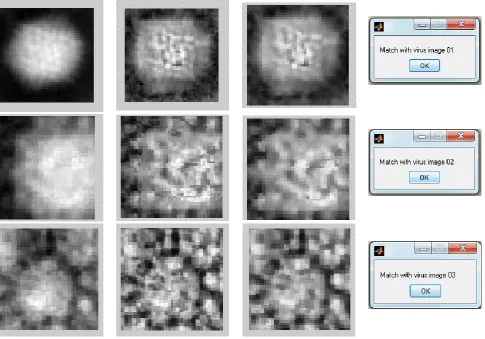
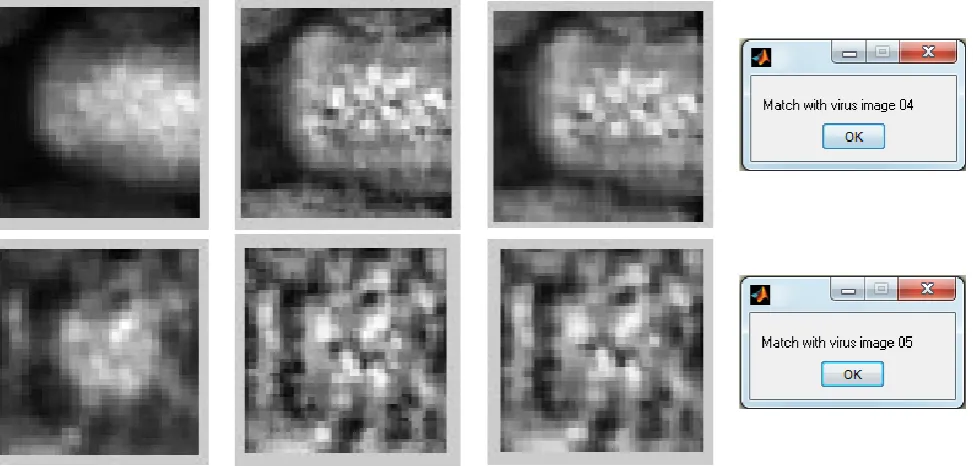
IV. RESULT
Figure 4 : (a) Input Image; (b) Contrasted Limited Adaptive Histogram Equalization; (c) Adaptive Weiner Filtering; (d) Classification Output
V.
CONCLUSION
In the proposed system we concluded that, implemented module more efficient in virus classification. In which five different plant virus which are responsible for plant disease are trained by using ANN classifier. The trained set of input image creates a knowledge base. A real time detected virus image passed as input to the testing section. Based on the collected features given virus image is classified. Result section proved that designed system present good accuracy in virus classification.
VI. REFERENCES
[1] Sujeet Varshney and Tarun Dalal, “Plant Disease Prediction using Image Processing Techniques – A Review”, International Journal of Computer Science and Mobile Computing, Vol. 5, Issue 5, pp. 394-398, 2016.
[2] Gopinath, S and S. Lalitha, "Plant Diseases Detection By Using Image Processing Techniques", International Journal Of Research And Innovation In Engineering Technology, pp. 1-5, 2017.
[3] Sabrol, H and K. Satish, "Tomato plant disease classification in digital images using classification tree", IEEE, 2016.
[4] Megha S, Niveditha C. R, Sowmyshree N and Vidya K, “Image Processing System for Plant
Disease Identification by Using FCM-Clustering Technique”, International Journal of Advance Research, Ideas and Innovations in Technology, 2017.
[5] Rajesh Garg, Bhawna Mittal and Sheetal Garg, “Histogram Equalization Techniques for Image Enhancement”, International Journal of Electronics and Communication Technology, Vol. 2, Issue 1, 2011.
[6] Ms. M. S. Priya and Dr. G. M. Kadhar Nawaz, “MATLAB Based Feature Extraction and Clustering Images Using K-Nearest Neighbor Algorithm”, IJAICT, Vol. 2, Issue 11, 2016. [7] Seyed Ali Amirshahi, Michael Koch, Joachim
Denzler and Christoph Redies, “PHOG Analysis of Self – Similarity in Eathetic Images”, the International Society for Optical Engineering, 2012.