The dynamic geometry of mass cell movements
in animal morphogenesis
VLADIMIR G. CHERDANTSEV*
Department of Biological Evolution, Faculty of Biology, Moscow State University, Russia
ABSTRACT There is an infinite number of interactions between morphogenetic processes of different time and space scales. How do these unfold in a regular series of mass morphogenetic movements to produce a basically simple and reproducible structure? I present a new morphoge-netic concept – the spatial unfolding (SU) of cell movements, whose definition rests on the correspondence between the continuous spatial series of cell shapes and the succession of changes in the shape of a single cell moving in an epithelial sheet whose shape is also subject to change. The change in the shape of moving cells is the only measure of their translocation both in space and time. The SU provides a morphodynamics description of mass cell movements which is completely independent of both an external coordinate system and external forces. The cell geometry of SU allows us to derive the future embryonic form from the actual one by a movement-shaping algorithm operating on the basis of positive and negative geometric feedbacks between the cell movement in the epithelial sheet plane and the epithelial sheet shaping, the feedback system providing a geometric alternative to Turing’s self-organization via reaction-diffusion systems. Putting together histological, quantitative morphological and experimental data permits us to isolate four SU, each acting in morphogenesis as an irreducible whole, which seem to include all real examples of epithelial morphogenesis in multicellular animals, from Coelenterates to Chordates.
KEY WORDS:
morphogenesis, embryogenesis, morphogenetic field, self-organization
Introduction
Alexandre Gurwitsch (1914) seems to have been the first who recognized that the form and spatial arrangement of embryonic cells may present a text which, provided that we know how to read it, carries information about directions and rates of a subsequent mass cell movement. Taking as an example the brain morpho-genesis of shark embryos, he noticed that in epithelial cells moving together in an epithelial sheet (ES), their long axes deviated from the normal curvature radii of the outer ES surface. If we continue each of these axes out from the ES contour and describe a new contour whose normal curvature radii are coinci-dent with the long axes of cells, then we get a new ES shape almost identical to that which is realized in the normal course of the brain morphogenesis. In Gurwitsch’s terms the orientation of long cell axes is “prognostic” in the sense that it permits, on the basis of the actual ES shape, to predict the direction of its change (Gurwitsch, 1914; 1922). In more mathematical language one could say that the orientation of long cell axes or cell separation boundaries imposes on the ES a vector field of a mass cell movement. Each cell moves outside the initial ES contour, the
*Address correspondence to: Dr. Vladimir G. Cherdantsev. Department of Biological Evolution, Faculty of Biology, Moscow State University, Moscow 119992, Russia. Fax: +7-495-939-4309. e-mail: [email protected]
Abbreviations used in this paper: DM, deviation mode; ES, epithelial sheet; MA, marginal angle; NM, normal mode; SU, spatial unfolding.
0214-6282/2006/$25.00
© UBC Press Printed in Spain
www.intjdevbiol.com
rate of its movement being proportional to the deviation angle between its long axis and the normal ES curvature radius at their intersection point at a given time. It is the constitution of such a field that and only that constitution, that permits us to derive the modes of morphological transformations from the actual and explicit morphology of embryonic tissues.
(slow-est) dynamic variables. For physical systems, the physical sense of the parameters of order is rather evident – the specific volume for one-component fluids, the local density of matter for solid bodies and so forth (for the details see Landau, Livshits, 1976). This, however, is not the case for biological morphogenesis. Even though the connection between the cell movement vectors and cell geometry is basically simple, we have no reason to assume that there exists a simple physical process or a cell shaping mechanism underlying the cell movement geometry. Cell shape is subject to change by many morphological variables whose number is potentially infinite and even uncountable because their interaction generates new morphological variables. It follows that we need to look for a description of cell movement patterns that would depend neither on the number of morphological variables, nor on the cells’ material composition.
The other problem concerns the causes of directional mass cell movements, as Gurwitsch’s field seems to ignore cell-to-cell interactions. His field is a heuristic principle, as it permits us to isolate the collective mode of individual cell movements. Each cell moves so as to minimize the deviation of its long axis from the normal curvature radius of the outer ES surface, this generating a new ES surface with the normal orientation of the cell’s long axes. To make sure that this movement is stable to small random fluctuations we need to postulate a feedback to the future surface which does not exist yet in material form, or to assume that the cell movement direction is simply a matter of extrinsic forces applied to cells in a given coordinate system. In the latter case, we come to a conclusion that the geometric cell movement algorithm is not
sufficiently geometric, as far as the fate of a cell depends on its position in an external coordinate system imposed on ES. The point is that in any system of external coordinates the form of a cell is, by definition, devoid of dynamics on its own. It splits into a set of morphological features whose values become the only subject to directional change. As for Gurwitsch’s field, this means that the deviation of a cell long axis from normal orientation is only an accidental feature of intrinsic cell dynamics and so we are in an infinite regress of reasoning. To avoid this, in the following section we define a special object, a spatial unfolding of a mass cell movement, which means dynamics being a direct consequence of form, not reducible to any set of accidental morphological traits.
The spatial unfolding (SU) of a mass cell movement – a
morphological object with inherently morphogenetic
properties
The definition of SU
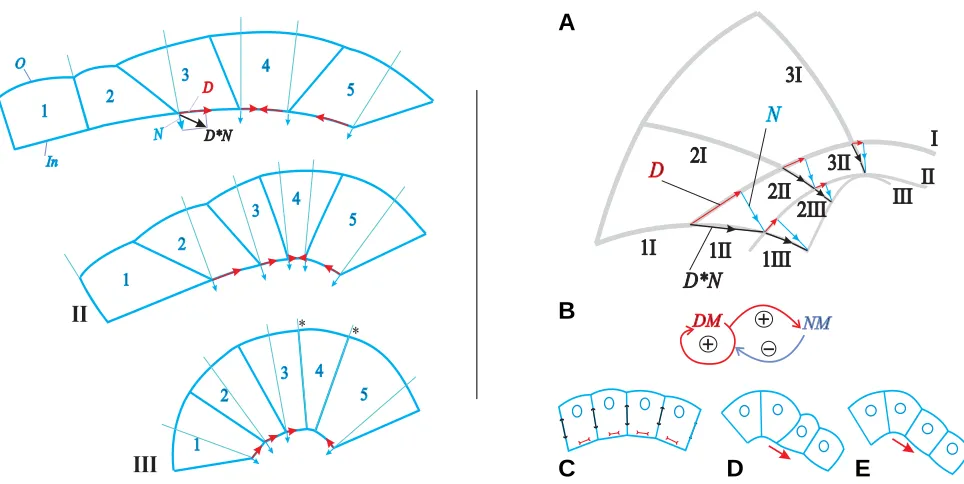
Our basic premise is that in morphogenetic systems the movement of an embryonic tissue is intimately connected with changes of its spatial shape. When epithelial cells move in ES their collective movement implies a directional change both in their own shape and in the shape of ES itself. The movement forms a spatial unfolding (SU) if a continuous spatial series of cell shapes corresponds to the succession of changes in the shape of a single cell (Cherdantsev, 1977; Dorfman, Cherdantsev, 1977; Cherdantsev, 2003). Cells can easily be replaced by areas consisting of cell groups or cell fragments due to the identity Fig. 1 (Left). Scheme of generalized spatial unfolding of a mass cell movement. Cells (1-5) move in the epithelial sheet plane (red arrows) shaping the surface which they move along (blue arrows).(I-III) represents the succession of the epithelial sheet movement-shaping corresponding to that of each single cell in the shape series 1-5. Abbreviations: O, outer; In, inner surfaces; Subtle lines, normal radii of curvature. D is the cell movement vector, whereas Nis the vector of shaping of the epithelial sheet surface. D*N is thus the movement-shaping vector. For other explanations, see text.
Fig. 2 (Right). Spatial unfolding (A, B) vs. other mass movement modes (C-E). (A) Spatiotemporal series of movement tracks (I-III) at intersections between the contact and free surfaces of cells 1-3. (B) Scheme of interaction between deviation (DM)and normalization (NM) of cell contact surfaces; (C) Mechanical mode (red, shrinking; black, stretching). (D) Dynamical and (E) kinematical waves (red arrows) of morphological rearrangements.
A
B
between changes in the shape and position of moving areas. Different positions inside an SU can always be identified with different shapes of the same area even when the boundaries of the moving area are not constant.
What is of the most importance is that in an SU, by definition, any robust trajectory of movement of the same area in time has a spatial analogue. In fact, a change in the trajectory of a given area is equivalent to that in the shape of a series of neighboring areas that form an SU. An SU permits us to treat the trajectories of movement as physical bodies. Therefore, as far as the change in the shape of a moving area is the only measure of its movement, an SU provides a description of mass cell movements which is completely independent of using both the external coordinate system and external forces applied to the moving areas.
A generalized model of Spatial Unfolding movement Our aim here is to outline a general and idealized scheme of SU morphogenesis leaving the real examples of SU to the next sections of this paper. The general pattern of SU movement is shown in Fig. 1. For simplicity we consider an idealized two-dimensional monolayered ES consisting of cells in which it is
ES contour whose curvature is of a higher degree than in the preceding one and the orientation of cell boundaries is closer to the normal curvature radii. When both separation boundaries between a cell and its neighbors acquire normal orientation (see cell marked by an asterisk in Fig. 1), the movement of a cell along an ES is arrested and so is the shaping of the ES at this point.
The cell movement-shaping pattern both in space and time DM is immediately followed by NM both in space and time. Both in space and in time the absolute values of the D and N vectors are subject to increases from zero to a maximum value and then to a decrease to a zero point corresponding to normal orientation of a cell boundary at a new point of a new ES contour.
The slope of cell movement tracks, whose measure is a proportion of D and N vectors lengths (Fig. 2A), progressively vanishes along with the progress in ES shaping (cf. the slopes of tracks 1, 2 and 3 at the intersection points with the inner ES surface at the succession of steps I-III of ES shaping). It follows that NM, yet it arises as a result of ES shaping by DM, spreads in space and develops in time faster than DM. Both the mass movement of cells in ES and ES shaping arrest when all cell
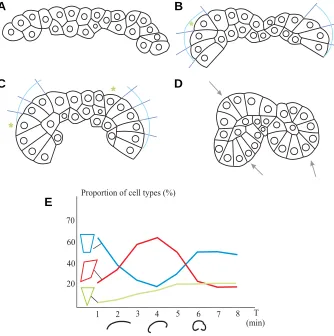
Fig. 3. Movement-shaping succession of reparative morphogenesis in the frog gastrula ectoderm(A-D) and its quantitative dynamics (E). (A-D) Shown by blue in (B,C) are the geometric constructions of future contours of the epithelial sheet subject to the unfolding of epithelization. Asterisks, triangular cells; arrows in (C), epithelial spheres. (E) Ordinate, the proportion of normally oriented (blue), oblique (red) and triangular (green) cells; abscissa, time after the dissection of fragments; shown under the abscissa are the epithelial sheet contours.
sufficient to distinguish their conventional in-ner and outer surfaces (free cell surfaces) and cell separation boundaries (contact cell surfaces). For each cell and for each cell surface fragment, their movement in the ES is a composition of a planar (tangential, D-vectors in Fig 1) and normal (radial, N-D-vectors in Fig. 1) modes of movement. We suppose, for simplicity, that it is only the conventional inner surface of ES that is subject to active shaping.
The deviation mode (DM)
At each step of ES movement (steps I-III in Fig. 1) cell separation boundaries (bound-aries between cells 1-5 in Fig. 1) form a continuous series of deviations from normal orientation that reproduces a succession of shapes of the same cell whose boundaries move in the ES surface plane. DM implies that new ES cells are recruited into an SU movement (see cells 2 and 1 in Fig. 1). This occurs when a cell separation boundary devi-ates from normal orientation in order to con-tinue the planar movement of a neighboring cell.
The normal mode (NM)
As cells move along an ES, their bound-aries elongate so as to normalize their orien-tation (N-vectors in Fig. 1). Then, the planar cell movement is accompanied by a local increase in ES curvature at the intersection points between the free ES surface and cell separation boundaries (cf. ES shapes at steps I-III in a neighborhood of the same cell aries in Fig. 1). It follows that, as cell bound-aries move along an ES, there arises a new
A
B
C
D
separation boundaries acquire normal orientation. (In Fig. 2A this has happened only with boundary 1 at step III.) At that time and space the ES acquires a spatially uniform shape. Therefore, the mass movement of cells in SU continues unless the spatial shape of SU becomes the homogeneous one.
Special attention should be paid to the relationship between cell movement tracks and that of ES shaping. Consider, as shown in Fig. 2A, the SU of cell movement tracks at intersections between cell separation boundaries 1-3 and the inner ES surfaces at successive stages I-III of ES shaping. The movement vector of each intersection point, D*N, is a composition of shifting this point along the actual ES surface (vector D) and this surface shaping (vector N). The movement forms SU only provided that the composition D*N does exist, which means that vectors of DM and NM movement applied to different points of the actual ES contour fall into the same point of the future ES contour. In this and only in this case, the spatial series of cell movement vectors applied to the same ES surface determines the fate of a given ES surface point in time.
The basic difference between SU and common vector fields of a movement of material particles consists in two different points of the actual ES surface falling onto the same point of a new ES surface (see the disposition of points united by vectors in Fig. 2A). This means that the fate of each ES point, as far as it moves in SU, depends not on its own position, but rather on the shape differ-ence between its own locality and that of neighboring ES points. One can say that the form of an area generates a vector of its own movement because, among a variety of movement trends, the area selects those that can be readily continued by shaping the neighboring areas and vice versa. A system with such a kind of
relationship between the form and its movement cannot be covered by a correlated dynamics of any set of morphological or other variables, nor can the form itself be molded into morphologi-cal or other substantial gradients.
In summary, the movement of SU is based on a feedback between the movement of cells in ES line up (DM component) and change in ES shape (NM component). General relationships betweennDM and NM are shown in Fig. 2B. DM is a self-maintaining movement component because of a positive feed-back loop between the movement of a cell separation boundary and change in the shape of a cell itself (cf. Fig. 1). When the intersection point between the cell boundary and ES surface moves in the ES surface plane the cell elongates in this movement direction, promoting the intersection point to move further in the same direction. On the other hand, DM is followed by MN which, by increasing ES surface curvature and normalizing the orienta-tion of cell boundaries, destroys this positive feedback.
One can easily recognize in this scenario a canonic scheme of interactions between the “activator” and “inhibitor” in reaction-diffusion systems (Turing, 1952; Meinhardt, Guirer, 1980; Belintsev, 1991). DM represents a morphodynamics analogue of activator, while NM – a morphodynamics analogue of inhibitor, which, as we can see for SU, are not required to be material substances. As long as MN spreads along ES faster that DM does, SU movement fits to what is generally required for dynamic systems to be capable of self-organization (Belintsev, 1991).
Spatial Unfolding vs. alternative Epithelial Sheet shaping modes
In order to better understand the organization of a mass cell movement subject to SU, it is useful to compare it with alternative, or perhaps complementary, approaches to morphological trans-formations. Consider a simple and idealized example of morpho-genesis – the conversion of an almost flat ES into the sphere fragment (see Figs. 2C-E). Besides SU, there exist three com-monly accepted ways in which this could occur:
(i) Epithelial Sheet morphogenesis as a mechanical effect of active and coherent cell shaping
The simplest realistic way in which a definite cell shaping mode brings about ES bending of the inner surface inside is the active contraction of the inner ES surface (Gustafson, Wolpert, 1967; Odell et. al., 1981). A corresponding succession of morphological states both of ES cells and the ES itself is shown in Fig. 2C.
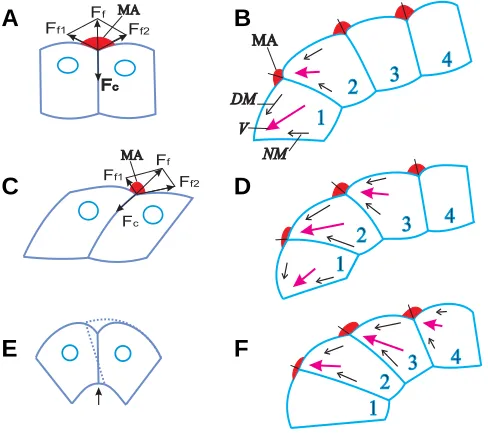
Whatever might be the intrinsic nature of forces operating on ES, the system as a whole should be in mechanical equilibrium, which means that processes that disturb the equilibrium occur at much slower rates (longer time scales) than those returning ES to the equilibrium state (for the details see Beloussov et. al., 1975; Oster et. al., 1983). Then, at any moment of ES shaping there must be equilibrium between forces that contract the inner ES surface and forces that stretch cell separation boundaries, as shown in Fig 2C. In order to equilibrate the contraction and expansion of opposed free surfaces, the cell separation bound-aries have to elongate just along the normal ES curvature radii, immediately removing any random deviations from normal orien-tation. There is only a direct connection between the elongation of each individual cell and ES shaping, with no feedback to cell elongation itself. The last, but not the least, difference with SU is Fig. 4. Cell shapes and shaping forces (A-C) and spatial unfolding of
epithelization (D-F). (A,B) Mechanical equilibrium of tensile forces (for their designations, see text). (C) Instability of equilibrium at a curvature maxima (black arrow). (D-F) Movement-shaping succession of the epithe-lization of cells 1-4; the marginal angles (MA) are shown in red; red arrows, movement-shaping vectors (V); black arrows, deviation mode (DM) and normalization mode (NM).
A
B
C
D
With the model of a wave of cell contact interactions, SU shares the principle of recruiting new cells into the mass cell movement at cell separation boundaries. Both in the contact interaction wave and SU there is a natural connection between the cell movement and changes in cell shapes proceeding in a way so as to cause neighboring cells to initiate the same cell shaping process.
The difference, however, is in matching the spatiotemporal scales of realizing the shaping potencies of a cell in cell shaping and preparing the same shaping potencies in the neighboring ES cells. The wave models treat the formation and realization
Fig. 5. Partitioning of the epithelial sheet into cell-to-cell interaction units (A) and real examples of the unfolding of epithelization (B-D).(A) S1-S3, S-units of cells 1-3; F1-F2, F-units bordering these cells (for detailed explanation, see text). Arrows, movement-shaping vectors. (B,C) gastru-lation succession in a hydroid Dynamena pumila (arrows, maxima of curvature). (D) Somitogenesis in lamprey. Pres, presomite mesoderm; S, somite; S’, a new forming somite. From Cherdantsev, 2003.
that the whole ES must have previously fixed boundaries, both for mechanical and morphological reasons.
(ii) Epithelial Sheet morphogenesis as a contact cell interaction wave spreading in the Embryonic Sheet plane
Both theoretical consideration (Turing, 1952; Goodwin, 1994) and direct morphological and experimental evidence (Cherdantsev, 1977; Beloussov, 1998) suggest that the shape changes in ES cells are capable of traveling cell-to-cell by the interaction of neighboring cells at their separation boundaries. For the case of morphogenesis that we are considering, this provides the morphodynamics pattern shown in Fig. 2D. As in SU, ES areas consisting of differently shaped cells refer to the onset (cells with no preponderant elongation axis) and the end (cells elongated across the ES plane) of the same cell shaping process. Each unelongated cell tends to adjust its own shape to that of its more elongated neighbor and so a front of the cell elongation wave (see the arrow in Fig. 2D) spreads in the ES plane, recruiting new cells into the cell elongation process.
The distinction between a cell shaping wave and SU move-ment is that in wave spreading one can, by definition, separate a local morphological state which is subject to spread with no change in the shape of its own. Shown in Fig. 2D, this is the oblique cell separation boundary traveling from one to another cell. For SU this is not the case, as one cannot separate spreading from shaping (cf. Fig. 2D and Fig. 1).
(iii) Epithelial Sheet morphogenesis as a kinematic wave The term “kinematic wave” has been proposed by Zeeman (1972) in order to stress that the wave of morphological rear-rangement can spread from one cell to another with no cell-to-cell interaction at all. The wave arises as a result of a difference in time at which cells begin the same shaping processes and (or) in the rates of preparing this process in different ES cells. This is illustrated in Fig. 2E. The only distinction from the process outlined in Fig. 2D is the absence of any morphological signs of cell-to-cell interaction, even at a separation boundary between the domains of elongated and unelongated cells. The model stresses that preparing the shaping potencies inside a cell can occur on a time scale which is fairly different (much slower) than that of the shaping itself, up to the complete loss of interaction between these processes.
Spatial Unfolding as a synthesis
The SU concept shares some and rejects other essential features of the morphogenetic modes listed above. SU shares a basic and generic principle of the mechanical mode – the mechanical equilibrium principle which makes it possible to derive a spatial distribution of mechanical forces that are applied to a cell directly from its shape (Beloussov et. al., 1975; Beloussov, 1998). However, the mechanical mode implies that preparing the cell morphogenetic potencies is a process on a greater spatial scale and slower time scale than their realization in cell shaping. In terms of the opportunity of recruiting new cells into embryonic anlagen the mechanical mode per se only fits embryonic anlagen whose boundaries are defined beforehand. Maybe this is the reason why most experienced embryologists (see, for example, Waddington, 1972) tended to shift mechan-ics to the very edge of developmental biology.
of shaping potencies as consecutive processes being differ-ently scaled both in space and time. It follows that the shape changes in different ES loci can be subject not to continuous, as in SU, but rather to threshold interactions. In contrast to that, the SU claims the spatiotemporal identity between the realization of shaping potencies in a given cell and formation of potencies to the same shaping process in neighboring ES cells. Then, one can consider the wave per se as a particular form of SU in which the continuous and intimate connection between the movement of cells over ES and shaping ES subject to movement is replaced by a threshold.
Finally, the kinematic wave and SU are based on a common presumption that ES has a planar (lateral) polar axis whose axial symmetry is borrowed from that of time. This presumes that ES cells that are competent for SU formation have a similar developmental history but differ in their time rates and/or starting points of their development. This helps in the choice of
A
B
C
a preponderant direction of mass cell movement while all the rest – the form of a given embryonic anlagen, fate of its cells and number of cells recruited into its morphogenesis – can depend on the SU movement-shaping pattern.
The epithelization SU
A referent example: the reparative morphogenesis of iso-lated Epithelial Sheet fragments in common frog (Rana temporaria L.) embryos
It is known that ventral fragments of amphibian gastrula ectoderm, when dissected from the embryo, in a few minutes change their initially flat shape and form a closed ES whose shape represents a set of epithelial spherical fragments of different radii of curvature (Beloussov et. al., 1974). This is an example of a reparative morphogenesis, as the dissected fragment closes its wounded (denuded) inner surface.
As shown in. Fig. 3A, the outer ectoderm, just after the dissection from the embryo, is not a true ES. The ectoderm cells acquire the typical epithelial shape only with shaping of the ectoderm layer when they line up by their collective movement. Both the movement and shaping of cells start at free ectoderm margins and spread in the ectoderm surface plane by shaping this plane itself. The almost perfect correspondence between the spatial series of cell shapes at the ectoderm fragment margins and the succession of steps of marginal zone shaping (cf. Figs. 3B-D) allows us to consider this movement-shaping as the simplest SU which we call the primary epithelization SU, as it allows for the formation of a true ES from non- or weakly epithelial cells. The movement of this SU results in the forma-tion of ES fragments (see arrows in Fig. 3D), each having a
positive curvature on its own.
Morphodynamics algorithm
In order to derive, in a series of marginal zone shapes, each new ES shape from the preceding one, it is sufficient to extend cell separation boundaries out from the outer ES surface and then to describe a new ES contour that normalizes the contact cell sur-faces’ orientations at their new positions in a new ES (see the contours described by the light lines in Figs. 3B, C). This, purely geometric, algorithm shows a positive correlation between the deviations of cell contact surfaces from normal orientation and distances at which corresponding points of the ES surface shift from their initial position. As it is inherent to SU, both correlations are both in space and time – in any other case the algorithm could not have provided an approximation to the real marginal zone shape which we observe at later steps of morphogenesis.
The reason for replacing the one-step geometric algorithm by a multi-step and potentially continuous series of cell-to-cell interac-tions is that cell shaping is subject to active cell-to-cell spreading. For morphogenesis of isolated ectoderm fragments this can be proved by analyzing the quantitative morphological data (Cherdantsev, Scobeyeva, 1996). Fig. 3E shows how the propor-tion of differently shaped cells depends on the fragment shaping whose succession is shown under the abscissa of the graph. The majority of initially “rectangular” non-epithelial cells acquires the oblique orientation and then, when molding the fragment shape, almost all cells become again “rectangular”, but now epithelial cells.
In Fig. 3E, besides the oblique and rectangular cells, special attention should be paid to “triangular” cells, shown in Figs. 3B, C by the asterisks. Their proportion stops increasing just at the transition phase between the mass deviation of cells from normal orientation and mass normalization. It follows, first, that the curva-ture increase arrests the recruitment of new cells into epithelial spheres and, second, that the number of cells in a given sphere and the sphere radii are matters of random choice. The last property is known to be inherent to self-organization processes (Prigogine, 1980). The epithelization SU should be included in this scope.
In fact, epithelization can be initiated by any random heteroge-neity in the outer surface curvature. To make this point clearer, remember that in the equilibrium state the relationship of forces operating on adjacent ES cells can be derived from the marginal angle (MA) between their outer surfaces (Thompson, 1942). As shown in Fig. 4 A,B, the shape of adjacent ES cells is a matter of equilibrium between the forces Ff whose components Ff1 and Ff2 are the active tensions of corresponding outer surfaces and FC is the active tension of the cell contact surface. The deviation of the cell contact surface from normal orientation presumes MA asym-metry which, in turn, presumes deviation in the direction of the outer surface with a higher active tension (see Fig. 4B).
Now assume that the intersection point between the cell contact and outer surfaces falls at a maximum of the outer surface curvature, as shown in Fig. 4C. The local curvature increase tends to push cells aside (see the arrow in Fig. 4C) while the cells themselves tend to increase their contact surface area. The normal contact surface orientation proves to be unstable because any small fluctuation leads it away from the curvature maximum, making MA asymmetric and promoting increase in the contact surface area (see the dotted cell contour shown in Fig. 4C). This is Fig. 6. The archenteron formation in sea urchin (A-D). OS (Api), outer
surface (apical); IS, inner surface (basal); mes, mesenchyme; aarc, arch-enteron arc; larc, lateral archarch-enteron walls; arrows, archarch-enteron bound-aries. The blue dotted lines are the geometric constructions of future ES contours. From Cherdantsev, 2003. For other explanations, see text.
A
B
the first step of the ES movement algorithm. The next steps are shown in Figs. 4D-F, the arrows inside the cells corresponding to the cell movement vectors, DM and NM, V being the resulting movement-shaping vector of ES:
(i) The contact cell surface between cells 1 and 2 deviates from its normal orientation, the MA between their outer surfaces becom-ing asymmetric.
(ii) The contact surface lengthening between cells 1 and 2 tends to normalize this surface orientation at the expense of increasing the outer ES surface curvature, the MA between these cells increasing and symmetrizing.
(iii) The length difference between the contact surfaces of cell 2 with its neighbors, cells 1 and 3, provides the shape difference between the outer surfaces of cells 2 and 3, so that the MA asymmetry propagates to the separation boundary between these cells.
(iv) Step (ii) repeats at the contact surface between cells 2 and 3, thus translating step (i) to the contact surface between cells 3 and 4.
It is obvious that the algorithm ends with the formation of an epithelial sphere fragment, that is, a fragment with a single ES radius of curvature. Thus, the epithelization SU represents the simplest variant of the generalized SU, shown in Fig. 1, in which the interaction is only between cell separation boundaries and the outer ES surface. As follows from the algorithm, DM is a matter of a geometric positive feedback between the deviation and length-ening of cell boundaries and has a negative feedback to NM. As far
as NM arises as a result of DM, we get morphodynamics that mathematically replaces what is required from the interaction between the activator and inhibitor in reaction-diffusion systems. The domain ES structure arising as a result is that of spherical ES fragments separated by triangular or non-epithelial cells.
From a single cell moving over a substrate to the mass movement of Epithelial Sheet cells
MA asymmetry leads to a continuous series of transitions from the movement of a single cell over a substrate and the movement-shaping of ES cells in the epithelization SU line up. We should take into account the simple fact that each separation boundary be-tween ES cells consists of two adjacent surfaces of neighboring and, potentially, differently shaped cells. The real ES consists of alternating structural units which can be (conventionally) called S-and F-units. Each S-unit is circumscribed by surfaces of the same cell while each F-unit is circumscribed by two adjacent cell surfaces (Fig. 5A).
Provided that cell separation boundaries have only normal orientation, the distinction between S- and F-units would have been meaningless because the shape difference between two adjacent surfaces that form a separation boundary between two neighboring cells would have been out of place. This distinction, however, becomes important when a cell boundary deviates from its normal orientation. As the surfaces of a given separation boundary can deviate from normal ES radii of curvature in different degrees, each F-unit acquires asymmetry on its own. As shown in Fig. 5A, each S-unit orients its movement not along its own boundary, but rather along the F-unit surface bordering the next S-unit. Considering the spatial series of F- and S-units as a succes-sion of shape changes in the same cell makes it clear that it is the spatial asymmetry of each F-unit which is equivalent to that of MA, that provides a movement vector for each S-unit. In contrast to common differential equations, even referred to non-local dynami-cal systems, the movement vectors are not in the points subject to movement, but rather in their neighborhood.
The movement-shaping of F- and S- ES units has a basic similarity with the movement of a cell over a substrate providing that there is a feedback from molding this substrate by the moving cell to the cell movement itself. In the simplest case, when a fibroblast moves over glass, the substrate is not subject to deformation and so there is no feedback at all. But, if one replaces a glass by a tensile material, for example, a thin layer of silicone rubber, then the contraction of a cell’s leading edge deforms the substrate as shown by the formation of folds (Harris, 1984). These folds are the analogs of “rigidity ribs” that are more resistant to deformation than any smooth substrate surface. It follows that if the leading edge happens to anchor the fold, then the preponderant cell movement direction will be towards the fold. Then there is a good likelihood that new folds will originate at this place and so new cells will concentrate at same area (Harris, 1994). It remains only to replace the external substrate by a neighboring ES cell and so we get the simplest mass cell movement SU, that of epithelization.
Morphogenetic area
In normal development the formation of primary ES from non-epithelial cells is common to those representatives of Cnidarians whose development passes through the morula stage. Cleavage does not provide ES formation, leaving this to later developmental Fig. 7. Spatial unfolding of invagination (A-C) and archenteron
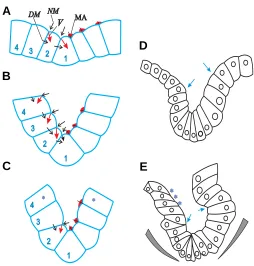
forma-tion in the frog embryo (D,E). (A-C) Movement-shaping succession of cells 1-4. Red arrows, movement-shaping vectors (V); black arrows, deviation mode (DM) and normalization mode (NM); MA, marginal angles (red); asterisks, the arrest of cell movement. (D) Intact superficial cell layer, (E)Its shape after dissection (wedges). Arrows, archenteron boundaries. From Cherdantsev, 2003.
A
B
C
D
stages. The early development of a marine hydroid, Dynamena pumila L., provides a clear-cut and well-studied example (Cherdantsev, Kraus, 1996; Kraus, Cherdantsev, 1999).
The morula of Dynamena is a mass of non-epithelial cells of irregular and variable shapes, as is the shape of the morula itself (Fig. 5B). Epithelization starts at any arbitrary maximum of the outer surface curvature, shown in Fig. 5B by arrows and both the spatial and time series of shaping the primary ES in normal embryogenesis are almost identical to that in the reparative morphogenesis of amphibian ectoderm fragments. As a result, many embryos pass through a stage at which they represent variable sets of spherical ES fragments, as shown in Fig. 5C. Then these epithelial spheres join together to form a single ES.
In embryogenesis of most multicellular animals the primary ES of the blastula is a result of spatially ordered cleavage, with a weak relation to mass cell movements. In this case the epithelization SU acts at later developmental stages by shaping the primary endo-derm ES and its derivatives. Taking into account the allocation of DM and NM vectors, shown in Figs. 4D-F, makes it clear that the epithelization SU operates on convex ES surfaces whose surface area is subject to increase. In normal embryogenesis this hap-pens only with endoderm (Cherdantsev, 2003).
In lamprey embryos (Lampetra flaneri L.) the epithelization SU acts in somitogenesis (Cherdantsev, 2003). Each new somite presents an epithelial sphere originating from the unsegmented mesoderm consisting of weakly or non-epithelial cells (Fig. 5D). Cells at the free mesoderm margin (see S’ in Fig. 5D) move at a distance which is proportional to the deviation of their long axes from normal orientation. Therefore, their movement outlines the shape of a new somite, while the separation of this somite from the rest of mesoderm triggers the next somite shaping.
Morphogenetic constraints
We call the morphogenetic constraints those properties of SU that impose the upper limit of complication both in the movement-shaping of SU and morphological structures arising as a result. Insofar as SU movement does not depend on external coordi-nates, these constraints concern only the space-time geometry of a mass cell movement.
The upper limit of structuring in the epithelization SU is the formation of spherical ES fragments that become new morphoge-netic units – to join together, as in the formation of primary ES, or to set apart as in somitogenesis. The reason why this cannot be a more complicated form lies in the relationship between the elongation of cell boundaries and shaping the ES free surfaces. Remember that cells in the epithelization SU are polarized almost the same as a single cell that moves on an external substrate (see Fig. 5A). The outer (lateral-apical) edges of ES cells behave like the anterior end, while the inner (basal) edges – like posterior end of a single cell and the difference is only that the polarization of cells in ES is imprinted in shaping its outer and inner surfaces. Thus, the epithelization SU establishes a purely geometric distinction between the outer and inner ES surfaces, with no reference to either their origin or position in the embryo. Yet the outer surface of a secondary ES setting from the endo-derm was once the inner surface of blastula, we can consider it as the outer one because it outlines the anterior cell edges. This is to say that in biological morphogenesis, the positive ES curvature is that surface correlated with the elongation of cell boundaries.
As this elongation is a basic premise of ES integrity, as shown in Figs. 4A, B, it follows that the formation of spherical ES fragments is a prime basis of mass cell movements.
Invagination Spatial Unfolding
A referent example: archenteron formation in sea urchin embryos (Strongylocentrotus sp.)
To a first approximation the sea urchin blastula represents a closed spherical ES, archenteron formation starting with loosen-ing and partial destruction of the ES at the site of the archenteron initiation. This is manifested in decreasing MA between the neighboring cells at their inner surfaces which increases the inner ES surface area and makes the initially convex ES become flat (Fig. 6A). Manifested in all these events is the inversion of the initial ES polarity, which starts by migration of nuclei from their initial position at the outer (primary anterior) cell edges towards the inner cell surfaces (see cells marked by asterisks in Fig. 6A) and terminating in the emigration of cells from the ES (the mesenchymal cells shown in Fig. 6A).
Thus, at the onset of gastrulation, cells with inverted polarity have only an individual movement mode. The collective mode arises when these cells, instead of leaving the ES, bend the outer embryonic surface inside the embryo. Thus the centripetal move-ment of individual cells becomes the movemove-ment-shaping of the ES (see Fig. 6). There arises a new SU – the invagination SU – allowing for the formation of ES negative curvature. The corre-Fig. 8. Lateral flow unfolding. (A-D) Gastrulation succession, from (A,C) to (B,D) with (A,B) being external views and (C,D) being sagittal sections, in Lymnea stagnalis. The dotted line represents the construction of the future contour (cf. C,D); (E-G) Movement-shaping succession in cells 1-4. For designation of movement vectors, see Fig. 7; for other explanations, see text.
A
B
C
D
spondence between the spatial series of cell shapes and time succession of individual cell shaping is obvious, when looking at consecutive steps of the archenteron formation shown in Figs. 6A-D.
Morphodynamics algorithm
To get a future ES shape from the present one it is sufficient to continue cell boundaries beyond the limits of the inner ES surface and then to describe new ES contours, shown in Figs. 6A-C by the dotted lines, adjusting cell boundaries to normal orientation. As the inner ES surface area is subject to increase, this is possible only by shortening the cell boundaries.
It follows that each cell boundary is a matter of two movement-shaping components. One (DM) is the rotation of a cell boundary towards the maximum of ES negative curvature and the other (NM) is the shortening of this boundary so as to normalize its orientation. The algorithm of SU movement, shown in Figs. 7A-C, starts when both boundaries of the same cell deviate from normal orientation. As in any section perpendicular to the ES plane, the invagination SU has a central symmetry, the cell movement vectors, DM and NM and the resulting ES movement-shaping vector, V, are shown only on the left side of the ES, while MA are shown on the right side. The algorithm steps are:
(i) The boundary between cells 1 and 2 shortens so as to normalize its orientation by increasing the negative ES curvature and so the MA between these cells becomes the asymmetric one (see Fig. 7A).
(ii) The boundary between cells 2 and 3 rotates towards the
negative ES curvature maximum so as to decrease MA asymme-try by equalizing the outer surface areas of cells 1 and 2 (see Fig. 7B).
(iii) The boundary between cells 2 and 3 shortens so as to normalize its orientation, which means step (i) is translated to the boundary between the cells 2 and 3 (see Fig. 7C).
The algorithm continues until each of V vectors shown in Figs. 7A-C deviates from normal orientation in the cell movement direction. This holds if and only if, in the spatial series of V there are no vectors with parallel orientation. The algorithm is arrested when this condition is not fulfilled and there arise cells with parallel orientation of their separation boundaries deviating from the ES radii of curvature in a direction that is opposite to that of the planar cell movement (see cells marked by the asterisks in Fig. 7C).
The complication, as compared to the previous SU, is that the invagination SU acquires a domain structure on its own, the domain boundary passing between the hemispherical archenteron arc consisting of bottle-like cells and the cylindrical archenteron walls consisting of “backward deviated” cells (see Fig. 6D). This domain boundary arises as a result of interaction between the contact and free ES surfaces, which has the same pattern as that between the activator and inhibitor in reaction-diffusion systems. Each ES cell preserves a positive feedback between the apical contraction and basal enlargement which is proper to a mesen-chymal cell leaving the ES at the onset of gastrulation (cf. Figs. 6A and D). However, as long as cells remain in the ES line up, the sliding of cell boundaries along the ES, which decreases the apical surface area in each cell, becomes a negative feedback for ES shaping. This is the same as having an inhibitor that destroys a positive feedback loop for activator dynamics.
Morphogenetic area and constraints
In animal morphogenesis there are three types of mass mor-phogenetic movements subject to invagination SU. One is the primary invagination of a primary ES – the formation of a new ES (archenteron) consisting of cells with inverted polarity, as pared to that of cells of the primary ES. The second type com-prises all the cases in which the archenteron or archenteron fragments arise from non-epithelial cells. The third type refers to all epithelial derivatives of the ectoderm ES in vertebrates, the formation of sensory placodes (except the eye anlage), gill arches and oral invagination being examples of the same movement-shaping process (for the details see Cherdantsev, 2003).
The evolutionary stability of SU is striking. Shown in Figs. 7D, E is the archenteron formation in the embryos of a common frog, Rana temporaria L. Fig. 7D presents the intact archenteron shape (only the superficial layer of cells is shown), while Fig. 7E shows the archenteron fragment dissected from the embryo and fixed a few minutes after isolation. Comparing these figures makes it clear, first, that the invagination SU movement-shaping can develop in a few minutes, just as the epithelization SU did (see Fig. 3). Second, even though the evolutionary distance between the amphibian and sea-urchin embryos is enormous, the forma-tion of the archenteron is subject to the same the movement– shaping pattern. In amphibian embryos the distinction between the hemispherical arc and cylindrical walls of the archenteron, whose domain-separation boundary is shown in Fig. 7E by the arrows, perfectly corresponds to that in sea urchin embryos. The asterisks in Fig. 7E show the origination of a new SU considered Fig. 9. Topology and real examples of the lateral flow unfolding. (A)
Archenteron shape in spiralians; arrows, movement vectors; for other explanations, see text. (B) Three-dimensional image of the spiralian gastrula; BL, blastopore; LF, lateral flow; I, invagination; M, stem meso-derm cell; shaded is the archenteron roof.(C, D) Inward migration of the M cell at the cusps (asterisks) bordering the dorsal blastopore lip. (E) Histological structure of the Amphioxus neurula; shown is the dorsal half of the embryo. N, neural plate; Ch, notochord; S, somites; shown in blue are the constructions of future epithelial contours (modified from Cherdantsev, 2003).
D
E
A
B
in the next section.
As for the morphogenetic constraints, the connection between the individual and collective cell movement modes is still too intimate, only the reaction of individual cells to ES shaping being collective in the strict sense. As the direction of NM vectors is determined by that of individual cell polarities, there is no oppor-tunity of changing the sign of the ES curvature in the shaping process.
Lateral flow Spatial Unfolding
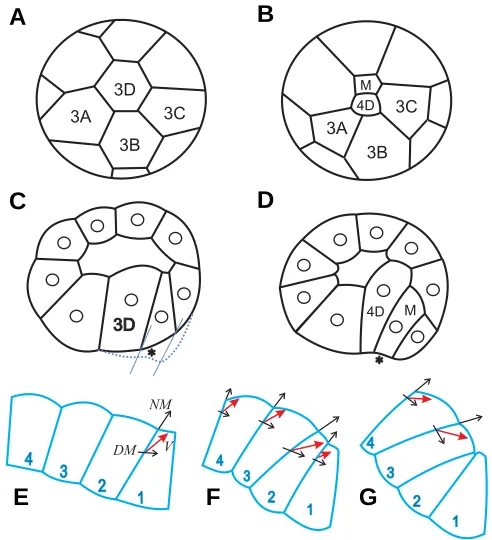
A referent example: gastrulation in a representative animal with spiral cleavage, the snail Lymnea stagnalis L.
In Lymnea embryos, as in other representatives of animals with uniform spiral cleavage, the dorsal macromere (see Fig. 8A) and its descendants, cells 4D and M (see Fig. 8B), move in the plane of the outer embryonic surface towards the centre of the vegetative hemisphere of the embryo by decreasing their outer surface area (Mescheriakov, 1975). Analyzing this movement in the sagittal section plane makes it clear (see Figs. 8C, D) that the cell separation boundaries deviate from the normal orientation, the deviation angle being a measure of the planar cell movement both in the space and time.
Although it may seem to be unusual to consider embryonic cells subject to regular cleavage as a matter of cell interaction, the experimental data show this to be the case (Arnolds et. al, 1983). We thus encounter a new SU that forms ES negative curvature not by shortening, but rather by lengthening the cell boundaries – the lateral flow SU. In the referent example the SU consists of only a few cells, this number being quite sufficient for the analysis of the mass cell movement geometry.
Morphodynamics algorithm
The method of constructing the new ES contour on the basis of the initial one is shown in Fig. 8C (cf. the dotted ES contour in Fig. 8C and that at the following step of real morphogenesis which is shown in Fig. 8D). It follows from this construction that the cell boundaries elongate at the expense of decreasing the outer cell surface area. This provides the possibility of changing the sign of the outer ES surface curvature without inverting the anteroposte-rior axis direction in each cell.
The connection between the elongation of cells and shrinking of their outer surfaces affords for epithelial cells a new opportunity of leaving the ES (as compared to that in sea urchin gastrulation, see Fig. 6). In normal gastrulation of Lymnea (and other animals whose early development is subject to spiral cleavage) this happens with a stem cell of the axial mesoderm (see cell M in Figs. 8B and D). Note that this cell leaves the ES just at a bending point between the concave and convex outer ES surface areas marked in Fig. 8C, D by the asterisks. Therefore, the stem mesoderm cell may be not a special cell, but rather a cell at special place selected by reason of its dynamical geometry.
The SU movement algorithm is shown in Figs. 8E-G. As in previous SU, DM and NM are the movement vectors and V is the resulting movement-shaping of the ES. The movement starts with a deviation of a boundary between cells 1 and 2 from normal orientation arising as a result of decreasing the outer surface area of cell 1 (Fig. 8E) The next steps are:
(i) The boundary between cells 2 and 3 deviates from normal
orientation because of shrinking of the outer surface areas of cells 1 and 2 (Fig. 8F).
(ii) The boundary between cells 1 and 2 elongates at the expense of further shrinking of the outer surface of cell 1 so as to normalize this boundary orientation and so the outer ES surface acquires negative curvature (Fig. 8F).
(iii) Step (i) is translated to the boundary between cells 3 and 4 and step (ii) to the boundary between cells 2 and 3 (Fig. 8G).
It follows that the algorithm stops if both boundaries of the same cell acquire normal orientation. Cell 2 is to leave the ES, as it falls at a bending point between the concave and convex ES areas and its outer surface area decreases below the threshold permitting it to remain in the ES. This arrests the SU movement, as the new contact surface, between cells 1 and 3, which arises after cell 2 has left the ES, is normally oriented with respect to the outer ES surface (see Fig. 8G).
Note that the resulting movement-shaping vectors, V, are applied differently than in previous SUs. In each cell this vector is not at the leading edge of this cell, but near the leading edge of the cell which precedes this cell. The reason for this is as follows. Deviation of a cell boundary from normal orientation promotes both the elongation of this boundary and decrease in the outer surface area of a neighboring cell. Then, in contrast to the previous SU, the movement-shaping positive feedback, a geo-metric analogue of the activator, is not between different surfaces of the same cell, but rather between the surfaces of neighboring cells. As for the inhibitor, its analogue is provided by ES shaping, just as in the previous SU. The only, but essential distinction is that it is the shaping process itself that changes the sign of the outer surface curvature.
A new singularity: Spatial Unfolding and mappings of the plane into the plane
The parallel between the mass cell movement spatial patterns and that considered in the theory of smooth mappings has been discussed since the pioneering work of Thom (1969), however, with little success, as it has remained unclear both what the mapping is itself and the space to which it applies. The SU eliminates this problem, insofar as the disposition of cell shapes in the current ES contour allows for its mapping into the new ES contour in a fairly explicit way.
Fig. 9A the mapping is shown by a faint vertical line and the circle marked by the asterisk corresponds to the centre of a region which the theory of smooth mappings calls the fold (Whitney, 1955).
Morphogenetic area and constraints
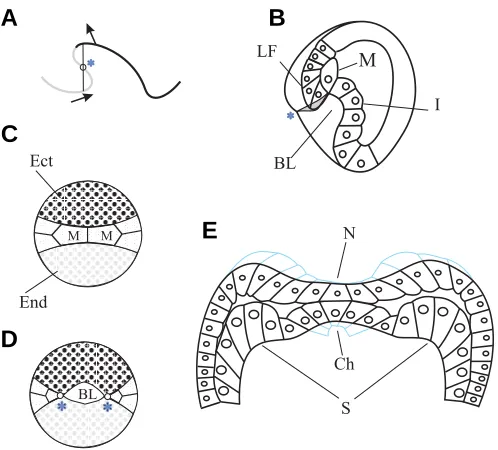
The contour shown in Fig. 9A perfectly corresponds to that arising in the gastrulation of animals with spiral cleavage, which, for brevity, we call spiralians (such as Lymnea embryos; for details see Cherdantsev, 2003). In the three-dimensional gastrula image shown in Fig. 9B, the dorsal blastopore forms a topological fold (its mapping into the plane is shaded). From both sides of the fold (only one of them is shown) three prototypes of the plane-into-plane projection meet to form a singularity which in the theory of smooth mappings is called a cusp (see the asterisk in Fig. 9B). The ventral topology is the same as in the sea urchin archenteron. The reason is that in spiralians the dorsal blastopore sector is formed by the lateral flow SU (shown in grey), while the ventral one – by the invagination SU (shown in black). The succession of the axial (bilateral) mesoderm formation which is common to spiralians is the same as with the formation of topological folds and cusps (see Figs. 9C, D). Two stem mesodermal cells (M in Fig. 9C), the descendants of M cell shown in Fig. 8A, start to leave the outer embryonic surface in the cusps (marked by the aster-isks) corresponding to the bending point of the ES. It follows that
mesoderm bilateral patterning is based on an SU.
In gastrulation of spiralians the lateral flow SU consists of a few cells. However, it can consist of many cells, the formation of the axial structures in Chordates providing an example. In a transver-sal histological section through the Amphioxus embryo, whose dorsal aspect is shown in Fig. 9E, the neural plate and notochord anlage shaping are matters of lateral flow SU (the new ES contours constructed on the basis of this SU algorithm are shown by faint lines), while the axial mesoderm of future somites is separated from the endoderm by epithelization SU.
The main constraint of lateral flow SU is that cells leave the ES when approaching its bending point. In spiralians, after the stem mesoderm cells have emigrated from the ES, the fold region that forms the dorsal lip of the blastopore of the gastrula becomes an empty place, as shown in Fig. 9D. This constraint is overcome by Chordates by starting a new SU, the last we consider.
Planar convergence Spatial Unfolding
A referent example: dorsal blastopore lip formation in am-phibian embryos, Xenopus laevis and Rana ridibunda
Up to this point we have considered SU movement-shaping in the ES section. Meanwhile, in a three-dimensional ES DM and NM vectors can be referred to each cell’s outer surface. DM in this case would correspond to the outer surface shaping of a cell moving in the ES plane and NM to the change in the radius of curvature of an area which this cell is going through. Providing that both these conditions hold, the mass movement of cell outer surfaces can form an SU in the embryonic surface plane – the planar convergence SU – considered in this section. That the planar outer cell surface movement is a movement-shaping that shapes the ES was demonstrated by Jacobson and Gordon (1976).
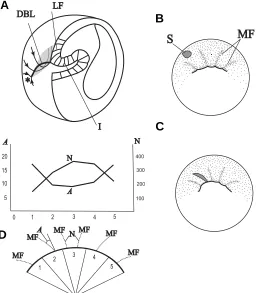
The dorsal blastopore lip (DBL) of amphibian early gastrula, whose three-dimensional image is shown in Fig. 10A, represents the same topological fold as that in spiralians. The outer ES of the DBL is subject to lateral flow SU, the inner one to invagination SU. For simplicity, the cell geometry is shown only for the outermost and innermost DBL layers. The cusps that flank the fold corre-spond to loci at which the paraxial somite mesoderm leaves the outer ES surface (asterisk in Fig. 10A). It follows that the only, but essential distinction between the amphibian gastrula (which is typical for all Chordates) and that of spiralians is that inside the fold the ES manages to maintain its morphological continuity forming the notochord anlage.
The method of reconstructing the spatial pattern of cell tracks (arrows on the outer DBL surface shown in Fig. 10A) is as follows. As the blastopore of early amphibian gastrula acquires its cres-cent-like shape, the outer DBL surface becomes covered by microfolds (MF). While no one seems to have paid attention to the MF, they are of importance, as their orientation is that of the tracks of a mass movement of cells moving towards the DBL arc to cross it and enter the dorsal archenteron roof (shown in Fig. 10A by dots). In the early Xenopus gastrula a vital dye spot marking a region on the outer DBL surface changes shape as it moves towards the DBL arc, stretching along and contracting across the axis of its movement (cf. Figs. 10B and C). It is this type of movement-shaping that one could expect if the cells moved along MFs, provided that each new step of this movement required that Fig. 10. Unfolding of the planar convergence. (A) Three-dimensional
image of the frog gastrula. Arrows, cell movement tracks; LF, lateral flow; I, invagination; DBL, dorsal blastopore lip; the archenteron roof is shaded. (B,C) Successive shapes of a vital dye spot (shaded) on Xenopus gastrula surface. MF, microfolds. (D) Distribution of the number (N) and deviation angle (A) of microfolds in angular (1-5) sectors of the dorsal blastopore lip. Modified from Cherdantsev, 2003; for other explanations, see text.
A
B
C
the MFs changed their disposition and shape. As a matter of fact, this movement is attended by changes in DBL arc shape. If we compare the arc height (h) and length (l) ratios, shown in Figs. 10 B and C, it becomes obvious that the arc curvature is subject to increase, especially in the central sectors.
Thus, we can treat the MFs as the separation boundaries between the ES cells and the DBL arc, to which the MFs converge, as the analogue of the ES contour. The difference is only that the MFs arise as a result of the tensile stretch of the outer DBL surface responding to the active cell movement (for details see Cherdantsev, Scobeyeva, 1994), so that each MF arises and vanishes in a few minutes. Cells travel from one MF to another, changing their neighbors, as the outer DBL cells are known to do when entering the arc (Keller, 1987). If, however, there is a reproducible difference between the average number and orien-tation of MFs in different DBL arc sectors, then these ephemera, as indicators of mass cell movement vectors, are worthy to be considered as dynamical analogs of ES cell boundaries.
Figs. 10D, E show, for the early gastrula of a frog Rana ridibunda L., how the distribution of MF numbers between five DBL arc sectors of equal angular length matches to the distribu-tion of deviadistribu-tion angles between the MFs and normal arc curva-ture radii. The method of measuring this is shown under the graphics, where N is the average number of MFs in a given sector
tween the actual and future arc contours. These are singular (unmovable) points of the mass cell movement at which the geometric algorithm is arrested.
The dynamics algorithm starts with zero DBL arc curvature, which means that the arc curvature is the same as that of the gastrula surface latitude at which gastrulation is initiated. The next steps are shown in Figs. 11D-F in which the archenteron roof contours are shaded, while the lines bending over the arc to enter the archenteron roof correspond to the cell movement tracks (MFs). We assume, as shown in Fig. 11A, that movement along these tracks towards the DBL arc is equal to shaping of the areas which these tracks circumscribe at each given step of morpho-genesis. Then:
(i) The transversal shrinkage of an area being involved in the central DBL arc sector causes the deviation of cell flows from the normal arc radii of curvature (Fig. 11D).
(ii) The orientation of these flows is normalized by increasing the arc curvature in the central sector (Fig. 11E).
(iii) The change in the arc central sector shape makes cell flows in the lateral arc sectors turn towards the arc centre. This trans-lates step (i) from the arc centre to lateral arc areas (Fig. 11F).
The algorithm is over when the arc acquires a spatially homo-geneous shape, the orientation of cell flows marked by MF being normalized throughout the arc. DM in the convergence SU is a Fig. 11. Movement-shaping model of convergence unfolding. (A)
Movement-shaping equivalence (for an explanation of the commutation of blue tracks, see text). (B,C) Geometric algorithms. (D-F) Dynamic algorithms. Arrows in (B,C), shaping of the dorsal blastopore lip (DBL) arc; red arrows in (D,E), movement-shaping vectors (V), whose components are shown by the black arrows; DM, the planar cell movement along the arc; NM, shaping of the arc planar curvature; the dorsal archenteron roof is shaded; modified from Cherdantsev, 2003. For other explanations, see text.
and A is the average deviation angle. In central sec-tors, as compared to the lateral ones, the number of MFs increases (Fig. 10D) with decreasing deviation angle A (Fig. 10E). Comparing these spatial patterns to the time succession of shaping of the marked region shown in Fig. 10B, C and to DBL arc shaping, makes it clear that the MF spatial series form an SU of longitudinal stretching and transversal shrinking of the areas entering the DBL arc.
Morphodynamics algorithm
The planar convergence SU can be compared to the lateral flow SU in which the cell movement plane is the embryonic surface, the ES surface is the arc of DBL and the cell separation boundaries are the MF. Even though the MFs are not the cell boundaries, but rather the cell groups with variable alignments, we have reason to assume that each MF is identical to the movement track of a given cell at a given moment, as shown in Fig. 11A. A cell traveling from track S0S1 to track So’S1’ and then moving in this track, falls into the same place as a cell moving in track S0S1 and than traveling to the track So’S1’ . Then, for each cell moving towards the DBL arc in the MF group we have a movement vector whose absolute value is propor-tional to the deviation of the MF from the arc normal radius of curvature at the intersection point between the arc and the MF. Thus we get a new arc contour shown in Fig. 11B, this being the first step of the geometric movement algorithm. The next step, shown in Fig 11C, consists in shaping the new contour so as to normalize its orientation with respect to the cell movement vectors. The inevitable result of this proce-dure is the origination of two bilaterally symmetrical intersections (marked by asterisks in Fig. 11C)
be-A
B
C
D
E
matter of the same (non-local) positive feedback that operates on the lateral flow SU – the greater is the MF convergence to the arc centre, the greater is the longitudinal stretching and transversal shrinkage of the central area, this promoting the further conver-gence of cell flows. On the other hand, DM causes NM inhibition of this positive feedback by shaping the arc. Note that in this shaping process the MFs shorten in a direction opposite to that of their longitudinal stretching, which means the NM operating in the same way as in the invagination SU. In a sense, the convergence SU encompasses all mass movement modes that have been discussing.
Morphogenetic area
The planar convergence SU allows for the notochord domain formation in all Chordates (Cherdantsev, 2003). As it is shown in Fig. 10A, the convergence of cells towards the DBL arc centre provides, both in time and space, a continuous transition between the lateral flow SU whose movement shapes the DBL arc and the invagination SU whose movement shapes the archenteron roof (see corresponding series of cell shapes in the sagittal gastrula section shown in Fig. 10A). Instead of leaving the ES at its bending point, as occurs in spiralians, the cells move so as to mold new DBL arc contours. Note that the axis of this movement-shaping does not depend on a choice of the coordinate system. It is common, but erroneous, to say that cells move in the direction of the main body axis, from its anterior pole to the posterior pole. As a matter of fact, the true is converse: it is the planar convergence SU movement that forms the main body axis, the archenteron roof shape being a trace of the DBL arc movement-shaping.
Concluding remarks: the structure of structuring
Morphogenesis – both in the ontogeny and evolution – is portrayed in this paper as the “self-organization ladder” of move-ment-shaping patterns whose spatiotemporal succession is that of lowering the symmetry order both in a structural and dynamical sense, as the formation of new structural domains presumes the origin of new trends of dynamics. Self-organization means that new morphogenetic patterns, at the time of their origin, have zero inheritance and no adaptive value on their own. In this and only in this case, one can say that ontogeny itself does produce new developmental information, provided that new patterns are ro-bustly reproducible with no effect on fitness (Cherdantsev et. al., 1996). The point is that the origination of new structural domains presumes that the developing system acquires new trends of the individual variation subject to genetic and functional assimilation (Waddington, 1940; for additional details see Cherdantsev et. al., 1996).
The order of structuring is subject to the SU principle that the temporal changes in a given embryonic area occur by the unfold-ing of a spatial series of areas with a more and more low order of structural and dynamical symmetry. In other words, the spatial differences between the parts of the developing system mean the difference between the previous (more homogeneous) and sub-sequent (less homogeneous) developmental states of the system as a whole. It follows that the evolutionary history of the develop-ing system is encoded not in the succession of developmental stages of the whole system, but rather in the difference between its spatial domains subject to movement-shaping patterns of the
different order of complication. The fate of an area does not depend on its position, but, instead, the movement-shaping identity of SU establishes a “triple correspondence” between the form, position and fate.
Taking as an example the amphibian gastrula shown in Fig. 10A, it is easy to read its dorsoventral axis as a spatiotemporal series of complicating morphogenetic movement patterns. The ventral blastopore lip is a region in which, as in the whole blastopore circumference of the simpler sea urchin gastrula, the epithelization SU borders with the invagination SU with no action between the outer and inner ES counterparts. Their inter-action arises only with the addition of a new SU (that of the lateral flow), this separating a new gastrula domain – the lateral DBL sector, whose dynamic behavior is the same as in the whole DBL of the even simpler gastrula of spiralians. Unless interaction between the outer and inner DBL counterparts rests only on the lateral flow SU, ES movement-shaping fails to preserve ES integrity, which becomes possible when a new SU is added, allowing for the convergence of cell flows. This, again, separates a new domain – the dorsal pole region (“organizer”). Thus, in Chordate embryos the blastopore circumference portrays the developmental history in an explicit way – the mirror-image of the fate map – of a single region whose symmetry order was once coincident with that of the whole circumference and so was its position. The further blastopore history (fate) is that of shifting this region to the very edge of blastopore circumference up to local-ization at the ventral pole. The only reason for this is the origina-tion of areas whose movement-shaping symmetry is of a lower order, as compared to the initial symmetry.
It follows, first, that changes in movement-shaping symmetry provide a single mechanism both of positioning the regions and outlining their morphogenetic potencies and, second, that, from the morphogenetic point of view, the “ladder of beings”, where “beings” are movement-shaping patterns, can be read in both directions with the equal success.
Acknowledgement
This study was supported by the Russian Fund for Fundamen-tal Research, grant 05-04-48847.
References
ARNOLDS W. G. A., van den BIGGELAAR J. A. M., VERDONK (1983). Spatial aspects of cell interactions involved in the determination of dorsoventral polarity in equally cleaving Gastrpods and regulative abilities of their embryos, as studied by micromere deletions in Lymnaea and Patella. W. Roux’ Arch. Dev. Biol., 192: 75 – 85.
BELINTSEV B. N. The physical basis of morphogenesis. M.: Nauka, 1991 (In Russian).
BELOUSSOV L. V. (1998). The dynamic architecture of a developing organism. Kluwer Acad. Publishers.
BELOUSSOV L. V., DORFMAN J. G., CHERDANTSEV V. G. (1974). The rapid changes of the form and cell architecture of isolated embryonic tissue fragments as an experimental model of morphogenesis. Ontogenez (Sov. Journ. Dev. Biol.), 5: 323-332.
BELOUSSOV L. V., DORFMAN J. G., CHERDANTSEV G. (1975). Mechanical stresses and morphological patterns in amphibian embryos. J. Embryol. Exp. Morphol., 34: 559 – 574.
CHERDANTSEV V. G. (2003). Morphogenesis and Evolution. M.: KMK Ltd Press, (In Russian).
CHERDANTSEV V. G and SCOBEYEVA V. A. (1994). The morphological basis of self-organization. Rivista Biol. Forum, 87: 57-85.
CHERDANTSEV and V. G., SCOBEYEVA (1996). On Gurwitsch’ s Morphogenetic Law. In: Biophotonics Eds. L. V. Beloussov, F. A. Popp. M. Bioinformservices: 53 – 70.
DORFMAN J. G., CHERDANTSEV V. G. (1977). The structure of gastrulation morphogenetic movements in Anurans. Ontogenez, (Sov. Journ. Devel. Biol.), 8: 238-262 (In Russian).
GOODWIN B. C. (1994). How the Leopard Changed its Spots. The Evolution of Complexity. Weidenfeld and Niicolson, London.
GURWITCSH A G. (1914). Der Vererbungsmechanismus der Form. Arch. Enwicklungsmech. des Organismen, 39: 516 – 577.
GURWITSCH A. G. (1922). Uber den Begriff des embryonalen Feldes. Arch. Enwicklungsmech. des Organismen, 51: 383 - 415.
GUSTAFSON T., WOLPERT. (1967). Cellular movements and contacts in sea urchin morphogenesis. Biol. Rev., 42: 442 – 498.
HARRIS A. K. (1984). Tissue culture cells on deformable substrata: Biomechanical implications. J. Biomech. Engin. 106: 19-24.
HARRIS A. K. (1994). Locomotion of tissue culture cells considered in relation to ameboid locomotion. Int. Rev. Cytol., 150: 35-68.
JACOBSON A. G., GORDON (1976). Changes in the shape of the developing vertebrate nervous system analyzed experimentally, mathematically and by computer simulation. J. Exp. Zool., 197, 191-246.
KELLER R. E. (1987). Cell rearrangements in morphogenesis. Zool. Sci., 4: 763 – 779.
KRAUS Ju. A. and CHERDANTSEV V. G. (1999). Variability and equifinality of the
early morphogenesis in a marine hydroid, Dynamena pumila L. Ontogenez (Russ. Journ. Devel. Biol.). 9: 119 – 129.
LANDAU L. D. and LIVSHITZ E. M. Statistic physics. (1976). Nauka (In Russian).
MAINHARDT H. and GUIRER A. 1980. Generation and regeneration of sequence of structures during morphogenesis. J. Theor. Biol., 85:429-450.
MESCHERIKOV V. N. (1975). The snail Lymnea stagnalis. In Objects of Develop-mental Biology. M.:Nauka, 152-170 (In Russian).
ODELL G.M., OSTER G. F., ALBERCH P. and BURNSIDE B. (1981). The mechanical basis of morphogenesis. I. Epithelial folding and invagination. Dev. Biol., 85:446-462.
OSTER G. F., MURRAY J. D., HARRIS A. K. (1983). Mechanical aspects of mesenchymal morphogenesis. J. Embryol. Exp. Morphol., 78: 83 – 125.
PRIGOGINE I. (1980). From being to becoming. Time and complexity in the Physical Sciences. W. H. Freeman and Co, N. Y.
THOM R. (1969). Stabilite structurelle et morphogenese. Menlo Parc., Calif. W. A. Benjamin ed. (In French).
THOSOMPSON D’ARSI (1942). On Growth and Form. Cambridge University Press.
TURING A. M. (1952). The chemical basis of morphogenesis. Phil. Trans. Roy. Soc. London, B 237: 37 – 72.
WADDINGTON C. H. (1940). Organizers and Genes. Cambridge University Press.
WADDINGTON C. H. (1972). Form and information. In Towards a Theoretical Biology. Edinburgh University Press, V. 4: 109 – 141.
WHITEY H. (1955). Mappings of the plane into the plane. Ann. Math. 62: 374-410.