A Study and Analysis of Image Compression by
Wavelet Transform Technique:
A Fuzzy Logic Approach
Dr. Harshad I. Gelada
1, Dr. Magan. P. Ghatule
2 Department of Computer Science1,2Sinhgad College of Science, Ambegaon (Bk), Pune-411041 [email protected], [email protected]
Abstract: In the presence innovative studies development and analysis of image compression algorithm based
on the wavelet transform method (I.Daubechies 1998) using Fuzzy Logic technique is implemented. At presence data storage and its transformation and transportation is a challenging task. And it can be overcome by digitalization processes. However digital imaging (Rafael C.Gonzalez) is one of the best data storage technique commonly used in real practice.
This article emphasizes on transportation or transition of imaged data so that it is essential that there will not be any change in shape, size and quality. To overcome this challenge various tools and techniques have been implemented and quality of assurance is achieved. In this sense image compression is one of the best benchmark techniques used for solving the said problem which comprises of wavelet transform comprises.
Form the literature review it is clear that present mathematical model used in the wavelet transformation has found some limitations and which scavenges considerable amount of error in the entire image process results. These results lead to decrease in the quality and efficiency of the processed image. Therefore in continuation with our earlier studies and to overcome this sensitive issue, an innovative mathematical model is embedded for enhancing the present algorithm which is based on Fuzzy Logic Technique (FLT).
In present research work appropriate Fuzzy Logic (FL) is used for enhancement in the analysis of image quality measures which is based on the Wavelet Transform Algorithm (WTA). The derived fuzzy Image Compression
Model (FICM) deals with the vagueness uncertainties and controls the nonlinearities while processing the image
compression. This algorithm ensures the design and development of FICM based on the fuzzy set theory and classical mathematical principles, in which approximate reasoning of Fuzzy Logic is implemented.
This summarizes implementation of human intelligence; knowledge and excellent wavelet transform technique to design fuzzy Image Compression Model (FICM).
This innovative research work describes how FICM is a powerful and alternative technique as compared with conventional algorithm of image compression. This research work comprises the suitability and flexibility of
FICM, which directly deals with non-stationary and uncertain behavior of traditional image compression methods.
Index Terms – Images, Matlab, Fuzzy Model
1. INTRODUCTION
Digital Image compression (Rafael C.Gonzalez) addresses the problem of reducing the amount of data required to represent a digital image. The underlying basis of the reduction process is removal of redundant data. From the mathematical viewpoint, this amounts to transforming a 2D pixel array into a statically uncorrelated data set (Piella, 2014). The data redundancy is not an abstract concept but a mathematically quantifiable entity. If n1 and n2 denote the number of information-carrying units in two data sets that represent the same information, the relative data redundancy
R
D [2] of the first data set (the one characterized by n1) can be defined as,
R D
C
R
=
1
−
1
(1)Where
C
R called as compression ratio [2]. It is defined as
C
R =2
1
n
n
(2)
In image compression, three basic data redundancies can be identified and exploited:
(1)Coding redundancy, (2)Interpixel redundancy, and (3)Phychovisal redundancy.
applications, which are in broadcast television, remote sensing via satellite, air-craft, radar, sonar; teleconferencing, computer communications, facsimile transmission etc. General Model of image compression is as shown in Figure (1.1)
Figure (1.1) Block Diagram of Image Decompression However, image storage is required most commonly for educational and business documents, medical images like in computer tomography (CT), magnetic resonance imaging (MRI) and digital radiology, motion pictures, satellite images, weather maps, geological surveys, and many more. Generally there are two types of image compression techniques are used in real practice: (1) Lossy Image compression (2) Lossless Image compression (G. Piella, 2001)
2. WAVELET APPROACH FOR IMAGE COMPRESSION:
Storage constrains and bandwidth limitations in communication systems have necessitated the search for efficient image compression techniques. For real time video and multimedia applications where a reasonable approximation to the original signal can be tolerated, lossy compression is used (G. Piella, 2001)
. In the recent past, wavelet based image compression schemes have gained wide popularity. The characteristics of the wavelet transform provide compression results that outperform other transform techniques such as discrete cosine transform (DCT). Consequently, the JPEG2000 compression standard and FBI fingerprint compression system have adopted a wavelet approach to image compression.
The wavelet coding techniques is based on the idea that the co-efficient of a transform that decorrelates the pixels of an image can be coded more efficiently than the original pixels themselves. If the transform’s basis functions in this case wavelet- pack most of the important visual information into small number of co-efficient, the remaining co-efficient can be coarsely quantized or truncated to zero with little image distortion.
The still image compression(David Salomon’s),
modern DWT based coders have outperformed DCT based coders providing higher compression ratio and more peak signal to noise ratio (PSNR) due to the wavelet transforms(H.J.A. M. Heijmans) multi-resolution and energy compaction properties and the ability to handle signals.
3. IMAGE COMPRESSION: WAVELET TRANSFORM TECHNIQUE (WTT)
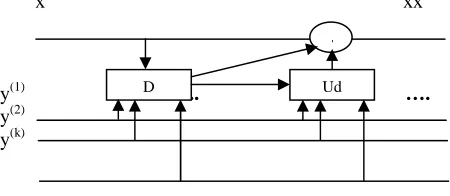
We consider a (K + 1) band Filter bank decomposition with inputs x, y (1), y (2), y (3)….y (k), with
K
≥
1
, which represent the polyphase components of the analyzed signal. The first polyphase component, x, is updated using the neighboring signal elements from the other polyphase components, thus yielding an approximation signal. Subsequently, the signal elements in the polyphase components y (1), y (2)…y (K) are predicted using the neighboring signal elements from the approximated polyphase component and the other polyphase components. The prediction steps, which are non-adaptive, result in detail coefficients. The adaptive update step is illustrated in Figure 3.1.x xx
y(1) ….. ….
y(2) y(k)
Figure 3.1. Adaptive update lifting scheme Here, x and y (1), y (2)…y (K) are the input for a decision map D, whose output at location n is binary decision
dn = D {y (1), y (2)…y (K)} ∈ {0,1}
Which triggers the update filter Ud and the
addition ⊕d. More precisely, if dn is the binary decision at
location n, then the updated value x1(n) is given by x1(n) = x(n) ⊕dnUdn(yi)(n) --- (3.1)
We assume that the addition ⊕d is of the form
x⊕du = αd(x+u) with αd #0, so that the operation is
invertible. The update filter is taken to be of the form
)
(
)
)(
(
2
1
,
y
n
n
y
U
jL
L j
j d
d
∑
− =
=
λ
--- (3.2)Where yj(n) = y(n+j) and L1 and L2 are
nonnegative integers. The filter coefficients λd,j depend on
the decision d at location n. Henceforth, we will use∑j to denote the summation from – L1 to L2.
From (3.1) and (3.2), we infer the update equation used at analysis:
∑
=
+
=
Nj
j j dn
dn
x
n
y
n
n
x
1 , 1
)
(
)
(
)
(
α
β
--- (3.3)Where
β
d,j=
α
dλ
d,j. Clearly,we can easily invert (3.3) throughD Ud
+
Forward
Transfor m
Encoder
Image Compressed
Image
Reconstructed Image
PSNR = 10 log10
MSE
2
255
Which, is measured in terms of decibels (dBs).
Study and observations concludes that, when PSNR is 40 dB and more, then the original and the reconstructed images are virtually indistinguishable by human eyes. Taking into consideration these models various experiment has been carried out and observations are recorded in the table (2.1a & 2.1b), which shows that Bitrate and Decomposition Level comprises the values of PSNR for getting quality value of PSNR measures the various uncertainties i.e. for certain value of Bitrate then exact prediction of decompression level is highly impossible.
Table(2.1a) : Sample Image (256 X 256)
Further study and analysis understand that, needs to be improve the methodology to overcome the said problem so that exact Bit Rate (BR) to be decided to obtain the quality image decompression(David Salomon’s)
at suitable and sustainable Decomposition Level (DL). To dilute this sensitive problem and for getting predictable results for image compression it has been
decided that use of Fuzzy logic technique which is most suitable and flexible, it is described in the next section.
Table(2.2) : Sample Image
Bit Rate
Most Suitable
PSNR
Respective Decomposition
Level 0.3 18.9888 3 0.4 19.1481 3 0.5 19.1628 3 0.6 20.6154 3 0.7 20.6249 3 0.8 20.6428 3 0.9 20.6508 3 1.0 20.8648 3 0.2 17.6806 4 0.1 15.7433 5
1) Steady state characteristics:
2) Fuzzy Input Variable : PNSR
Fuzzy Membership Functions for Input variables
Min. Value
Middle Value
Max Value Decom
Level/ 1 2 3 4
Bitrate
0.1 6.1665 8.4572 10.6564 15.2128 0.2 6.9243 10.9523 15.7860 17.6806 0.3 7.7217 10.9529 18.9888 17.6994 0.4 8.5532 10.9536 19.1481 18.6787 0.5 9.5942 12.1762 19.1628 18.6844 0.6 10.9615 16.3712 20.6154 18.7009 0.7 11.2822 16.3712 20.6249 18.7028 0.8 11.2822 16.3772 20.6428 19.0088 0.9 11.2822 16.3851 20.6508 19.0699 1.0 11.2822 19.4320 20.8648 19.0721
Table(2.1b) : Sample Image (256 X 256)
Decom
Level/ 5 6 7 8
Bitrate
LP 15.96 15.96 18.98
MP 15.96 18.98 20.67
HP 18.98 20.67 20.67
3) Fuzzy Output Variable : BR Fuzzy
Membership Functions
for Input variables
Min. Value
Middle Value
Max Value
LBR 0.11 0.11 0.38
MBR 0.11 0.38 0.80
HBR 0.38 0.80 0.80
4) Fuzzy Output Variable : D Level
Fuzzy Membership Functions for
output variables
Min. Value
Middle Value
Max Value
LDL 3.00 3.00 3.08
MDL 3.00 3.08 4.89
HDL 3.08 4.89 4.89
In this fuzzy logic optimization technique for decision making gives the result of bitrates is 0.4, which is most suitable for all uncertainties with every decomposition level Mathematical model used in the wavelet transformation ( Ajit S. Bopardikar) has found some limitations and which introduces amount of error in the entire image process results. Image compression based on adaptive and non-adaptive (Haar) wavelet decomposition. This results in the decreases in quality and efficiency of the processed image. Therefore to overcome this sensitive issue, another mathematical less model is embedded for enhancing the present algorithm which is Fuzzy Logic Technique (FLT).
4. CONCLUSION:
The present innovative work and its optimized technique conclude that traditional mathematical model is lacking to handle uncertainties to achieve target of optimization. However to overcome said drawbacks FICM is developed as an alternative and powerful technique.
Fuzzy Logic Technique uses human intelligence, knowledge and comprises of mathematical evaluation without any specific formula. In particular FICM gives excellent wavelet transform design experience of expert designer without mathematical format.
Finally it is concluded that the suitability and flexibility of FICM which synergistically deals with non-stationary and uncertain behavior of traditional image compression methods.
Author assures that in this research Fuzzy Logic is the ultimate and unique technique to produce the quality fine image.
REFERENCES
[1] G. Piella, G. Pau and B. Pesquet-Popescu,”Adaptive Lifting Schemes Combining seminorms for Lossless Image Compression”.
[2] Rafael C.Gonzalez and Richard E. Woods “Digital Image Processing”, Second edition.
[3] M. Rabbani and R. Joshi, “An Overview of the JPEG 2000 Still Image Compression Standard,” Signal Processing Image Comm., vol. 17, pp. 3-48, 2002.
[4] Ajit S. Bopardikar and Raghuveer M. Rao, “Introduction to Theory and Applications for Wavelet Transforms”.
[5] I. Daubechies and W. Sweldens, “Factoring Wavelet Transforms into Lifting Steps,” J. Fourier Analysis and Applications, vol. 4, pp. 247-268, 1998.
[6] David Salomon’s,”Data Compression”, Second edition.
[7] G. Piella and H. J. A. M. Heijmans, “Adaptive lifting schemes with perfect reconstruction,” Research Report PNA-R0104, CWI, 2001.