CSEIT184522 | Published - 14 April 2018 | March-April-2018 [ (4 ) 5 : 184-191]
© 2018 IJSRCSEIT | Volume 4 | Issue 5 | ISSN : 2456-3307
184
Detection of urea adulteration in milk using Gas sensor
Valarmathy R1 S, J. Haritha2, Gowthaman S3, Jawaharrajan B3
1Senior Professor, Department of Electronics and Communication Engineering Bannari Amman
Institute of Technology, Sathyamangalam, Tamil Nadu, India
2 Assistant Professor, Department of Electronics & Instrumentation Engineering Bannari Amman
Institute of Technology, Sathyamangalam, Tamil Nadu, India
3UG Scholar, Department of Electronics and Instrumentation Engineering Bannari Amman Institute
of Technology, Sathyamangalam, Tamil Nadu, India
ABSTRACT
Milk adulteration is a global concern. Developing countries are at higher risk associated with it due to lack of monitoring and policies. However, this is one of the most common phenomena that have been overlooked in many countries. Unfortunately, in contrast to common belief, milk adulterants can pose serious health hazards leading to fatal diseases. Apart from regular techniques, recent developments in the detection techniques have also been reported. Nowadays milk is being adulterated in more sophisticated ways that demands for cutting edge research for the detection of the adulterants. The proposed work intends to contribute towards detection of the presence of urea in milk using a gas sensor. The sensor output is connected to a controller and the value is calibrated in terms of concentration (ppm). The concentration of urea is displayed using a LCD. It is observed that the proposed method can detect a minimum of 2mg/lt of urea adulterated in milk at 70°C.
Keywords: gas Sensor, mq-135, Arduino board, LCD.
I. INTRODUCTION
CSEIT184522 | Published - 14 April 2018 | March-April-2018 [ (4 ) 5 : 184-191]
© 2018 IJSRCSEIT | Volume 4 | Issue 5 | ISSN : 2456-3307
185 adulterant; dilution of milk with impure water not only reduces nutritional value to a great extent but also causes water borne diseases.
EXISTING METHOD
The existing methodology consists of a chemical methods, spectroscopy methods and electrical methods .The chemical method will only detect the presence of adulterants only it will not measure the accurate value. And also the electrical methods will be complicated one. The two different commercial milk samples chosen (named UHT 1 and UHT 2) have never been penalized by ANVISA[4]. Initially, the milk was adulterated with a single contaminant. Subsequently, binary adulterations were obtained by combining deionised water with hydrogen peroxide, sodium hydroxide or formaldehyde. All the mixtures were performed in a beaker containing 50 ml of the total mixture presents the preparation conditions of the milk samples in order to verify the measured impedance dependenceBy increasing temperature, the mobility and the number of ions increase in solution, causing the value of the electrical impedance to decrease.
PROPOSED METHOD
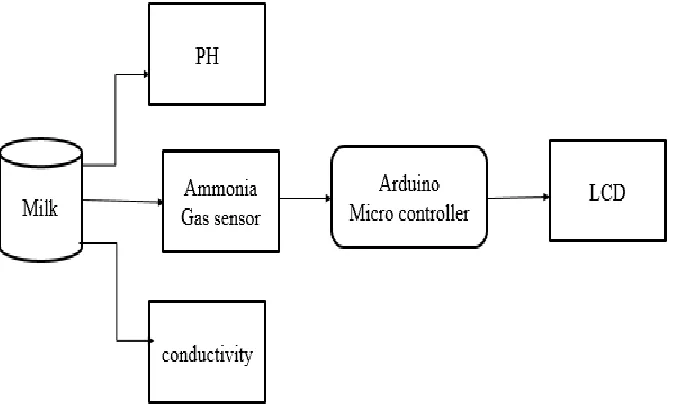
In the method, the presence of urea in milk is detected using a gas sensor. The sensor output is connected to a controller and the value is calibrated in terms of concentration (ppm). The concentration of urea is displayed using a LCD.
Figure 1. Block Diagram
ARDUINO MICROCONTROLLER
CSEIT184522 | Published - 14 April 2018 | March-April-2018 [ (4 ) 5 : 184-191]
© 2018 IJSRCSEIT | Volume 4 | Issue 5 | ISSN : 2456-3307
186 that designs and manufactures single-board microcontrollers and microcontroller kits for building digital devices and interactive objects that can sense and control objects in the physical world. The project's products are distributed as open-source hardware and software, which are licensed under the GNU Lesser General Public License (LGPL) or the GNU GeneralPublic License (GPL), permit the manufacture of Arduino boards and software distribution by anyone. Arduino boards are available commercially in preassembled form, or as do-it-yourself kitsThe boards are equipped with sets of digital and analoginput/output (I/O) pins that may be interfaced to various expansion boards (shields) and other circuits .The boards feature serial communications interfaces, including Universal Serial Bus (USB) on some models, which are also used for loading programs from personal computers. The microcontrollers are typically programmed using a dialect of features from the programming languages C and C++.In addition to using traditional compiler tool chains, the Arduino project provides an integrateddevelopment environment (IDE) based on the Processing language project. The Arduino platform has become quite popular with people just starting out with electronics, and for good reason. Unlike most previous programmable circuit boards, the Arduino does not need a separate piece of hardware (called a programmer) in order to load new code onto the board – you can simply use a USB cable. Additionally, the Arduino IDE uses a simplified version of C++, making it easier to learn to program. Finally, Arduino provides a standard form factor that breaks out the functions of the micro-controller into a more accessible.
PH METER
The pH300 meter measures pH, mV, and temperature parameters. The built-in microprocessor provides automatic calibration, automatic temperature compensation, data storage, and self diagnostics. The meter can recognize up to 13 types of pH standard buffer solutions. The meter‟s digital filter improves measurement speed and accuracy.
CONDUCTIVITY METER
CSEIT184522 | Published - 14 April 2018 | March-April-2018 [ (4 ) 5 : 184-191]
© 2018 IJSRCSEIT | Volume 4 | Issue 5 | ISSN : 2456-3307
187 meter has been idle for a long period, soak the electrode for at least 30 minutes before use. When dipping the probe into a sample solution, be sure to eliminate air bubbles trapped in the probe‟s slot. To remove air bubbles, give the probe a gentle stir while submerged in the solution. When taking a measurement, stir the probe gently in the sample to create a homogenous sample. Allow a few seconds to elapse for the probe and the sample to reach temperature equilibrium. Ideally, wait 15 minutes to achieve maximum accuracy and best temperature compensation.
AMMONIA GAS SENSOR
MQ-135 gas sensor applies SnO2 which has a lower conductivity in the clear air as a gas-sensing material. In an atmosphere where there may be polluting gas, the conductivity of the gas sensor raises along with the concentration of the polluting gas increases. MQ-135 performs a good detection to smoke and other harmful gas, especially sensitive to ammonia, sulphide and benzene steam. Its ability to detect various harmful gas and lower cost make MQ-135 an ideal choice of different applications of gas detection.Structure of MQ-135 gas sensor is composed by micro AL2O3 ceramic tube, Tin Dioxide (SnO2) sensitive layer, measuring electrode and heater are fixed into a crust made by plastic and stainless steel net. The heater provides necessary work conditions for work of sensitive. Component. The enveloped MQ-135 has 6 pin, 4 of them are used to fetch signals, and other 2 are used for providing heating current. Resistance value of MQ-135 is difference to various kinds and various concentration gases. So, when using this component, sensitivity adjustment is very necessary. we recommend that you calibrate the detector for 100ppm NH3 or 50ppm Alcohol concentration in air and use value of Load resistance that( RL) about 20 KΩ(10KΩ to 47 KΩ). When accurately measuring, the proper alarm point for the gas detector should be determined after considering the temperature and humidity influence.
LCD DISPLAY
CSEIT184522 | Published - 14 April 2018 | March-April-2018 [ (4 ) 5 : 184-191]
© 2018 IJSRCSEIT | Volume 4 | Issue 5 | ISSN : 2456-3307
188 CRT and plasma displays, with LCD screens available in sizes ranging from tiny digital watches to huge, big-screen televisionsets. Since LCD screens do not use phosphors, they do not suffer image burn-in when a static image is displayed on a screen for a long time (e.g., the table frame for an aircraft schedule on an indoor sign).LCDs is, however, susceptible to image persistence. The LCD screen is more energy-efficient and can be disposed of more safely than a CRT can. Its low electrical power consumption enables it to be used in battery-powered electronic equipment more efficiently than CRTs can be. By 2008, annual sales of televisions with LCD screens exceeded sales of CRT units worldwide, and the CRT became obsolete for most purposes. The 16x2 LCD the advantages of LCD are Very compact, thin and light, especially in comparison with bulky, heavy CRTdisplays.Low power consumption. Depending on the set display brightness and content being displayed, the older CCFT backlit models typically use less than half of the power a CRT monitor of the same size viewing area would use, and the modern LED backlit models typically use 10–25% of the power a CRT monitor woulduse.Little heat emitted during operation, due to low powerconsumption.No geometricdistortion the possible ability to have little or no flicker depending on backlighttechnology.Usually no refresh-rate flicker, because the LCD pixels hold their state between refreshes (which are usually done at 200 Hz or faster, regardless of the input refreshrate.Can be made in large sizes of over60-inch (150 cm)diagonal.Masking effect: the LCD grid can mask the effects of spatial and grayscale quantization, creating the illusion of higher imagequality.Unaffected by magnetic fields, including theEarth's.As an inherently digital device, theLCD can natively display digital data from aDVIorHDMIconnection without requiring conversion to analog. Some LCD panels have native fibre opticinputs in addition to DVI andHDMI.Many LCD monitors are powered by a 12 V power supply, and if built into a computer can be powered by its 12 V powersupply.Can be made with very narrow frame borders, allowing multiple LCD screens to be arrayed side-by-side to make up what looks like one bigscreen.
RESULTS AND DISCUSSION
CSEIT184522 | Published - 14 April 2018 | March-April-2018 [ (4 ) 5 : 184-191]
© 2018 IJSRCSEIT | Volume 4 | Issue 5 | ISSN : 2456-3307
189 Figure 2. Experiment Setup of Urea Detection in Milk Using Ammonia Gas Sensor
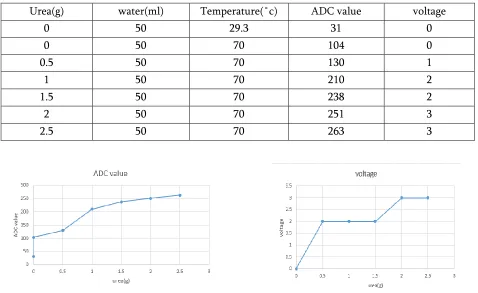
Table 1. Readings for urea adulterated in water
Urea(g) water(ml) Temperature(˚c) ADC value voltage
0 50 29.3 31 0
0 50 70 104 0
0.5 50 70 130 1
1 50 70 210 2
1.5 50 70 238 2
2 50 70 251 3
2.5 50 70 263 3
CSEIT184522 | Published - 14 April 2018 | March-April-2018 [ (4 ) 5 : 184-191]
© 2018 IJSRCSEIT | Volume 4 | Issue 5 | ISSN : 2456-3307
190
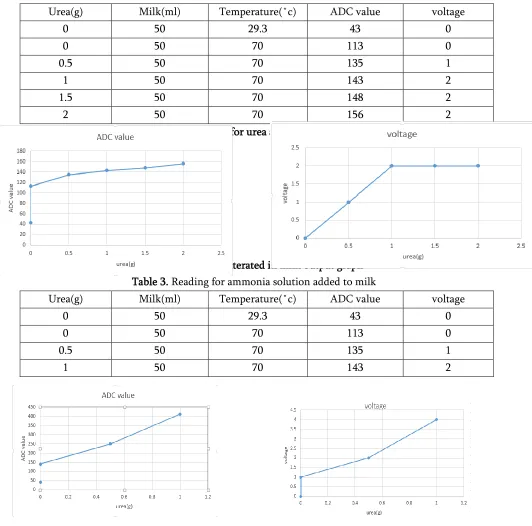
Urea(g) Milk(ml) Temperature(˚c) ADC value voltage
0 50 29.3 43 0
0 50 70 113 0
0.5 50 70 135 1
1 50 70 143 2
1.5 50 70 148 2
2 50 70 156 2
Table 2. Reading for urea adulterated in milk
Figure 4: Urea adulterated in milk output graph Table 3. Reading for ammonia solution added to milk
Urea(g) Milk(ml) Temperature(˚c) ADC value voltage
0 50 29.3 43 0
0 50 70 113 0
0.5 50 70 135 1
1 50 70 143 2
Figure. 5:.Ammonia solution adulterated in milk output graph
II. CONCLUSION
CSEIT184522 | Published - 14 April 2018 | March-April-2018 [ (4 ) 5 : 184-191]
© 2018 IJSRCSEIT | Volume 4 | Issue 5 | ISSN : 2456-3307
191 detect the urea adulteration in milk. The proposed method can detect a minimum of 2mg/lt of urea adulteration in milk at 70°C. Also, the method can be developed into a hand held device such that it can be used by domestic people for identification of the urea adulteration in milk.
III. REFERENCES
[1] M. Simic, “Realization of complex impedance measurement systembased on the integrated circuit AD5933,” in Proc. 21st Telecommun.Forum (TELFOR), Nov. 2013, pp. 573–576.
[2] Food and Agriculture Organization of the UnitedNations, “Milk Processing,” FAO, 2015.
[3] J.-R. Riba Ruiz, T. Canals Parelló, and R. Cantero Gómez, “Comparativestudy of multivariate methods to identify paper finishes using infrared spectroscopy,” IEEE Trans. Instrum. Meas., vol. 61, no. 4,pp. 1029–1036, Apr. 2012.
[4] Santos, P. M., E. R. Pereira-Filho, and L. E. Rodriguez-Saona. "Rapiddetection and quantification of milk adulteration using infra red microspectroscopy and chemometrics analysis."Food chemistry 138, no.1(2013): 19-24