DOI : https://doi.org/10.32628/CSEIT183853
A Comprehensive Clinical Decision Support Application
Software tool for estimate of the Fourth Ventricle volume using
Brain Computed Tomography scan for Clinical Application
I. Shirazu1, B. K. Owusu2, E. K. Tiburu2, A. Mon2, T. A. Sackey1,
1Radiological and Medical Sciences Research Institute, Ghana Atomic Energy Commission, Accra, Ghana 2Department of Biomedical Engineering, University of Ghana, Legon-Accra, Ghana
ABSTRACT
The physiology and anatomy of the ventricular system has become an area of research for clinicians in neuropsychiatry to help manage neurologic diseases as well as other diseases such as chronic alcoholism. The objective of this study is to develop an easy and user-friendly graphical user interface for calculating fourth ventricle volume. Materials used were Minitab statistical tool and MeVisLab modelling tool. The methodology involved the use of MeVisLab measurements tool to measure the linear and volume dimensions using Voxel Count Method. Whilst the modeling was done with Minitab statistical tool to model the relationship between the linear and volume measurements. Minitab statistical modeling tool and the written code was done with
python programming language. Minitab statistical software was used to model the relationship between the
fourth Ventricle Volume and the product of fourth ventricle length (VL), fourth ventricle width (VW) and
fourth ventricle thickness (VT). Ten model equations were developed; five each for males and females for the
age group (21-30, 31-40, 41-50, 51-60 and 61-70). A comprehensive decision support application software tool has been developed for easy, accurate and user-friendly GUI as part of diagnostic procedure for the calculation of volume of fourth ventricle to aid neurological diagnosis in clinical practice. These would help neurosurgeons in their diagnosis, localization and surgical removal of tumors and lesions (craniopharyngiomas and gliomas) surrounding the ventricular system.
Keywords : Mevislab Modelling Tool, Computed Tomography, Positron Emission Tomography, ANOVA
I. INTRODUCTION
Imaging in medicine has seen a lot of technological and clinical advancement in its applications over the past 25 years (1). This technological advancement let to the invention of Computed Tomography (CT), Single Photon Emission Computed Tomography (SPECT) and Positron Emission Tomography (PET), Magnetic Resonance Imaging (MRI). In addition to the storage and networking of images on digital platforms such as PACS (Picture Archiving and Communication System).
has therefore become the commonest tool for evaluating brain atrophy. CT brain scans are mostly requested by referring physicians to evaluate brain structures for the presence of abnormalities such as hemorrhage, skull fractures, tumors, headaches etc. Therefore CT examination has become an important tool for the study of the physiology and anatomy (shape and size) of the ventricular system. Hence its largely used in the area of research for clinicians in neuropsychiatry to help manage these neurologic diseases (4,5,6) as well as other diseases such as chronic alcoholism (7). These studies would also help neurosurgeons in their diagnosis, localization and surgical removal of tumors and lesions (craniopharyngiomas and gliomas) surrounding the ventricular system (8).
In addition, apart from various research geared towards visualization of anatomy of the ventricular system, morphometric examination of the ventricular system has also become a necessity for assessing variations resulting from growth, ageing and pathologies (9, 10). This seeks to evaluate the size and state of the ventricles, which is an area of high interest to radiologists in reporting abnormalities involving the brain on CT scans. Availability of baseline reference values of cerebral ventricles obtained from autopsy reports and imaging has made it easy for clinicians, physicians and radiologists to monitor the diseases aforementioned, which are associated with the ventricular system.
Aim
The objective of this study was to develop user-friendly graphical user interface for calculating fourth ventricle volume as part of diagnosis of neurological diseases. Hence, a modelled relationship between linear ventricular size (width, length and thickness) and ventricular volume (width*length*thickness) has been established. This led to the development of easy, fast, user friendly and
accurate application software to calculate ventricular volume for clinical application.
MATERIALS
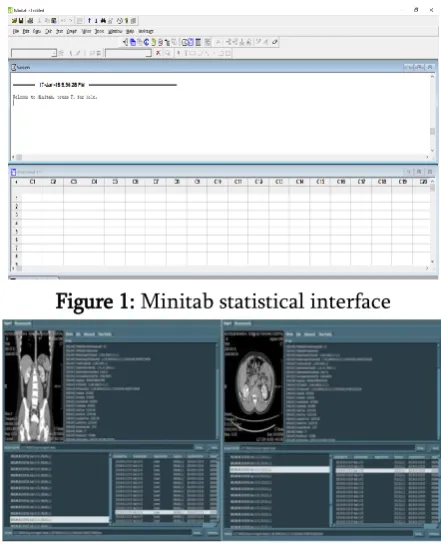
Materials used were Minitab statistical tool and MeVisLab modelling tool shown in Figure 1 and 2 respectively.
Figure 1: Minitab statistical interface
Figure 2: MeVisLab interface with image data
II. Methodology
The approach involved the use of MeVisLab measurements tool to measure the linear and volume dimensions using Voxel Count Method. Whilst the modeling was done with Minitab statistical tool to model the relationship between the linear and volume measurements.
previous studies; Minitab was used to compute significant differences. Descriptive statistics was also undertaken to obtain the average, standard deviation, median and coefficient of variation and coefficients of lineal correlation.
Mathematical Model
Minitab statistical modeling tool and the written code was done with python programming language. females for the age group (21-30, 31-40, 41-50, 51-60 and 61-70). Each of the models is represented by five elements, namely: the model equation, the standard deviation, predictor, p-value and residual plot. The modeled relationship between the two parameters was linear with 4th VV as the dependent variable and
4th VD as the independent. Below are the model
equations for the age groups for both genders.
Model Equations for Age Groups
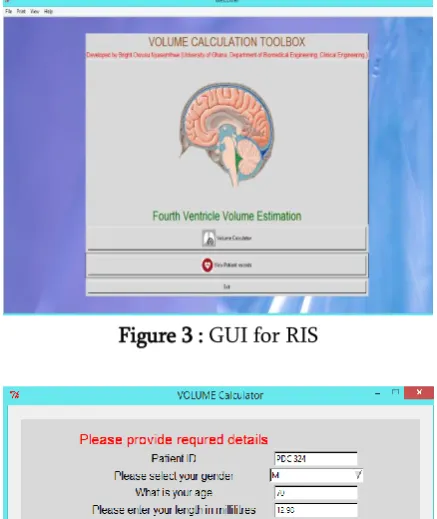
The application software was written using python programming language. The python application uses the python Tkinter windows system. It is available as an installable tool in windows, also as an executable file, or as a python script. As such it is a platform independent and can be used in any operating system (Microsoft Windows, Linux or Mac OS X). The application was created with an intuitive user interface and has a backend SQLite serving as a database. No UNIX or scripting knowledge is required so it is easily accessible to the average user. A graphical user interface (GUI) was created to permit the entry of various input parameters relating to fourth ventricle volume. These input parameters include 4th VD (VL, VW and VT), gender and age.
Capturing the input parameters, will automatically generate the volume as the output parameters. The GUI also allows the recall of the reference chart for storage of the form data into database mainly for later analysis and printing. The script or code for the desktop application is provided in Appendix
Graphic User Interface
the brain dimensions as an input to generate the volume of the fourth ventricle as an output.
Figure 3 : GUI for RIS
Figure 4 : GUI for volume estimate
IV. DISCUSSION
The statistical modeling process was based on linear approach for modeling the relationship between a scalar dependent variables and independent variables. The relationships between the parameters were modeled using linear predictor functions whose unknown model parameters were calculated from the data. Conversely, the linear regression were focused on the conditional probability distribution based on Normal Probability Plot (NPP) of a given variables. The descriptive parameters of the modeled equations were obtained using the normal histogram, normal probability plot based on Chambers et al., 1983 [11], Versus Fits and Versus Order. These were the four
graphical techniques for assessing whether or not a data set is approximately normally distributed. In addition, the modeled equations of all the parameters were plotted against a theoretical normal distribution in such a way that the points formed an approximated straight line.
Additionally, the plots were based on the residual plots which formed graphs that were used to examine the goodness-of-fit in the linear regression analysis. This helps to find out whether the ordinary least squares assumptions were being played. The assumptions satisfactorily produced unbiased coefficient estimates with the minimal variance (≤ 0.05). As a result each model comprises of four elements, namely: the model equation, the standard deviation, residual plot and the predictor. The predictor explains how best the model fits the data, volume (4th VV) against linear dimensions 4th VD
(length, width and thickness). The relationship between 4th VV and 4th VD as depicted by the
equation is a positive linear relationship, which
implies that an increase in 4th VD (length, width and
thickness) results to increase in 4th ventricle volume
(4th VV) and vice versa.
V. CONCLUSION
Mathematical modeling and measuring tools with MeVisLab holds a high prospect in medical imaging for measuring, predicting organ volumes. This has been used to develop a comprehensive decision support application software tool for easy, accurate and user-friendly GUI as diagnostic procedure for the calculation of volume of fourth ventricle to aid neurological diagnosis in clinical practice.
VI.
REFERENCES
Adults in Zaria-Nigeria. Sub-Saharan African J Med. 2015;2(2):89-92.
[2]. Hendee WR. Physics and applications of medical imaging. Rev Mod Physic. 1999;71(2):444-50.
[3]. Zhang Y, Londos E, Minthon L, Wattmo C, Liu H, Aspelin P, et al. Usefulness of computed tomography linear measurements in diagnosing Alzheimer’s disease. Acta radiol. 2008;49(1):91-7.
[4]. Gawler J, Bull J, Marshall J, Boulay G Du. Computerized tomography (the EMI Scanner): a comparison with pneumoencephalography and ventriculography. J Neurol Neurosurg Psychiatry. 1976;39(3):203-11.
[5]. Rohlfing T, Sullivan E V., Pfefferbaum A. Deformation-based brain morphometry to track the course of alcoholism: Differences between intra-subject and inter-subject analysis. Psychiatry Res - Neuroimaging. 2006;146(2):157-70.
[6]. Gallia GL, Rigamonti D, Williams MA. The diagnosis and treatment of idiopathic normal pressure hydrocephalus. Nat Clin Pract Neurol. 2006;2(7):375-81.
[7]. Ashtari M, Zito JL, Gold BI, Lieberman JA, Borenstein MT, Herman PG. Computerized Volume Measurement of Brain Structure. Invest Radiol. 1989;25(7):798-805.
[8]. Zilundu. Morphometric Study of Ventricular Sizes on Normal Computed Radiology Centre in Harare-a Pilot Study. 2012;
[9]. Jacoby RJ, Levy R, Dawson JM. Computed tomography in the elderly: I. The normal population. Br J PyschiatryBritish J Pyschiatry. 1980;136:249-55.
[10]. Aziz A, Hu Q, Nowinski WL. Morphometric Analysis of Cerebral Ventricular System from MR Images. 2004;5369:574-82.
[11]. Park S, Lee JK, Lee C. Development of a Korean adult male computational phantom for internal
dosimetry calculation. Radiat Prot Dosimetry. 2006;121(3):257-64.