Ayurvedic Plant Leaves Classification Using combination of
Features Feature
Dr. Sheshang Degadwala1, Dhairya Vyas2
1Head of Department, Computer Engineering Department, Sigma Institute of Engineering, Vadodara, Gujarat,
India
2Managing Director, Shree Drashti Infotech LLP, Vadodara, Gujarat, India
ABSTRACT
Ayurvedic plants identification is most important task in ayurvedic medicinal industry. Sometimes, it might be difficult to identify ayurvedic plant. This problem can be simply solved by presenting a new recognition approach based on Leaf Features Fusion and Classification algorithms for classifying the different types of plants. All the plants in this world are identifying in terms of its leaves. And, Leaves are different to one another due to its characteristics such as the shape, color, texture and the margin. There are many features of leaf such as Color features, Vein features, texture features, Shape features and invariant features. Hybrid Features are made from all features. Also classification approach presented in this research is multi-level. So anyone can identify plant
type for further application. In this research paper OTSU’S and contour edge detection methods are used for segmentation and ANN, RF and SVM is used as classifier for classification.
Keywords : Plant Identification, leaf classifier, OTSU’S, Contourlet Edge Detection, GLCM, SVM, ANN
I.
INTRODUCTIONAyurveda is an ancient system of medicine practiced in India and has its roots in the Vedic times, approximately 5000 years ago. The main constituents of ayurvedic medicines are plant leaves and other parts of plants like root, bark etc. More than 8000 plants of Indian origin have been found to be of medicinal value. Combinations of a small subset amounting to 1500 of these plants are used in Herbal medicines of different systems of India. Specifically, commercial Ayurvedic preparations use 500 of these plants. Over 80% of plants used in ayurvedic formulations are collected from the forests and wastelands whereas the remaining are cultivated in agricultural lands [1]. Identifying plants is a work done primarily by taxonomist, a specialized biologist who groups living organisms into categories. The
work commonly uses herbaria, a collection of preserved dried plants and their identification keys. In order to identify a new sample, the sample is compared to the collection. This procedure works well to identify popular plants. However, identifying a wild plant is more challenging. Wild plants often grow locally in a limited area or a remote area. Thus, it is less studied and recognized by taxonomist [2].
carried out to make the features comparable. Feature selection is then fulfilled using Neighborhood Component Feature Selection (NCFS) technique to select the subset of highly discriminating features. Finally, classification step is achieved using k-Nearest Neighbor (k-NN) classifier [3].
II.
RELATED WORKManojkumar P., Surya C. M., Varun P. Gopi. [1] This paper explores feature vectors from both the front and back side of a green leaf along with morphological features to arrive at a unique optimum combination of features that maximizes the identification rate. A database of medicinal plant leaves is created from scanned images of front and back side of leaves of commonly used ayurvedic medicinal plants. The leaves are classified based on the unique feature combination. Identification rates up to 99% have been obtained when tested over a wide spectrum of classifiers.
Sigit Adinugroho, Yuita Arum Sari. [2] In this paper a framework to identify plant species based on leaf's characteristics is introduced. First, 31 features of leaves from 13 species are extracted that represents color, shape and texture of the leaves. Then, the features are selected according to their correlation to the class label. The data with 25.8% pruned features are then used to train a feed forward neural network. The network is trained and tested using 975 images by implementing 10-fold mechanism yields 95.54% accuracy.
Heba A. Elnemr. [3] In this paper an efficient automatic leave identification system based on texture features is presented. The proposed system is based on several steps. First, the leaf image is pre-processed to remove the noise, enhance the image appearance and extract the region of interest (ROI). Next, texture features, including Curvelet transform
descriptors (CTD), local binary pattern (LBP) and grey level co-occurrence matrix (GLCM) texture features, are extracted and normalized. The proposed technique is tested and evaluated on Flavia Leaves dataset. The selected 16 features achieved an accuracy of 98% using K-NN classifier. The system is evaluated using K-fold cross-validation method.
Anilkumar Muthevi, Dr.Ravi babu Uppu. [4] Introduces utilizing the magnitude component of Local Binary Pattern (LBP) apart from sign component (which is considered as conventional method). We applied this Completed Local Binary Pattern (CLBP) on plant leaf classification by randomly taken divergent blocks of each texture data set. This approach is also useful for the identification of quality leaves for the automation of grading process in Commercial crops like Tobacco etc. By combining Center pixel CLBP (CCLBP), Signed component of CLBP (SCLBP) and magnitude part of CLBP (MCLBP) there is a considerable Development can be achieved for rotationally invariant texture classification.
Anusha Rao, Dr. S.B. Kulkarni. [5] In this paper proposed work is a combination of image enhancement, morphological feature, SIFT feature and classification technique. For efficient image enhancement, auto-regressive model is adopted here. A comparative study of classification performance is presented which shows the robustness of proposed model.
Perimeter (P), Eccentricity (E), Solidity, Perimeter Ratio of Diameter, Orientation, Narrow Factor, Extent, Euler Number, Equiv Diameter, Circularity, Rectangularity, Perimeter Ratio of Length & Width Complexity, & Compactness.
III.
METHODOLOGYA. Pre-Processing
In this method, the image is converted into RGB to Grayscale image. Gray scale is simply reducing complexity from a 3D pixel value (R, G, B) to a 1D value. Many tasks do not fare better with 3D pixel. This method is also resizing and cropping the image.
B. Segmentation
i. OTSU’S Segmentation: This Method is used to automatically perform clustering-based image Thresolding,or, the reduction of a gray level image to a binary image. In Otsu's method we exhaustively search for the threshold that minimizes the intra-class variance (the variance within the class), defined as a weighted sum of variances of the two classes:
σω2 (t) = ω0(t)σ20(t) + ω1 (t) σ12(t)
Weights ω0and ω1 are the Probabilities of the two classes separated by a thresold t, and σ02 and σ12 are variane of these two classes.
ii. Contour Edge Detection: The Edge Detection includes a variety of mathematical methods that aim at identifying points in a digital image at which the image brightness changes sharply or, more formally, has discontinuities. The points at which image brightness changes sharply are typically organized into a set of curved line segments termed edges. The same problem of finding discontinuities in one-dimensional signals is known as step detection and the problem of finding signal discontinuities over time is known as change detection. Edge detection is a fundamental tool in image processing, machine vision and computer
vision, particularly in the areas of feature detection and feature extraction. The Contourlet edge detection uses a double filter bank structure to get the smooth contours of images. In this double filter bank, the Laplacian pyramid (LP) is first used to capture the point discontinuities, and then a directional filter bank (DFB) is used to form those point discontinuities into linear structures.
Sobel edge detector computes the gradient by using the discrete differences between rows and columns of a 3X3 neighbourhood. The Sobel operator is based on convolving the image with a small, separable, and integer valued filter.
Gx Gy Prewitt operator edge detection masks are the one of
the oldest and best understood methods of detecting edges in images The Prewitt edge detector uses the following mask to approximate digitally the first derivatives Gx and Gy.
Gx Gy Robert edge detection, the vertical and horizontal
edges bring out individually and then put together for resulting edge detection. The Roberts edge detector uses the following masks to approximate digitally the first derivatives as differences between adjacent pixels.
Laplacian of Gaussian (LOG) detector finds edges by looking for zero crossings after filtering f(x, y) with a Laplacian of Gaussian filter. In this method, the Gaussian filtering is combined with Laplacian to break down the image where the intensity varies to detect the edges effectively. It finds the correct place of edges and testing wider area around the pixel. Canny edge detection is a multistage algorithm to detect a wide range of edges in images. This detector finds edges by looking for local maxima of the
1 2 1
0 0 0 -1 -2 -1
-1 0 1 -2 0 2
gradient of f(x, y). The gradient is calculated using the derivative of a Gaussian filter. The method uses two thresholds to detect strong and weak edges and includes the weak edges in the output only if they are connected to strong edges.
C. Feature Extraction i. Shape Features [1]:
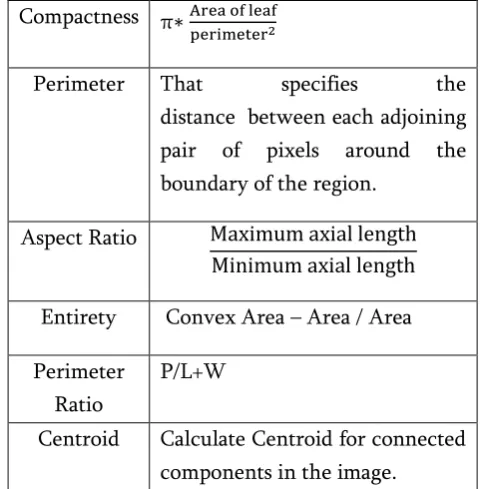
Table 1: Mathematical formula and definition for Shape Feature
Equivalent
Diameter √4 ∗ Areaπ
Area The Area Specifies the actual number of pixels in the region.
Solidity Convex area
Original area
Convex Area That specifies the number of pixels in convex image. A convex image is a binary image that specifies the smallest convex polygon that can contain the region. Each row of the matrix contains the x and y coordinates of one vertex of the polygon, with all pixels within the polygon filled in. minor axis of the ellipse that has the same normalized second central moments as the region.
Extent no. of pixels in the region
no. of pixels in the bounding box
Compactness π∗Area of leaf perimeter2
Perimeter That specifies the distance between each adjoining pair of pixels around the boundary of the region.
Aspect Ratio Maximum axial length
Minimum axial length
Entirety Convex Area – Area / Area
Perimeter Ratio
P/L+W
Centroid Calculate Centroid for connected components in the image.
ii. Texture Features: From the Gray Level Co-occurrence Matrix (GLCM) following features are calculated. Where, G is the number of gray levels used. P is the probability distribution in the GLCM. Energy measures the orderliness how regularly and orderly pixels are in window.
Energy = ∑G−1i=0 ∑G−1j=0 Pij2
Contrast is the difference in color and light between parts of an image. degree of relationship between two Pixels.
Correlation = 𝛖𝟏
Entropy is the amount of information which must be coded for by a compression algorithm.
Where, Xi,I is the value of image pixel j of color channel i. XIis the mean for each channel i. υi is the Standard Deviation, 𝑆𝑖 is Skewness and 𝐾𝑖 is Kurtosis for each Channel.
D. Classification Tools
i. SVM Classifier: Support vector machine is a discriminative classifier formally defined by separating hyper plane. SVM are generally used for classification or regression challenges.
The decision function is fully specified by a subset of training samples and the support vectors.
Figure 1 : SVM Classifier
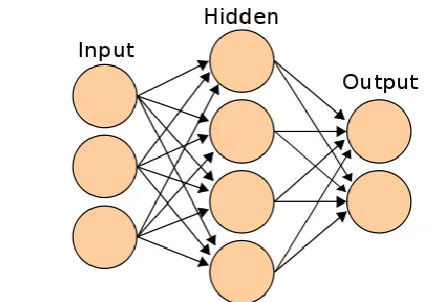
ii. ANN Classifier: An artificial neural network is a network of simple elements called artificial neurons, which receive input, change their internal state (activation) according to that input, and produce output depending on the input and activation.
Figure 2 : A simple neural network Classifier
A simple neural network can be represented as shown in the figure below The linkages between nodes are the most crucial finding in an ANN. We
will get back to “how to find the weight of each linkage” after discussing the broad framework. The
only known values in the above diagram are the
inputs. Let’s call the inputs as I1, I2 and I3, Hidden
states as H1, H2, H3 and H4, Outputs as O1 and O2. Every linkage calculation in an Artificial Neural Network (ANN) is similar. In general, we assume a sigmoid relationship between the input variables and the activation rate of hidden nodes or between the hidden nodes and the activation rate of output nodes.
Let’s prepare the equation to find activation rate of
H1.
Log (H1) = W (I1H1) * I1 + W (I2H1) * I2 + W (I3H1) * I3 + Constant = f = > P (H1) = 1/(1+e^(-f)).
iii. Random Forest(R-F):
Random forest is tree based algorithm which involves several decision tree which constructed from random selection of data as well as random selection of variables. Combine output from each tree and letting most popular resulted output from all ensemble of tree, which is used to improve classification accuracy. Random forest is used for identifying important features from the training set. Random decision forests correct for decision trees habit of over fitting to their training set. The generalization error of decision tree depends on strength of individual tree in the forest and correlation among decision tree. Most of tree is give correct prediction for most part of data. Random inputs and random feature calculated from dataset which is suited to giving best results of classification. It can also works missing data.
Algorithm:
Each tree is constructed as Follows:
1. Take number of records in training set will be N. M is input variables in the classifier.
2. Initialize value of k as input variables that used to determine the decision at a node of the tree. 3. Where k << M. (where k is constant during forest
4. Choose a training set for this tree by choosing n times with replacement from all M available training cases.
Remaining cases used to estimate error of tree by predicting the class.
5. Choose k variables for each node of tree randomly on which to base the decision at that node. Calculate the best split based on these k variables in the training set.
6. Each tree are fully grown.
Each tree grown on different sample of original data. For prediction a new sample is pushed down the tree. It is assigned the label of the training sample in the terminal node it ends up in. This procedure is iterated over all trees in the ensemble, and the average decision of all trees is resulted as random forest prediction.
IV.
PROPOSED SYSTEMFigure 3: Block Diagram of Proposed System
Block Diagram of Proposed System shown in the fig. 4. There were two stages operation for system: Training phase and Testing phase. In the Training phase, the images of leaf dataset are given as input to the system one by one. The Pre-Processing step verifies that all the images have same standard resolution. The next step is to convert color image to grayscale image and then into binary image. There were contour edge detector is used for segmentation. It uses a double filter bank structure to get the smooth contours of images. In this double filter bank, the laplacian pyramid (LP) is first used to capture the point discontinuities, and then a directional filter bank (DFB) is used to form those point
discontinuities into linear structures. The Features Extraction stage extracts shape, texture, color and invariant features from binary to color images respectively and store the values in another database. These are repeatable for all the leaves in the leaf dataset. The classifier is used for classifying the different type of leaf and trained with selected feature value from the feature dataset. ANN, RF and SVM methods are used for classification. The classes are separated by group of leaf. In one group all leaves are minor differentiate from each other.
In the Testing Phase, first test the image then it passes through all stages and selected features are extracted from it. Then, these values are given to the input of ML Classifier. It decides whether the test sample image matches with any class of images. Then it gives perfect result of the leaf identification in the system.
V.
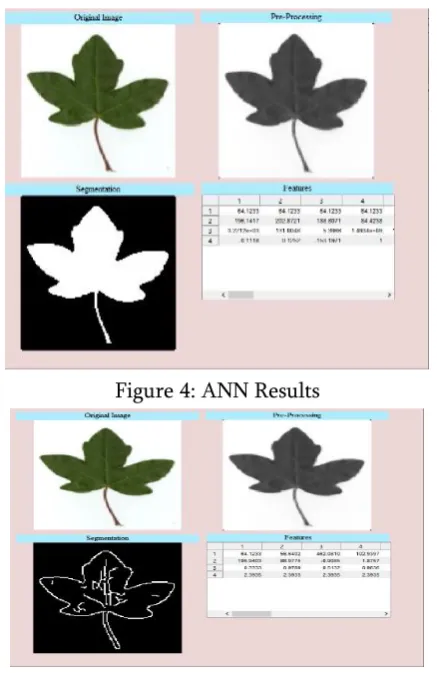
RESULTS AND ANALYSISFigure 4: ANN Results
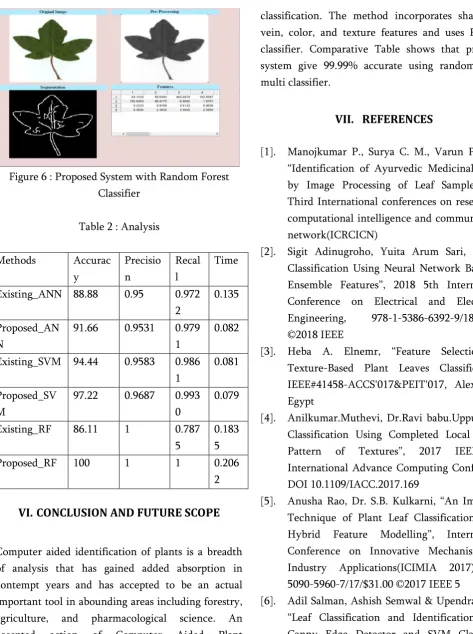
Figure 6 : Proposed System with Random Forest Classifier
Table 2 : Analysis
Methods Accurac y
Precisio n
Recal l
Time
Existing_ANN 88.88 0.95 0.972 2
0.135
Proposed_AN N
91.66 0.9531 0.979 1
0.082
Existing_SVM 94.44 0.9583 0.986 1
0.081
Proposed_SV M
97.22 0.9687 0.993 0
0.079
Existing_RF 86.11 1 0.787 5
0.183 5
Proposed_RF 100 1 1 0.206
2
VI.
CONCLUSION AND FUTURE SCOPE
Computer aided identification of plants is a breadth of analysis that has gained added absorption in contempt years and has accepted to be an actual important tool in abounding areas including forestry, agriculture, and pharmacological science. An accepted action of Computer Aided Plant identification systems contains four steps, namely, architecture the leaf database, angel enhancement, analysis (extraction of leaf), feature extraction and
classification. The method incorporates shape and vein, color, and texture features and uses RF as a classifier. Comparative Table shows that proposed system give 99.99% accurate using random forest multi classifier.
VII.
REFERENCES
[1]. Manojkumar P., Surya C. M., Varun P. Gopi,
“Identification of Ayurvedic Medicinal Plants by Image Processing of Leaf Samples”,2017
Third International conferences on research in computational intelligence and communication network(ICRCICN)
[2]. Sigit Adinugroho, Yuita Arum Sari, “Leaves
Classification Using Neural Network Based on
Ensemble Features”, 2018 5th International
Conference on Electrical and Electronics Engineering, 978-1-5386-6392-9/18/$31.00 ©2018 IEEE
[3]. Heba A. Elnemr, “Feature Selection for
Texture-Based Plant Leaves Classification”,
IEEE#41458-ACCS'017&PEIT'017, Alexandria, Egypt
[4]. Anilkumar.Muthevi, Dr.Ravi babu.Uppu, “Leaf
Classification Using Completed Local Binary
Pattern of Textures”, 2017 IEEE 7th
International Advance Computing Conference, DOI 10.1109/IACC.2017.169
[5]. Anusha Rao, Dr. S.B. Kulkarni, “An Improved
Technique of Plant Leaf Classification Using
Hybrid Feature Modelling”, International
Conference on Innovative Mechanisms for Industry Applications(ICIMIA 2017),978-1-5090-5960-7/17/$31.00 ©2017 IEEE 5
[6]. Adil Salman, Ashish Semwal & Upendra Bhatt,
“Leaf Classification and Identification using Canny Edge Detector and SVM Classifier”,
[7]. Pankaj K & Dr. Thippeswamy G, “Survey on Leaf Recognization and Classification”,
International Conference on Innovative Mechanisms for Industry Applications(ICIMIA 2017)
[8]. Arturo Oncevay-Marcos, Ronald Juarez-Chambi, Sofia Khlebnikov-Nunezand & Cesar Beltran-Castanon, “Leaf-Based Plant Identification Through Morphological
Characterization in Digital Images”, Springer
International Publishing Switzerland 2015,G. Azzopardi and N. Petkov (Eds.): CAIP 2015, Part II, LNCS 9257, pp. 326–335, 2015,DOI: 10.1007/978-3-319-23117-4 28
[9]. Michael Rzanny, Marco Seeland, Jana
Wäldchen & Patrick Mäder, “Acquiring and
pre-processing leaf images for automated plant identification: understanding the trade-off
between effort and information gain”, Rzanny
et al. Plant Methods (2017) 13:97,DOI 10.1186/s13007-017-0245-8
[10]. D Venkataraman & Mangayarkarasi N,
“Support Vector Machine Based Classification of Medicinal Plants Using Leaf Features”, 2017
International Conference on Advances in Computing, Communications and Informatics (ICACCI)
[11]. Shweta Srivastava, “Weka: A Tool for Data
preprocessing, Classification, Ensemble,
Clustering and Association Rule Mining”,
International Journal of Computer Applications (0975 - 8887), vol. 88, no.10, Feb. 2014.
[12]. M. Ramaraj, S. Raghavan, V. Raghunath and
Wahid A. Khan, “Histogram variance
controlled bleeding detectors for wireless
capsule endoscopic images”, J. Med. Imaging
Health Inf., vol. 4, no. 4, 2014.
[13]. Mathew. M. and Gopi V. P., “Transform based
bleeding detection technique for endoscopic
images”, 2nd International Conference on
Electronics and Communication Systems (ICECS), pp. 1730-1734, Feb.2015.
[14]. Tonmoy Ghosh, Shaikh Anowarul Fattah and
Khan Arif Wahid, “Automatic bleeding
detection in wireless capsule endoscopy based
on RGB pixel intensity ratio”, International
Conference on Electrical Engineering and Information & Communication Technology (ICEEICT), pp. 1-4, 2014.
[15]. Tonmoy Ghosh, Syed Khairul Bashar, Md. Samiul Alam, Khan Wahid and Shaikh
Anowarul Fattah, “A statistical feature based novel method to detect bleeding in wireless
capsule endoscopic images”, 3rd International
Conference on Informatics, Electronics & Vision (ICIEV), pp. 1-4, 2014.
Cite this Article
Dr. Sheshang Degadwala, Dhairya Vyas, "Ayurvedic Plant Leaves Classification Using combination of Features Feature", International Journal of Scientific Research in Computer Science, Engineering and Information Technology (IJSRCSEIT), ISSN : 2456-3307, Volume 3 Issue 6, pp. 671-678, July-August 2018.