Comparative Analysis of Clustering Algorithm for Wind Power
Dr. Sumathy P1, Senthilkumar P21Assitant Professor, BDU, Trichirappali, Tamilnadu, India 2M. Phil Scholar, BDU, Trichirappalli,Tamilnadu, India ABSTRACT
Data mining is the process of automatically finding useful information in large data repositories. In the field of software data analysis is considered as a very useful and important tool as the task of processing large volume of data is rather tough and it has accelerated the interest of application of such analysis. The purpose of deploying data mining techniques is discovering important patterns from datasets and also provides capabilities to predict the outcome of a future observation. The process of clustering the requirements allows reducing the cost of software development and maintenance. Clustering is a division of data into groups of similar objects. Representing the data by fewer clusters necessarily loses certain fine details, but achieves simplification. It models data by its clusters. Data modeling puts clustering in a historical perspective rooted in mathematics, statistics, and numerical analysis. In this paper, we can implement two clustering algorithms such as centroid based K-Means clustering and representative object based Fuzzy C means clustering are compared to real time wind datasets. These algorithms are evaluated in terms of time, accuracy, error rate and random index values. FCM can produce efficient results than K-means algorithm.
Keywords : Data Clustering, Modeling Scheme, K-Means Clustering, Fuzzy C Means Clustering, Centroid Based Calculation
I.
INTRODUCTIONData Mining is the process of posing queries to large amounts of data sources and extracting patterns and trends using statistical and machine learning techniques. It integrates various technologies including database management, statistics and machine learning. Data mining has applications in numerous disciplines including medical, financial, defense and intelligence. Data mining tasks include classification, clustering, making associations and anomaly detection. For example, data mining can extract various associations between people, places or words. During recent years there have been many developments in data mining. The process of digging through data to discover hidden connections and predict future trends has a long history. Sometimes referred to as "knowledge discovery in databases," the
we need to mine very large databases. Therefore, it is critical that we need to understand the limitations of the data mining algorithms. To understand the limitations, we need to study the foundations of data mining. We need to explore the time and space complexity of the algorithms. There are techniques such as inductive logic programming and rough sets that have underpinnings in logic and mathematics. One needs to explore these techniques for data mining and examine the computational complexity aspects.
We also need to understand the complexity of the various search algorithms being used for market basket analysis.Cluster analysis or clustering is the task of grouping a set of objects in such a way that objects in the same group (called a cluster) are more similar (in some sense or another) to each other than to those in other groups (clusters).
It is a main task of exploratory data mining, and a common technique for statistical data analysis, used in many fields, including machine learning, pattern recognition, image analysis, information retrieval, bioinformatics, data compression and computer graphics. Cluster analysis itself is not one small distances among the cluster members, dense areas of the data space, intervals or particular statistical distributions. Clustering can therefore be formulated as a multi-objective optimization problem. The appropriate clustering algorithm and parameter settings (including values such as the distance function to use, a density threshold or the number of expected clusters) depend on the individual data set and intended use of the results. Cluster analysis as such is not an automatic task, but an iterative process of knowledge
discovery or interactive multi-objective optimization that involves trial and failure. It is often necessary to modify data preprocessing and model parameters until the result achieves the desired properties. The subtle differences are often in the usage of the results: while in data mining, the resulting groups are the matter of interest, in automatic classification the resulting discriminative power is of interest.
II.
RELATED WORKsub-domains. We distinguish clustering from segmentation to emphasize the importance of the automatic learning process.
GUO, et.al, …[2] “A Hybrid Clustering Algorithm Based on Dimensional Reduction and K-Harmonic Means” analyzed the field of data mining and knowledge discovery is emerging as a new, fundamental research area with important applications to science, engineering, medicine, business, and education. Data mining attempts to formulate analyze and implement basic induction processes that facilitate the extraction of meaningful information and knowledge from unstructured data. Data mining draws upon several roots, including statistics, machine learning, databases, and high performance computing. Clustering is a data mining technique that mainly classifies the data sets into several clusters based on the measure standard of similarity between the patterns. Clustering procedures partition a set of patterns into clusters such that patterns in the same cluster are more similar to each other than in different clusters according to some predefined criteria. The clustering problem has been addressed in many contexts and by researchers in many disciplines. In the system of the clustering analysis, the input is a group of patterns and a measure standard of similarity (or distance) between patterns, and the output is clusters of the patterns, and these clusters can constitute a district or the district structure. In this paper, we will propose a new hybrid algorithm which is based on dimensional reduction approach and a kind of partitional clustering algorithm. Firstly we project the data with high dimension into the space with lower dimension, and finding out the projection which can reflect the characteristic or structure of the data. Then we cluster the projected data by using a commonly used clustering algorithm. Because of the advantages of KHM, we use KHM to develop our new algorithm. We will also do some numerical experiments on three data sets, and the numerical results illustrate
that the new clustering algorithm has advantages in the computation time, iteration numbers and clustering results in most cases, and it is also an algorithm which is suitable for large scale data sets.
Zhang, et.al,…. [3] “K-Harmonic Means - A Data Clustering Algorithm” provided the function for measuring goodness of data clustering is the total within-cluster variance, or the total mean-square quantization error (MSE). The K-Means (KM) major problem; a similar issue exists for an alternative algorithm, Expectation Maximization (EM), although to a lesser extent. In this paper, we propose a new clustering method called the K-Harmonic Means algorithm (KHM). KHM is a center-based clustering algorithm which uses the Harmonic Averages of the distances from each data point to the centers as components to its performance function. It is demonstrated that K-Harmonic Means is essentially insensitive to the initialization of the centers. In certain cases, K-Harmonic Means significantly improves the quality of clustering results comparing with both K-Means and EM, which are the two most popular clustering algorithms used in data exploration and data compression. A unified view of the three performance functions, Means', K-Harmonic Means' and EM's, are given for comparison. This paper takes a totally different approach by changing MIN () used in KM to HA () (Harmonic Average), which is similar to MIN () but “softer”, to make the performance function “easier to optimize” by an algorithm that is essentially insensitive to initialization.
community to construct a nonlinear version of a linear algorithm using the 'kernel method ', e.g. Support Vector Machines (SVMs), kernel principal component analysis, kernel fisher discriminant analysis and the recent kernel clustering algorithms. In unsupervised clustering algorithms using kernel method, typically, a nonlinear mapping is used first to map the data into a potentially much higher feature space, where clustering is then performed. A drawback of these kernel clustering algorithms is that the clustering prototypes lie in high dimensional feature space and hence lack clear and intuitive descriptions unless using additional projection approximation from the feature to the data space as done in the existing literatures. In this paper, a novel clustering algorithm using the 'kernel method' based on the classical fuzzy clustering algorithm (FCM) is proposed and called as kernel fuzzy c-means algorithm (KFCM). KFCM adopts a new kernel-induced metric in the data space to replace the original Euclidean norm metric in FCM and the clustered prototypes still lie in the data space so that the clustering results can be reformulated and interpreted in the original space. Our analysis shows that KFCM is robust to noise and outliers and also tolerates unequal sized clusters. And finally this property is utilized to cluster incomplete data. In this paper, an alternative kernel-based fuzzy c-means (KFCM) algorithm is proposed to cluster incomplete data. Unlike the usual way utilizing kernel method in FCM, the proposed KFCM clustering algorithm is performed still in original data space, i.e., prototypes lie in data space. Furthermore, KFCM adopts a more robust kernel-induced metric different from the Euclidean norm in original FCM. By a similar way, we applied the proposed KFCM to cluster incomplete data, and it is shown that WSP and NPS are two special cases of KFCM when clustering incomplete data. Furthermore, because KFCM has better outlier and noise immunity than FCM, it is especially considerable research in machine learning and
pattern recognition. For clustering points in Rn-a
main application focus of this paper- one standard approach is based on generative models, in which algorithms such as EM are used to learn a mixture density. These approaches suffer from several
drawbacks. First, to use parametric density estimators,
harsh simplifying assumptions usually need to be
made (e.g., that the density of each cluster is Gaussian). Second, the log likelihood can have many local minima and therefore multiple restarts are
required to find a good solution using iterative
algorithms. Algorithms such as K-means have similar
problems. A promising alternative that has recently
emerged in a number of fields is to use spectral
methods for clustering. Here, one uses the top eigenvectors of a matrix derived from the distance between points. We note that there are other, related algorithms that can give good results on asubset of these problems, but we are aware of no equally simple algorithm thatcan give results comparable to these. For example, we noted earlier how K-meanseasily fails when clusters do not correspond to convex regions. There are some intriguing similarities
between spectral clustering methods and KernelpeA,
which has been empirically observed to perform clustering. The maindifference between the first steps of our algorithm and Kernel PCA with a
Gaussiankernel is the normalization of A (to form L)
and X. These normalizations do improvethe
performance of the algorithm, but it is also straightforward to extend ouranalysis to prove
conditions under which Kernel PCA will indeed give
III.
METHODS AND MATERIAL especially for dataset containing large number of clusters. Since, in each iteration, the k-means algorithm computes the distances between data point and all centers, this is computationally very expensive especially for huge datasets. Therefore, we do can use from previous iteration of k-means algorithm. We can calculate the distance for each data point to nearest cluster. At the next iteration, we compute the distance to the previous nearest cluster. The point stays in its cluster, if the new distance is less than or equal to the previous distance, and it is not required to compute its distances to the other cluster centers. This saves the time required to compute distances to k-1 cluster centers. “K-means algorithm is one of first which a data analyst will use to investigate a new data set because it is algorithmically simple, relatively robust and gives “good enough” answers over a wide variety of data sets.” The K-means algorithm is the most commonly used partitioned clustering algorithm because it can be easily implemented and is the most efficient one in terms of the execution time.The basic algorithm pseudo code as follows:
Input: X = {x1, x2, x3,…..,xn} be the set of data points , Y= {y1,y2,y3…yn} be the set of data points and V = {v1,v2,v3,….,vn} be the set of centers
Step 1: Select „c‟ cluster centers arbitrarily
Step 2: Calculate the distance between each pixels and cluster centers using the Euclidean Distance metric as follows
Step 4: New cluster center is calculated using
∑ --- (2)
Where Vi denotes the cluster center, ci denotes the number of pixels in the cluster
Step 5: The distance among every pixel and new obtained cluster facilities is recalculated
Step 6: If no pixels were reassigned then stop. Otherwise repeat steps from 3 to 5
Limitations:
The major problem with this algorithm is that it is sensitive to the selection of the initial partition and may converge to local optima.
It is computationally expensive and requires time proportional to the product of the number of data items, number of clusters and the number of iterations.
The quality of the resulting clusters heavily depends on the selection of initial centroids which causes it to converge at local optimum.
Empty clusters problem, which occur to defined fixed cluster in staring of the algorithm.
fuzzy c means clustering
attempts to partition a finite collection of pixels into a collection of C fuzzy clusters with respect to some given criterion. Depending on the data and the application, different types of similarity measures may be used to identify classes. Some examples of values that can be used as similarity measures include distance, connectivity and intensity.
Pseudo code for FCM
The „n‟ sample of the input data points is expressed as X = {x1, x2, …., xn} while the corresponding cluster centers of the image data points is expressed as V = {v1v2,…., vc}, where c is the number of clusters. μij is the membership degree of the data point xi to the cluster centre vj Fuzzy clustering computes the optimum partition based on the minimization of the objective function given that μij satisfies
∑ ……….. (3) The cluster center (i.e centroid) is computed as
∑
The new membership value is further computed as
criterion for terminating the iteration. The most important difference is that in FCM, each has a weighted associated with a specify cluster so, a point
doesn‟t have cluster as much as a little or more association to cluster.FCM iteratively moves the cluster centers to the right location within a dataset. To be specific introducing the fuzzy logic in K-Means clustering algorithm is the Fuzzy C-Means algorithm in general. Infact, FCM clustering techniques are based on fuzzy behavior and they provide a technique which is natural for producing a clustering where membership weights have a natural interpretation but not probabilistic at all. This algorithm is basically similar in structure to K-Means algorithm and it also behaves in a similar fashion. It was very determine by increase distance to the center of the cluster. FCM will tend to run faster than K-means, since it is actually doing more work. Every point is calculated with each cluster, and many operations are involved in each evaluation.
IV.
EXPERIMENTAL RESULTSMATLAB is used as front end Wind datasets can be uploading and view the file in form of CSV format can be shown in fig 1. The WIND datasets are retrieved from https://www.kaggle.com/c/GEF2012-wind-forecasting/data and 1000 records are experimented with four main components. Table 1 gives attributes details and shown as follows:
Attribute Description
u(2.34) Zonal components of wind v(-0.79) Meridional wind components ws(2.47) Wind Speed
wd(108.68) Wind direction
Fig 1: Upload the dataset
After uploading, the datasets can be converted into structured format as shown in fig 2.
Fig 2. Preprocessed data
The preprocessed data can be plotted in area of graph and can be shown in fig 3.
Fig 3: Data points
The K- Means clustering algorithm can be performed with two clusters and mark the centroid points, cluster 1 and cluster 2 values are shown in fig 4.
Fig 4: K- Means clustering
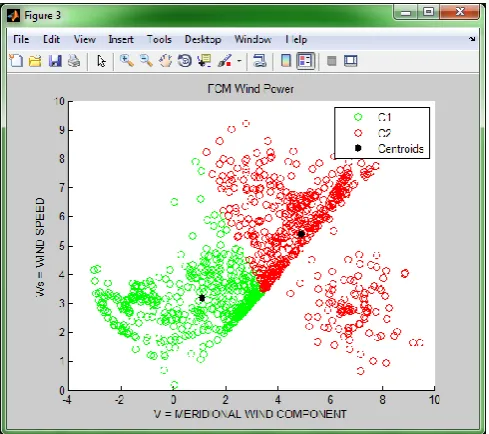
The Fuzzy C means clustering can be shown in Fig 5. Fuzzy C means clusters can be applied based on minimization values can be shown in fig 5.
Fig 5: Fuzzy C means clustering
Accuracy:
The accuracy of the algorithm can be calculated in terms of true positive, true negative, false positive, false negative values.
Accuracy --- (9)
Fig 6: Accuracy rate
The proposed Fuzzy C means algorithm provides highest accuracy than the K means clustering. Fuzzy C means algorithm is 90% accuracy and K means clustering is 72% accuracy.
RMSE:
Root Mean Square Error (RMSE) is the standard deviation of the residuals (prediction errors). Residuals are a measure of how far from the regression line data points are; RMSE is a measure of how spread out these residuals are. In other words, it tells you how concentrated the data is around the line of best fit. The equation of RMSE rate is shown as follows:
RMSE=√ ̅̅̅̅̅̅̅̅̅̅̅ ---- (10)
f = forecasts (expected values or unknown results),
o = observed values (known results).
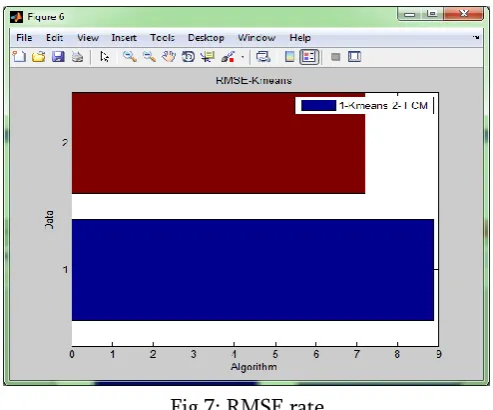
Fig 7: RMSE rate
Based on RMSE rate, K means algorithm provide highest error rate than the Fuzzy C means algorithm.
Time Complexity:
The speed of the algorithm can be measured in terms of time complexity. The time complexity result is shown in table 1.
Number of iteration
K-Means clustering
Fuzzy C
means clustering
50 0.5 0.2
100 0.8 0.3
150 0.9 0.4
200 1 0.5
250 1.3 0.6
300 1.5 0.7
350 2 0.8
400 2.9 0.9
450 3.2 0.98
500 3.4 1
Fig 8 : Time Complexity
From the above the graph, Time complexity of Fuzzy C means clustering algorithm is take 1 seconds to group the points than the existing K means algorithm.
Random_index:
The Rand indexor Rand measure (named after William M. Rand) in statistics, and in particular in data clustering, is a measure of the similarity between two data clustering’s. A form of the Rand index may be defined that is adjusted for the chance grouping of elements; this is the adjusted Rand index. The Random index result is shown in fig 9.
Fig 9: Random Index Comparison
From the Random index comparison results, Fuzzy C means algorithm is effective than the K means algorithm. From all results, Fuzzy C means proves efficiency than the K-means clustering.
V.
CONCLUSIONThis paper presents an overview of the K-means clustering algorithm and Fuzzy C means algorithm is implemented by modification of both the phases of original k-means algorithm. Results show that Fuzzy C means algorithm gives best results for all performance parameters than original k-means algorithm. We can implement different types of distance measure techniques are described. The main purpose of this paper to analyze the performance of measurements such as Accuracy, time, Rand_index and Error rate with K-Means and Fuzzy C means clustering. We find that Fuzzy C means can be produced better result in comparison with K means in terms of performance measures. It is proved that FCM outperform well than K-Means algorithm.
VI. REFERENCES
1. Berkhin, Pavel. "A survey of clustering data mining techniques." Grouping multidimensional data 25 (2006): 71.
2. Guo, Chonghui, and Li Peng. "A hybrid clustering algorithm based on dimensional reduction and k-harmonic means." Wireless Communications, Networking and Mobile
Computing, 2008.WiCOM'08.4th
International Conference on.IEEE, 2008. 3. Zhang, Bin, Meichun Hsu, and
UmeshwarDayal. "K-harmonic means-a data clustering algorithm." Hewlett-Packard Labs Technical Report HPL-1999-124(1999). 4. Zhang, Dao-Qiang, and Song-Can Chen.
5. Ng, Andrew Y., Michael I. Jordan, and Yair Weiss. "On spectral clustering: Analysis and an algorithm." Advances in neural information processing systems. 2002.
6. Sithara, E. P., and KA Abdul Nazeer. "ahybridkharmonic means with abcclustering algorithm using an optimal kvalue for high performance clustering."
7. EMAMI, Hojjat, Sina DAMI, and Hosseinshirazi. "k-harmonic means data clustering with imperialist competitive algorithm."
8. Thakare, Anuradha D., and Rohini S. Hanchate. "Introducing Hybrid model for Data Clustering using K-Harmonic Means and Gravitational Search Algorithms." International Journal of Computer Applications 88.17 (2014).
9. Bankapalli, Jyothi, R. VenuBabu, and S. Anjali Devi. "Combining k-harmonic mean and hierarchical algorithms for robust and efficient data clustering with cohesion selfmerging." International Journal on Computer Science and Engineering 3.6 (2011): 2544-2553.