An Evaluation Summary Method Based on a Combination of Content
and Linguistic Metrics
Samira Ellouze
University of Sfax ANLP Research Group, MIRACL Laboratory, Sfax,
Tunisia
ellouze.samira@gmail .com
Maher Jaoua
University of Sfax ANLP Research Group, MIRACL Laboratory, Sfax,
Tunisia
[email protected] u.tn
Lamia Hadrich Belguith
University of Sfax ANLP Research Group, MIRACL Laboratory, Sfax,
Tunisia
[email protected] u.tn
Abstract
This paper presents a new automated method for evaluating the content of a text summary. The proposed method is based on a combination of features encompassing scores of content and others of linguistic quality. This method relies on a learning technique called linear regression. The objective of this combination is to predict the PYRAMID score from the features used. In order to evaluate the presented method, we are interested in two levels of granularity evaluation: the first is named Micro-evaluation and proposes an Micro-evaluation of each summary while the second is called Macro-evaluation and it is applied at the level of each system. The resulting metric shows an improvement upon standard metrics by increasing the correlation with the PYRAMID metric.
1 Introduction
The evaluation of a summary is an important and necessary task. It quantifies the informativeness and linguistic quality of a summary and it can be of two types: extrinsic or intrinsic (Jing et al., 1998). Extrinsic evaluation measures the impact of using a summary in the place of the source document(s) on tasks such as document classification and indexing while intrinsic evaluation assesses the overall quality of the summary either manually or automatically. It should be noted that the manual evaluation is a difficult and expensive task because it requires a lot of time and expertise in the field of the source text topic. For this reason, several automatic
evaluation metrics have been developed such as ROUGE (Lin, 2004), BE (Hovy et al., 2006), BEwTE (Tratz and Hovy, 2008), AutoSummENG (Giannakopoulos et al., 2008), etc. The advent of automatic evaluation metrics generates in its turn a new step: meta-evaluation i.e. the evaluation of evaluation metrics. We perform this meta-evaluation by making a comparison between these metrics and manual metrics. To achieve this comparison, the TAC1 conference proposed various metrics of correlations (i.e. Pearson, Spearman, Kandall). Most of the evaluation metrics assessed by the TAC conference are based on the evaluation of the relevance of a summary content. However, a summary with relevant content may be unreadable. To encourage researchers to evaluate the readability of a summary, the TAC 2011 session added a new goal to the task of automatic evaluation of summaries consisting in evaluating the readability of summaries. In this context, we suggest in this paper an evaluation method based on the combination of several evaluation metrics (i.e. content metrics and linguistic quality metrics). This paper is organized as follows: in section 2, we give a brief historical overview on the evolution of the evaluation of intrinsic methods used in the field of automatic summarization; section 3 describes the proposed method, which operates by the linear combination of content and linguistic features. We define content and linguistic quality features in section 4. Finally, the final section presents the results of our experiments.
1
Text Analysis Conference http://www.nist.gov/tac
2 Overview of intrinsic metrics
Initial assessments in the field of automatic summarization are made by human judges. Judges evaluate a summary by answering questions about coherence, coverage, relevance, etc. This evaluation procedure is expensive because it requires significant human resources and a huge time. Besides, it is subjective since it varies from one assessor to another. In fact, it can vary for the same assessor at two separate times. Despite all these disadvantages the evaluation by human judges is used by several evaluation metrics. Prior to 2005, the DUC2 conference evaluated summaries using the Summary Evaluation Environment (SEE) interface (Lin, 2001). This interface helps assessors in the evaluation of the content and the linguistic quality of a candidate summary. In 2006, DUC added the Overall Responsiveness metric (Dang and Owczarzak, 2008) to evaluate a candidate summary. This metric is a combination of content and linguistic quality. It differs from other metrics of summary evaluation in that it doesn’t compare a candidate summary against a model summary. Since the 2005 DUC, the PYRAMID metric (Nenkova and Passonneau, 2004) has been added as an optional manual evaluation metric. This metric, which is based on the identification of minimal semantic units called SCUs (Summary Content Units), has become one of the principal manual metrics for evaluating summaries in the TAC conference.
Because of the difficulties encountered during the manual evaluation, more research has focused on automatic evaluation. ROUGE (Lin, 2004) is one of the first automatic metrics for the intrinsic evaluation of automatic summaries. This metric is based on the overlap of N-grams between a candidate summary and one or more reference summaries. (Hovy et al., 2006) introduced the BE metric, which allows the correspondence between syntactic units called BEs. A BE is composed of a head representing one element (noun, verb, etc.) or a dependency relationship between a head and its modifier. In a more recent work (Giannakopoulos et al., 2008) introduced the metric AutoSummENG allowing the representation of a candidate summary and a reference summary each as a graph of n-grams. Then, it makes a comparison between these two graphs. Other evaluation metrics which do not
2
Document Understanding Conference http://duc.nist.gov/
use reference summaries have also been proposed by (Louis and Nenkova, 2009) and (Torres-Moreno et al., 2010). These metrics are used to compare each candidate summary to source documents using the Jensen-Shannon divergence measure.
New metrics such as ROSE (Conroy and Dang, 2008) and Nouveau-ROUGE (Conroy et al., 2011) have involved a combination of ROUGE variants to predict PYRAMID or the Overall Responsiveness score. Other works have focused on metrics of linguistic quality evaluation. In this context, (Pilter et al., 2010) evaluated the five linguistic properties used in TAC by combining different types of features such as entity grid (Barzilay and Lapata, 2008), modeling language, etc. The most recent work, namely that of (Conroy et al, 2010), assessed content and linguistic quality using a combination of features. Concerning content features, (Conroy et al, 2010) use ROUGE scores for initial summaries and Nouveau-ROUGE scores for update summaries. In a later work (Conroy et al., 2011) and (Rankel et al., 2012) combined features of content (six variations of bigram scores) and others of linguistic quality. In contrast to Conroy, (Lin et al., 2012) combined a machine translation metric adapted to summary evaluation with a coherence metric based on an entity grid to predict the Overall Responsiveness metric.
3 Proposed method
Most single automatic metrics use one level of evaluation (i.e. lexical, syntactic or semantic) while the metric based on machine learning techniques can combine multiple levels of evaluation into one model. For this reason, we proposed a method based on a machine learning technique to predict the PYRAMID metric. We performed a linear combination of content metrics (i.e. ROUGE, BE and AutoSummENG) and linguistic metrics (i.e. part-of-speech features, traditional readability metrics features, shallow features). Thus, the equation used to estimate the PYRAMID score is written:
ݕො = ݓ+ ݓଵݔଵ+ ݓଶݔଶ+ ⋯ + ݓݔ
where ŷ is the predictive value, n is the number of features, x1… xn are the feature values and
We used a linear regression to find the linear combination that maximizes the correlation between the used features and PYRAMID. So the problem of linear regression is expressed as a set of features and their corresponding PYRAMID scores. Subsequently, we determined a vector X of length n+1 maximizing the correlation as:
ݓ = ܽݎ݃݉ܽݔ ߩ(ݓ+ ܽݓ
ୀଵ
, ܾ)
where ܽ is the value of the ݆௧ feature for System i (respectively for a summary i) at the macro-evaluation (respectively at the micro-evaluation) with i varying from 1 to m and j varying from 1 to n; ܾ is the PYRAMID score for system i (respectively summary i) at the macro-evaluation (respectively at the micro-evaluation); and ρ is the Pearson correlation.
We used the least squares method to minimize the sum of squared deviations between the PYRAMID score (ݕ) and the predicted PYRAMID score (ݕො). Then, the equation of minimization is:
݉݅݊ (ݕ− ݕො)ଶ
ୀଵ
4 Features
The features used by our method are chosen in such a way that their combination correlates the maximum with the PYRAMID score.
4.1 Content features
From the correlation results obtained in the 2008 TAC (Dang and Owczarzak, 2008), we noted that the standard metrics ROUGE-2 (R2), ROUGE-SU4 (R-SU4) and BE-HM3 (BE) and the candidate AutoSummENG metric have a high correlation with the PYRAMID metric. For this reason, we used principally these four metrics as features to evaluate the summary. We also added, on the one hand, ROUGE-3 (R3) and ROUGE-4 (R4) as they take into account large contexts that capture the linguistic characteristics of the summary such as some grammatical phenomena and, on the other hand, ROUGE-1
3
BE-HM uses only the head and the modifier.
(R1) because it provides a good indicator of the relevance of the contents of a given summary.
4.2 Linguistic features
PYRAMID is a manual method based on the extraction of SCUs representing minimal semantic units. A human judge cannot identify the SCUs in a summary that does not have a good linguistic quality. Therefore, a summary with a poor linguistic quality cannot have a good PYRAMID score. Thus, to ensure a better prediction of the PYRAMID score, it is interesting to include linguistic metrics in addition to content metrics. In the next subsection, we mention multiple linguistic features which influence the quality of the summary.
Traditional readability measure features
The readability analysis allows us to determine whether a text is easy to understand or not; in other words, it can indicate the complexity of the text. However, a candidate summary must be easy to understand as well as relevant. For this reason, we use traditional readability measures which are based on the number of sentences, words, characters, syllables and / or complex words in a summary. These measures are:
•The Gunning Fog Index (GFI) measure (Gunning, 1968): it indicates the readability of an English text. More precisely, it is an index for specifying the years of education needed to understand the text at first reading. This measure uses the average sentence length and the percentage of complex words (i.e. words with three or more syllables).
•The Flesch Reading Ease (FRE) measure (Flesch, 1951): it predicts the difficulty of reading documents for adults. This is specific to English texts and uses a score from 0 to 100. It is based on the average sentence length and the average number of syllables per word.
translates a score between 0 and 100 into an American grade level. It is based on the average sentence length and the average number of syllables per word.
•The Automated Readability Index (ARI) was designed by (Smith and Senter, 1967). Like the previously described measure of readability, the score approximates the grade level needed to understand the text. This measure uses the average number of characters per word and the average number of words per sentence.
Shallow features
Shallow features are limited to the surface structure of the text. Many of these features are used by traditional readability measures. In our work, we used four shallow features: the Average number of syllables per word (ASW), the average number of characters per word (ACW), the average number of words per sentence (AWS) and the number of sentences (NbPh) which was used by (Rankel et al., 2012) and which is equal to log (Number of sentences)).
Language modeling features
Several recent works have used the language model to assess some aspects of the linguistic quality. (Pilter et al., 2010) is one of those works. They trained three language models (uni-grams, bi-grams and tri-grams) over the New York Times corpus. In our work, we also trained three language models (unigram, bi-grams and trigrams) over the Open American National Corpus. We used the SRI language modeling toolkit (Stolcke, 2002) to calculate the log probability (log_prob) and two measures of perplexity.
Part-of-speech features
(Feng et al., 2010) show that the Part-of-speech features are helpful in the prediction of the linguistic quality. So, we calculated the density of a variety of function words and content words. The density of various categories of function words can tell us about the cohesion of a text. In fact, according to (Halliday and Hasan, 1976), the concept of cohesion includes phenomena which allow a link between sentences or phrases. They identified five types of cohesion: reference, substitution, ellipsis, conjunction and lexical
cohesion. For example, discourse connectives (e.g. “and”, “while”) are used to connect sentences. Since many functional words represent reference devices or discourse connectives, we decided to calculate the density of the four categories of function words: determinants (DET), conjunctions (CC), prepositions and subordinating conjunctions (PSC), and personal pronouns (PRP). In addition to the density of function words, we calculated the density of content words which is used in many works such as (To et al, 2013) and (Feng et al, 2010) to predict the readability of a text. So, we calculated the density of four categories of content words: adjectives (ADJ), nouns (N), verbs (V) and adverbs (ADV). The density of each of the above categories is the ratio between the number of words presenting one of the categories and the total number of words in the summary.
To detect function words and content words, we used the morphological tagger "Stanford Postagger4", which provides the grammatical category of words.
5 Evaluation
We used the corpus of the 2008 TAC conference to evaluate our metric. This corpus consists of 48 topics and 58 systems. For each topic, there are 20 documents sorted in chronological order. Each system produces an initial summary constructed using only the first 10 documents and an update summary built from the following 10 documents. An update summary describes the new events introduced by the last 10 documents compared to the events described in the first 10 documents. In total, each system produced 96 summaries (48 initial summaries (A) and 48 update summaries (B)).
The evaluation of the new metric is based on the study of its correlation with PYRAMID. In order to measure the correlation, we used Pearson’s rho, Spearman’s rho and Kendall’s tau which are employed by the TAC conference in meta-evaluation (evaluation of evaluation metrics). All correlation measures gave a value between -1 and 1. A value of 1 or -1 indicates a strength relationship between the two measures.
4 This labeler provides bidirectional inference.
The closer the value of the correlation to 0, the weaker the relation between the two measures is. We remind that Pearson’s rho uses the values that each metric (PYRAMID, predicted PYRAMID) takes while Spearman’s rho and Kendall’s tau use the ranks of values for each metric. We examined the predictive power of our features on two evaluation levels: the summary level (Micro-evaluation) and the system level (Macro-evaluation). In both levels, we performed a 10-fold cross validation on our training data.
5.1 Micro-evaluation
In this section, we investigate the predictive power of the features used in a micro-evaluation level. In other words, we make a summary level evaluation in which we take each summary score in a separate entry. We conducted an experiment for each assessment task (initial summary, update summary).
Features A B
R1 0.6708 0.8929 R2 0.9955 -0.1767 R3 -1.49 0.6069
R4 -0.6058
R-SU4 -0.2474 -0.6044 BE 0.2954 0.6605 AutoSummENG 1.6692 1.7244 NbPh 0.0175 0.0157 GFI -0.0162 -0.005 FKI 0.017 0.0017
FRE -0.0008
Density(DET) -0.3765 -0.1275 Density(PRP) 0.5527 log_prob 0.0002 Density(V) 0.1984 Density(N) 0.0761 0.1836 Density(ADV) -0.4586
ASW 0.043
ACW -0.0236
AWS -0.001
w0 -0.0902 -0.0737
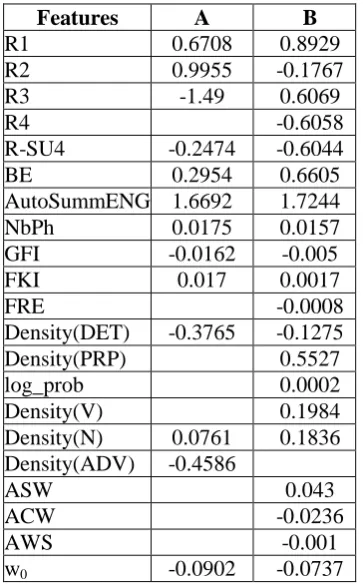
Table 1 : Features used in initial (A) and update (B) summary tasks at the Micro-Evaluation level
The weight of each feature is shown in table 1. As can be seen in Table 1, our experiment in both assessment tasks shows that AutoSummENG has the best weight. The lowest weights are obtained by the traditional
readability measure features, the shallow features and the language modeling features. Typically, the weights of content features are better than the weights of linguistic quality features. This is due to the nature of the PYRAMID metric, which measures the content of the summary.
To measure the effectiveness of our experiments in the micro-level, we calculated the correlation between our experiments and PYRAMID. Then, we compared this correlation with the correlation between PYRAMID and ROUGE-15, the standard metrics used by the TAC (ROUGE-2, ROUGE-SU4, BE). As seen in Table 2 and in the two tasks of evaluation, we found that the correlation of our experimentation with PYRAMID is not high enough, although it is greater than the correlation of PYRAMID with standard metrics or with ROUGE-1.
PearsonSpearman Kendall Initial summary
ROUGE-1 0.5452 0.5372 0.3764 ROUGE-2 0.4646 0.4855 0.3361 ROUGE-SU4 0.4942 0.5070 0.3531 BE 0.3796 0.4122 0.2831 Our experimentation 0.6048 0.5943 0.4224
Update summary
ROUGE-1 0.6060 0.6303 0.4484 ROUGE-2 0.5645 0.6033 0.4252 ROUGE-SU4 0.6013 0.6359 0.4505 BE 0.5391 0.5968 0.4213 Our experimentation 0.6628 0.6807 0.4911
Table 2: Correlation with PYRAMID in initial and update summaries evaluation tasks,
micro-evaluation level (p-value <2.2 e-16)
5.2 Macro-evaluation
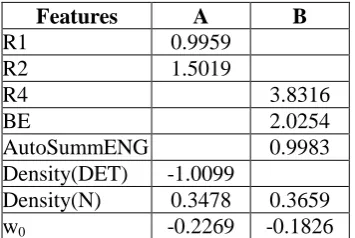
In this section, we make a macro-evaluation, that is to say, a system-level evaluation. In this type of evaluation, we measure the average quality of a summarizing system by computing the average score for a system over the entire set of produced summaries. For each evaluation task, we conducted an experiment. Table 3 gives an overview of the features used in each task as well as their weights.
As shown in table 3, ROUGE-2 has the best weight in the initial summary evaluation. Also,
5
ROUGE-1 and Density of determinants have good weights. In the update summary evaluation, ROUGE-4 has the best weight. The lowest weight is obtained by the density of noun. In the system level, some linguistic features have a good weight. Hence, the role of linguistic features is more important in the system level than in the summary level.
Features A B
R1 0.9959 R2 1.5019
R4 3.8316
BE 2.0254
AutoSummENG 0.9983 Density(DET) -1.0099
Density(N) 0.3478 0.3659 w0 -0.2269 -0.1826
Table 3: Features used in initial and updated summary tasks at the Macro-Evaluation level
Pearson Spearman Kendall Initial summary
ROUGE-1 0.8764 0.8655 0.7089 ROUGE-2 0.8981 0.9095 0.7611 ROUGE-SU4 0.8780 0.8859 0.7340 BE 0.9045 0.9022 0.7319 Our experimentation 0.9578 0.9576 0.8350
Update summary
ROUGE-1 0.8768 0.9149 0.7453 ROUGE-2 0.9366 0.9415 0.8000 ROUGE-SU4 0.9174 0.9310 0.7842 BE 0.9398 0.9376 0.7951 N-ROUGE-2 0.9525 0.9434 0.8085 N-ROUGE-SU4 0.9359 0.9339 0.7908 Our experimentation 0.9569 0.9616 0.8352
Table 4: Correlation with PYRAMID in the initial summary and update summary evaluation tasks, macro-evaluation level (p-value <2.2 e-16)
We measured the effectiveness of our experiments in the macro-level, as we did in the micro-level. Table 4 shows the correlation coefficients of the PYRAMID score with:
•standard metrics ( ROUGE-2, ROUGE-SU4 and BE) and ROUGE-1,
•the experiments described in Table 3 and
•the Nouveau-ROUGE-2 (N-ROUGE-2) and the Nouveau-ROUGE-SU4 (N-ROUGE-SU4) metrics which are performed by (Conroy et al., 2011) to evaluate update summaries only at the macro-evaluation level.
By examining Table 4, we see that our experiments give a good correlation with PYRAMID. We also note that our experiment is better than the standard metrics used by the TAC, ROUGE-1 and the two variants of Nouveau-ROUGE metric which were intended to evaluate update summaries.
6 Conclusion
In this article, we presented a method to evaluate the contents and the linguistic quality of a summary using a combination of linguistic and content features. The combination of these features is performed using a linear regression method.
In examining the results, we find that the correlation of our experiments with PYRAMID, at the micro-evaluation level, is not high enough; in spite of this, it is greater than standard metrics and ROUGE-1. However, our experiments give a good correlation with PYRAMID at the macro-evaluation level. In addition, we notice that the weights of the content features are higher than the weights of the linguistic quality features. This is due to the nature of the PYRAMID metric which measures the content of a summary. Also, in observing the weights of the linguistic features, we note that the weights of traditional readability measures, language modeling features and shallow features are very low.
As perspectives, we may use other linguistic features such as the grid of entity used by (Barzilay and Lapata, 2008) to measure the coherence of the summary. Also, we can add syntactic and semantic features to our model.
References
Barzilay R. and Lapata M. 2008. Modeling Local Coherence: An Entity-based Approach. Computational Linguistics Journal, Volume 34 No: 1, pages 1-34.
Conroy,J. M., Schlesinger,J. D. and O'LEARY,D. P. 2011. Nouveau-ROUGE: A Novelty Metric for Update Summarization. In Computational Linguistics journal, Volume 37 No: 1, pages 1-8.
Conroy J. M., SchlesingerJ. D., Rankel P. A., and O'Leary D. P. 2010. Guiding CLASSY toward More Responsive Summaries. In proceedings of the Text Analysis Conference.
Content from Linguistic Quality. In proceedings of COLING 2008, pages 145-152.
Dang H. T. and Owczarzak K. 2009. Overview of TAC 2009 summarization track. In proceedings of the Text Analysis Conference.
DangH. T. and OwczarzakK. 2008. Overview of the TAC 2008 Update Summarization Task. In proceedings of the Text Analysis Conference.
Feng L., Jansche M. and Huenerfauth M. 2010. A comparison of features for automatic readability assessment, In Proceedings of the 23rd International Conference on Computational Linguistics (COLING 2010), pages 276-284.
Flesch R. F. 1951. How to test readability. Harper & Brothers, New York.
Giannakopoulos G. and Karkaletsis V. 2010. Summarization system evaluation variations based on n-gram graphs. In the proceedings of TAC 2010 Workshop.
Giannakopoulos G., Karkaletsis V., Vouros G. A. and Stamatopoulos P. 2008. Summarization system evaluation revisited: N-gram graphs. TSLP journal, Vol: 5 No: 3.
Gunning R. 1968. The techniques of clear writing, (Rev. ed.). New York: McGraw-Hill.
HallidayM. A. K. and Hasan R. 1976. Cohesion in English. Longman (Londres).
HarnlyA.,NenkovaA.,PassonneauR.andRambow, O.2005. Automation of Summary Evaluation by the Pyramid Method. In proceedings of RANLP, pages 226-233.
Hovy E., Lin C., Zhou L. and Fukumoto J. 2006. Automated Summarization Evaluation with Basic Elements. In proceedings of the 5th Conference on Language Resources and Evaluation.
Kincaid J.P., Fishburne Jr. R.P., Rodgers R.L., and Chisson B.S. 1975. Derivation of new readability formulas for Navy enlisted personnel. Research Branch Report 8-75, U.S. Naval Air Station, Memphis.
Lin C. 2001. Summary Evaluation Environment. http://www.isi.edu/~cyl/SEE.
Lin C. 2004. ROUGE: a package for automatic evaluation of summaries. In proceedings of the ACL 2004 Workshop on Text Summarization Branches Out (WAS 2004), pages 74–81.
LinZ., Liu C., Ng H. T. and KanM. 2012. Combining Coherence Models and Machine Translation Evaluation Metrics for Summarization Evaluation. In proceedings of ACL (1), pages 1006-1014.
Lin Z., Ng H. T. and Kan M. 2011. Automatically Evaluating Text Coherence Using Discourse
Relations. In proceedings of ACL 2011, pages 997-1006.
Louis A. and Nenkova A. 2009. Automatically Evaluating Content Selection in Summarization without Human Models. In proceedings of EMNLP 2009, pages 306-314.
Nenkova A. and Passonneau R. 2004. Evaluating Content Selection in Summarization: The Pyramid Method. In proceedings of HLT-NAACL 2004, pages 145-152.
OwczarzakK. and DangH. T. 2011. Overview of the TAC 2011 summarization track: Guided task and AESOP task. In proceedings of the Text Analysis Conference.
Pitler E., Louis A. and Nenkova A. 2010. Automatic Evaluation of Linguistic Quality in Multi-Document Summarization. In proceedings of ACL 2010, pages 544-554.
Rankel P. A., Conroy J. M. and Schlesinger J. D. 2012. Better Metrics to Automatically Predict the Quality of a Text Summary. Algorithms journal, No: 4, pages 398-420.
Smith E. and Senter R. 1967. Automated readability index. AMRL-TR. Aerospace Medical Research Laboratories (6570th), page 1.
Stolcke A. 2002. SRILM – an extensible language modeling toolkit. In Proceedings of International Conference on Spoken Language Processing, vol 2, pages 901–904.
To, V., Fan, S. and Thomas, DP. 2013. Lexical density and Readability: A case study of English Textbooks. The International Journal of Language, Society and Culture, vol 37, No 7, pages 61-71.
Torres-Moreno J. M., Saggion H., da Cunha I., San-Juan E. and Velazquez-Morales P. 2010. Summary Evaluation With and Without References. Polibits ISSN1870-9044, pages 13-19.