Statistical Evaluation of Pronunciation Encoding
Iris Merkus, Florian Schiel
Bavarian Archive for Speech Signals, Ludwig-Maximilians-Universit¨at M¨unchen, Germany Schellingstr. 3, 80803 M¨unchen, Germany
[email protected], [email protected]
Abstract
In this study we investigate the idea to automatically evaluate newly created pronunciation encodings for being correct or containing a potential error. Using a cascaded triphone detector and phonotactical n-gram modeling with an optimal Bayesian threshold we classify unknown pronunciation transcripts into the classes ’probably faulty’ or ’probably correct’. Transcripts tagged ’probably faulty’ are forwarded to a manual inspection performed by an expert, while encodings tagged ’probably correct’ are passed without further inspection. An evaluation of the new method on the German PHONOLEX lexical resource shows that with a tolerable error margin of approximately 3% faulty transcriptions a major reduction in work effort during the production of a new lexical resource can be achieved.
Keywords:pronunciation dictionary, error detection, phonotactical model
1.
Introduction
Applications of automatic speech recognition and auto-matic speech synthesis (among others) require some form of encoding to represent canonical or likely pronunciations of words. In the simplest and most common form, the pro-nunciation of words is encoded by a linear string of pho-netic symbols drawn from a standardized phoneme set for the particular language (e.g. IPA (International Phonetic Association, 1999), SAM-PA (Wells, 1997)). Other more sophisticated encodings feature multiple possible pronun-ciations or a finite state automaton per word form to cover dialectal and speaker-individual variability. In most cases these so called technical pronunciation dictionaries con-tain full word forms, where each lemma of the language is coded into a variety of derived word forms separately. Also, for pragmatic reasons technical pronunciation dictionaries often contain additional words of foreign languages (nowa-days mostly adopted English terms) and proper names like person names, street names, city names etc. (Jurafski and Martin, 2009). Many technical and scientific projects re-quire the production of a tailored technical pronunciation dictionary. Also, most speech corpora feature such a dictio-nary as part of the corpus to cover all words in the recorded data. Insofar the task of creating such a dictionary is a fre-quently encountered and common task in language technol-ogy and science.
Since most languages do not have a one-to-one mapping between lexemes and phonemes, this task cannot be au-tomated satisfactorily. During the last two decades many so called text-to-phoneme (TTP) systems have been devel-oped for a large number of common world languages (see for instance the ECESS project for European languages1) and evaluated in benchmarks against manually corrected pronunciation encodings by Phoneticians. Unfortunately almost no TTP systems are freely available (with some ex-ceptions). Rule based and stochastic approaches have been studied and applied mainly within systems for automatic
1European Center of Excellence in SpeechSynthesis,
www.ecess.eu/
speech synthesis. Depending on the language, on the do-main (task) and on the quality of the approach error rates between 5 and 20% are typical (e.g. (Reichel and Schiel, 2005)). To obtain better error margins pronunciation dic-tionaries have to be corrected by experts manually, at best in form of a multiple-pass annotation with some quality as-sessment schema (e.g. majority vote) and the possibility to assess the quality of the resulting dictionary by calculat-ing the inter-labeler agreement (e.g. Cohen’s kappa (Cohen, 1960)). Consequently the production of a large dictionary requires considerable time and resources, which are often not available.
To our knowledge there exists no literature dedicated to assist the process of encoding pronunciation by automatic means. There exists recommendations for the formal de-scription of lexical information2, language specific guide-lines for the proper and consistent use of a phonetic symbol inventory3, and there are several project-internal guidelines and reports on how to deal with the manual encoding pro-cess (e.g. TC-STAR, Verbmobil) but no serious attempts to speed up the encoding process.
At the Bavarian Archive of Speech Signals (BAS)4 every speech corpus is required to contain a technical pronunci-ation dictionary; speech corpora lacking this resource are not considered for distribution, since the pronunciation dic-tionary is a major factor to pass the BAS internal validation protocol5. Although the majority of word forms in a newly created dictionary can be recycled from other, already cor-rected dictionaries (e.g. the PHONOLEX6core list for Ger-man), there remain about 30-40% (depending on the do-main of the speech corpus) of previously ’un-seen’ word
2
e.g. the Text Encoding Initiative, P5 Guide Lines, Chapter 9; www.tei-c.org/release/doc/tei-p5-doc/en/html/DI.html
3
e.g. for German the BAS ’Transcription Conventions for Canonical German’ by Sonja Biersack; www.bas.uni-muenchen.de/Bas/BasGermanPronunciation/
4
www.bas.uni-muenchen.de/Bas
5see www.phonetik.uni-muenchen.de/forschung/BITS/
Reva-lidierungen.html for examples of BAS revalidations
6
these in a leave-one-out schema for testing and develop-ment.
Figure 1 illustrates the partitioning of the used pronuncia-tion lists.
Figure 1: The partitioning of the two PHONOLEX pronun-ciation lists PhonList and CoreList into two training sets PhonTrain (list with errors) and CoreTrain (correct), and the 4 paired evaluations lists EvalList1-4 used for develop-ment and testing (see text for details).
2.3. Detection by Discriminant Model Comparison
By using standard counting techniques we train two dif-ferent tri-gram models Mc and Mf on the training sets CoreTrain (correct transcriptions) and PhonTrain ( poten-tially faulty transcriptions) respectively. To evaluate an un-known encodingAW of a wordW with regard to potential transcription errors we then calculate the difference of the probability estimates on both models:
D(AW) =L(AW, Mf)−L(AW, Mc)
IfAW contains a phonotactically faulty encoding,D(AW) should tend to positive values, because modelMf should yield a higher probability estimate thanMc. If on the other handAW contains a correct encoding, we expectD(AW) to tend to negative values. SinceLis logarithmic, the dif-ference D is technically a normalization of probabilities; this normalization is necessary because the tri-gram prob-abilities in general (i.e. independent of possible encoding errors) are heavily dependent on the encodingA.
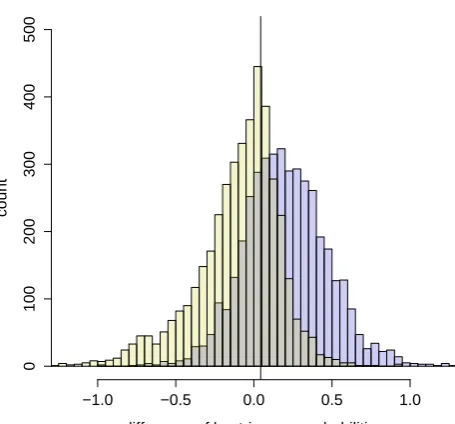
To test the feasibility of this concept we first calculated the
D values for the total 4 EvalLists (10.797 words) where both, the correct encoding as well as a realistic faulty en-coding, are known. Figure 2 shows the histograms ofDfor the correct (yellow) and faulty (blue) encoding. Both distri-butions overlap, but there is a tendency that the probability differences D of correct encodings concentrate on lower values than those of their faulty counterparts. A simple t-test shows that the distributions ofDactually differs signif-icantly between correct and faulty encoding (p <0.0001). Theoretically the optimal boundary between the two cases should be Db = 0 but since the modelsMc andMf are trained to limited and unbalanced data sets, we have to cal-culate the optimal decision threshold from a development set using the Bayes criterion7. We estimate a Gaussian dis-tribution on both histograms yielding two meansm1, m2
and two standard deviationsσ1, σ2.
7
= identity of the (uni-modal) probability density functions
difference of log tri−gram probabilities
count
−1.0 −0.5 0.0 0.5 1.0
0
100
200
300
400
500
Figure 2: Histograms of tri-gram probability differences on EvalList1-4 for correct (yellow) and faulty (blue) encod-ings. The vertical black line denotes the optimal Bayes de-cision boundary based on the total evaluation set.
Then we analytically solve the equality of these Gaussian functions using the formula:8
Db1,2 = 1 σ2
1−σ22
m2σ12−m1σ22±
± σ1σ2 r
(m1−m2)2+ 2(σ22−σ12) log σ2 σ1
whereDb1,2 are the points in the distribution where both
Gaussians intersect. Finally we select theDb which is po-sitioned between the two meansm1, m2.
In our case the empirical optimal Bayes boundaryDb =
0.04(with regard to the total evaluation set EvalList1-4).
3.
Application to Pronunciation Encoding
When producing a new pronunciation dictionary for a re-source we recommend the following steps (see process flow diagram in Figure 3):1. For the language in question prepare a database and estimate tri-gram modelsMcandMfand the optimal Bayes thresholdDbas described in Section 2..
2. Starting with the list of orthographic entries for which a pronunciation coding is needed (orth. input), first fil-ter out orthographic keys for which a reliable source already provides a matching pronunciation coding and
8Please note that this formula is only valid for distributions
based on the same number of samples. For non-balanced data sets the sample countsN1, N2of the histograms have to be taken into account in thelog term:logσ2N1
pass them to the output un-inspected.
E.g. for German we recommend to use the Core part of PHONOLEX.
3. For the remaining orthographic entries run a Text-to-Phoneme algorithm to calculate a first version of tran-scripts.
E.g. for German we recommend the BALLOON tool9 (Reichel and Schiel, 2005).
4. Inspect the trigrams of each newly created transcrip-tionA: if at least one trigram ofAhas never been ob-served in your training sets, flag the the transcription for manual inspection.
5. Test each of the remaining transcriptions A by cal-culating D(A) and compare this value to the opti-mal threshold Db. If D(A) > Db, flag Afor man-ual inspection. Otherwise, passA to the output un-inspected.
Figure 3: Process flow for the efficient creation of a new pronunciation dictionary.
4.
Evaluation
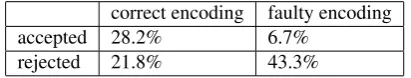
To evaluate the automatic flagging of uncertain pronunci-ation encodings we simulate only the process steps 4-5 of the previous section. We use the 4 paired evaluation lists EvalList1-4 as described in Section 2.2. in a leave-one-out schema where 3 of the EvalLists are used to calculate the optimal thresholdDb(development set) and the remaining EvalList is used as the test set, i.e. the output of the (fic-titious) TTP algorithm. Since the EvalLists are balanced, this means the assumed TTP produces exactly 50% pronun-ciation encoding errors. Correct/false acceptance/rejection rates are then averaged over the 4 tests. Table 1 shows the results. Columns add up to 50% each, since the test
correct encoding faulty encoding
accepted 28.2% 6.7%
rejected 21.8% 43.3%
Table 1: Acceptance/rejection rates from the German eval-uation on PHONOLEX.
9A webservice WebBALLOON will be made available within
the CLARIN-D project for public use.
sets were balanced for correct and faulty encodings. In to-tal 65.1% of encodings are flagged for manual inspection, 43.3% of these are truly faulty, while the remaining 21.8% are in fact correct. Precision10 is 80.8% which is encour-aging. On the other hand recall11is with 56.4% rather low, but this only means that 21.8% of the encodings have to be checked manually, while actually being correct. The worst case, a faulty encoding being passed unchecked (false pos-itive), is with 6.7% rather low. On the other hand the actual reduction in effort (proportion of transcriptions not flagged for manual inspection) is 34.9%12.
In the evaluation we used a balanced set to achieve reliable estimates for true negative and false negative rates (lower line in Table 1). That means that our (fictitious) TTP algo-rithm produced 50% errors when calculating the new tran-scriptions. But for a real application we expect the error rate of the TTP algorithm to be much lower (somewhere in the range of 5-20%). Since our test sets were taken from a real application, we expect that the rate distribution for faulty encodings (right column) shown in Table 1 will hold for an un-balanced data set as well. Insofar the proportion 6.7% of faulty encodings in the output in our evaluation is too pessimistic. If we estimate the error rate of the TTP algorithm to be 20%, we expect only 3.1% of truly faulty encodings in the output.
We also looked more closely at the two error groups in Ta-ble 1:
• Correct encodings being rejected:
About half of encodings in this group that were flagged because one or more triphones were unknown (step 4 in the process of Section 3.) are proper names or words of non-German origin, e.g. ’Utrecht, Bon-bon, Croissant’.
Words which were flagged because of the tri-gram models seem to have more than average syllable num-bers, often in compound words, e.g. ’atmosph¨arischen, Asylfrage, Predigtverbot, Tschechoslowakei’.
• Faulty encodings being accepted: This group consists of
– words with a wrong but phonotactically plau-sible encoding, e.g. ’wom¨ogliche’ encoded as /vo:m2:klIC@/ instead of /vOm2:klIC@/,
– words of non-German origin that carry a ’Germanized’ pronunciation encoding, such as ’Siena’encoded as /zi:na/ instead of /zie:na/ oder ’Lunch’ encoded as /lUnC/ instead of /lanS/,
– some proper names, and
– some very few words that seem not to be Ger-man words but rather parts of words as occur fre-quently in conversational speech, e.g. ’egen, Tu, hare, ¨of’.
10
precision = true positive / (true positive + false positive)
11
recall = true positive / (true positive + false negative)
12
5.
Conclusion
We studied the possibility to automatically flag newly cated pronunciation encodings for manual inspection to re-duce time and effort within the production of high-quality technical pronunciation dictionaries. Using normalized tri-gram model probabilities and a Bayes-optimized decision criterion we were able to achieve a precision of 80.8% on our test sets. 34.9% less entries were passed to the manual inspection (reduction in effort). Acceptance of unchecked but nevertheless faulty encodings was only 6.7% (false pos-itives) on a balanced test set. For un-balanced test sets as expected in a real application of the method the proportion of false positives will be even lower and – where neces-sary – can be further decreased by skewing the decision threshold to values below the Bayes optimum. We conclude that the proposed method will reduce the overall effort and might be worth applying in future pronunciation dictionary productions.
6.
Acknowledgments
This study was partly funded by the Bavarian Archive of Speech Signals (BAS). The authors thank Uwe Reichel of the CLARIN-D consortium for his valuable advice and fruitful discussions.
7.
References
J. Cohen. 1960. A coefficient of agreement for nominal scales. Educational and Psychological Measurement, 20(1):37–46.
The International Phonetic Association. 1999. The Hand-book of the International Phonetic Association. Cam-bridge University Press:CamCam-bridge, UK.
D. Jurafsky, J.H. Martin. 2009. Speech and Language Pro-cessing. Upper Saddle River, New Jersey, USA:Prentice Hall, 2nd edition, chapter 7.
M. Libossek, F. Schiel. 2000. In:Proc. of the International Conference on Spoken Language Processing, pages 283– 286.
U.D. Reichel, F. Schiel. 2005. Using Morphology and Phoneme History to improve Grapheme-to-Phoneme Conversion. In: Proceedings of the Interspeech 2005, pages 1937-1940, Lisbon, Portugal:ESCA.
F. Schiel, Chr. Draxler, Ph. Hoole, H.G. Tillmann. 1999. New Resources at BAS: Acoustic, Multimodal, Linguis-tic. In: Proceedings of the Eurospeech, pages 2271– 2274, ESCA:Budapest, Hungary.