Crystal
Reports
®
10
FOR
by Allen G. Taylor
Crystal
Reports
®
10
FOR
About the Author
Dedication
Author’s Acknowledgments
Many people have contributed to the quality and content of this book. I would particularly like to recognize Jaylene Crick of Business Objects for her help-fulness, my acquisitions editor, Terri Varveris, for her overall management of the project, and my editor, Nicole Sholly, for keeping me honest.
Contents at a Glance
Introduction ...1
Part I: Reporting Basics ...7
Chapter 1: Transforming Raw Data into Usable Information...9
Chapter 2: Create a Simple Report Right Now! ...17
Chapter 3: Report Design Guidelines...33
Chapter 4: Reporting Overview ...43
Part II: Moving Up to Professional Quality Reports ...55
Chapter 5: Pulling Specific Data from a Database ...57
Chapter 6: Sorting, Grouping, and Totaling Result Sets ...73
Chapter 7: Mastering Report Sections...93
Chapter 8: Formatting Your Reports...111
Part III: Advanced Report Types and Features ...131
Chapter 9: Displaying Your Favorite Hit Parade with Group Sort ...133
Chapter 10: Making Correlations with Cross-Tab Reports...149
Chapter 11: Adding Formulas to Reports...161
Chapter 12: Creating Reports within a Report ...181
Chapter 13: Combining Report Elements with OLE ...195
Chapter 14: Creating and Updating OLAP Reports ...201
Chapter 15: Enhancing Reports with Charts ...211
Chapter 16: Adding Geographic Detail with Maps ...235
Part IV: Crystal Reports in the Enterprise ...245
Chapter 17: Crystal Enterprise Components ...247
Chapter 18: Crystal Repository ...269
Chapter 19: Maintaining Security ...279
Chapter 20: Navigating with Report Parts...285
Chapter 21: Crystal Analysis 10...295
Part V: Publishing Your Reports...305
Chapter 22: Distributing and Viewing Reports ...307
Chapter 23: Displaying Reports Online ...311
Part VI: The Part of Tens ...325
Chapter 25: Ten Things to Do Before You Create a Report...327
Chapter 26: Ten Ways to Give Your Reports More Pizzaz ...331
Table of Contents
Introduction...1
About This Book...1
Conventions Used in This Book ...2
What You’re Not to Read ...2
Foolish Assumptions ...2
How This Book Is Organized...3
Part I: Reporting Basics ...3
Part II: Moving Up to Professional Quality Reports ...3
Part III: Advanced Report Types and Features ...3
Part IV: Crystal Reports in the Enterprise ...4
Part V: Publishing Your Reports...4
Part VI: The Part of Tens ...4
About the Web Site...5
Icons Used in This Book...5
Where to Go from Here...5
Part I: Reporting Basics...7
Chapter 1: Transforming Raw Data into Usable Information . . . .9
Major Features of Crystal Reports 10...10
Formatting a report...10
Enhancing a report with formulas and custom functions...11
Getting visual with charts and maps ...11
Displaying a report...11
Distributing a report ...12
Supplying Crystal Reports with data ...12
The Four Editions of Crystal Reports 10...12
The Standard Edition ...13
The Professional Edition ...13
The Developer Edition ...13
The Advanced Edition ...14
Viewing a Report ...14
Reading a printed report ...14
Viewing a report with Crystal Reports ...14
Part II: Moving Up to Professional Quality Reports ...55
Chapter 5: Pulling Specific Data from a Database . . . .57
Get Data Quickly with Select Expert...57
Using Formulas to Retrieve Data...63
Using Parameter Fields to Retrieve Data at Runtime ...65
Troubleshooting Tips ...71
Chapter 6: Sorting, Grouping, and Totaling Result Sets . . . .73
Sorting Report Data ...73
Sorting based on multiple fields...75
Sorting and performance...78
Grouping Related Items...79
Calculating Percentages ...82
Drilling Down for Detail ...84
Keeping Track of Things with Running Totals...86
Troubleshooting Sorting, Grouping, and Totaling Problems...90
Sorting problems and how to solve them ...90
Unusual grouping options ...91
Getting the right totals ...92
Chapter 7: Mastering Report Sections . . . .93
Changing the Size of a Section...93
Vertical spacing between lines ...93
The Section Formatting menu ...96
Common tab of Section Expert...98
Color tab of Section Expert ...100
Placing Groups Where You Want Them...103
Starting each group at the top of its own page ...103
Printing totals at the bottom of a page...104
Restarting page numbering at the beginning of each group...105
Hiding Details with Summary and Drill-Down Reports ...105
Creating Mailing Labels ...106
Saving Money on Postage by Doing a Zip Sort ...109
Chapter 8: Formatting Your Reports . . . .111
Absolute Formatting and Conditional Formatting ...111
Absolute formatting overview ...112
Conditional formatting ...116
Introduction
C
rystal Reports 10 is the latest in a long and celebrated series of report writers for personal computers. Crystal Reports is by far the best-selling report writer package in the world, even though you may have never heard of it. In the past, it has been bundled with many of the most popular applica-tions without being acknowledged by name. (A version of Crystal Reports is currently bundled into Microsoft’s Visual Studio .NET, and Crystal Reports 10 is sold as a standalone product.) If you want to produce a high-quality report quickly, Crystal Reports is the top choice to do the job.About This Book
Crystal Reports 10 For Dummiesis an introductory level book that gets you using Crystal Reports quickly and effectively. It covers all the major capabilities of Crystal Reports but doesn’t bog you down in intricate detail. The objective is to give you the information you need to produce the types of reports that most people need most of the time. I also get into some out-of-the-ordinary report types that you might be called upon to generate on occasion.
Use this book as a handy reference guide. Each chapter deals with an individ-ual feature that you may need at one time or another. Pull out the book, read the chapter, and then do what you need to do. In many cases, step-by-step procedures walk you through commonly needed operations. You might find it worthwhile to put the book beside your computer and perform the opera-tions as you read about them.
Conventions Used in This Book
When an instruction in the book says, for instance, File➪Save, it means to click the left mouse button on File in the main menu, and then click Save on the submenu that drops down from it.
Anything you see that is printed in a monospaced font is code, or something you’ll run across in the course of programming a database (field names, for example). This is a monospaced font.Crystal Reports executes code that you enter as formulas or SQL statements.
What You’re Not to Read
You can read the book through from cover to cover, working through the examples, although you don’t have to. Whether you read it all the way through or not, you can use it as a quick reference when you want to perform a partic-ular operation that you have not used in a while.
There’s another whole section of this introduction that explains the icons you’ll normally run across, and there is a good reason for paying attention to each of them. There is, however, one icon that you get to skip: Consider yourself exempted from the requirement to read anything that appears by a Technical Stuff icon.
Material next to one of these icons may be interesting to techies like me (there must be some of you out there) but generally is not necessary for a full under-standing of how to use Crystal Reports.
Foolish Assumptions
I’ve never met you, but because we’re going to be together for a while, I’ll make a few assumptions about you and what you know. I assume that you know how to use a personal computer and that you’re somewhat familiar with Microsoft Word. If you know how to navigate around Microsoft Word, you already know almost all there is to know about navigating around Crystal Reports. The user interfaces of the two products are similar.
sign to expand that node, to see what the node contains. Crystal Reports treats directory trees in a similar way.
I assume you know how to perform a drag-and-drop operation with your mouse. In Crystal Reports, when you click an object and start dragging it, your progress is shown by a rectangular placement frame. When you release the mouse button to drop the item, the placement frame is replaced by a duplicate of the item that you dragged.
How This Book Is Organized
This book contains six major parts. Each part contains several chapters.
Part I: Reporting Basics
Part I introduces you to Crystal Reports and the art of report creation. You find out what a report should accomplish and what it should look like. Then you fire up Crystal Reports and use it to create a simple report based on data held in a database.
Part II: Moving Up to Professional
Quality Reports
You can do many things beyond the basics to make reports more focused, more readable, and easier on the eye. This part gives you the information you need to do all those things.
Part III: Advanced Report
Types and Features
Part IV: Crystal Reports in the Enterprise
Crystal Enterprise is a companion product to Crystal Reports that controls and secures the distribution of reports. With it you can make your reports accessible to people on your local area network, or on the World Wide Web. Crystal Enterprise’s new Business Views capability enables report developers to custom tailor a report based on the interests of the people who will be viewing it. There can be multiple different Business Views of a single report. Crystal Enterprise is also the home of the Crystal Repository, which is a great place to store formulas, custom functions, or Business Views, so they can be used again later.Part V: Publishing Your Reports
After you create a report, you’ll want to make it available to the people who need it. Crystal Reports makes it easy for you to distribute your report for viewing, whether to colleagues in your organization or to Internet users around the world. In addition, you can publish your reports using traditional meth-ods. You can print it; export it to a file, or fax it to people far away. After you complete report development, distribution is easy.
Although Crystal Reports does a great job when used all by itself, you can also incorporate it into applications written in a computer language. Crystal Reports’ SQL Commands facility gives you direct control over the data in a report’s underlying database. Because a version of Crystal Reports is included as an integral part of Microsoft’s .NET application development environment, you can incorporate the power of Crystal Reports into applications you write in Visual Basic, Visual C++, Visual C#, or any language compatible with the .NET framework. This gives the applications you write the sophistication of the world’s leading report writer.
Part VI: The Part of Tens
About the Web Site
This book has an accompanying Web site where you can find sample reports from the book, some exercises related to the sample reports, and links to sites for related information. To access the Web site, go to www.dummies.com/go/ crystalfd.
Icons Used in This Book
Tips save you a lot of time and keep you out of trouble.
Pay attention to the information marked by this icon — you may need it later.
As mentioned earlier, Technical Stuff is detail that I find interesting and you may also. But if you don’t, no big deal. It is not essential to gain an under-standing of the topic being discussed. Skip it if you like.
Heeding the advice that this icon points to can save you from major grief. Ignore it at your peril.
Where to Go from Here
Part I
In this part . . .
T
here’s data in the database, where it’s not doing anyone any good. Your manager wants coherent infor-mation, based on that data, on her desk by the close of business today. What should you do? Panic? Consider joining the Foreign Legion?Chapter 1
Transforming Raw Data
into Usable Information
In This Chapter
Outlining the major features of Crystal Reports 10
Discussing the four editions
Viewing an existing report
C
omputers can store and process enormous amounts of data, and with the relentless advance of technology, those capabilities will soon become even more mind-boggling. Even now, the major challenge of getting value from computer systems is not to make them more powerful but to harness the power they already have — in a way that delivers useful information to people.Megabytes or gigabytes of raw data are neither meaningful nor useful to people. Instead, we need organized information, distilled and focused on answering specific questions. In businesses and enterprises of all kinds, orga-nizing and presenting information has traditionally been the job of documents called reports.These documents generally consist of multiple pages that can include text, numbers, charts, maps, and illustrations. The best reports convey the facts needed to make the best decisions, unobscured by a clutter of data irrelevant to the task at hand.
Format Painter is a new feature of Crystal Reports 10. It saves you a lot of work if you have numerous objects in a report that all require the same for-matting. You simply format the first of those objects and then — with one click — “clone” that formatting onto another object.
Another labor-saving feature is the Template Expert, which enables you to create and save a report template for later use. Imagine how much time you’ll save if you have to quickly format multiple reports with a common look.
Enhancing a report with formulas
and custom functions
Did I mention that conditional formatting makes use of formulas to change the format of a report? Well, you can use formulas for far more than that. A formula is like a little computer program that can do computations or other manipulations of data before displaying the result. This makes Crystal Reports more than merely a report writer that puts your data in a nice format. By using formulas, you can make it select specific records (or groups of records) and display them the way you want, controlling that process by declaring and using variables in your formulas. All the common flow-control structures (If-Then-Else, Select Case, For, While Do, and Do While) are available.
After you create a useful formula that you might want to use again later, you can save it as a custom function. Custom functions are added to the standard functions that come with Crystal Reports, keeping them available in one place.
Getting visual with charts and maps
Crystal Reports has excellent capabilities for the graphical display of data. All the most commonly used chart types are available, so you can display your data in the most meaningful way. If you have geographical data, Crystal Reports can display it in maps that show countries, regions, provinces, or cities. A variety of methods are available to associate values with specific regions, including colors, symbols of various sorts, and even charts.
Displaying a report
old-fashioned way, printing them on paper and putting them on the target readers’ desks.
Distributing a report
You can get your report into the hands of its intended recipients in many ways — print it and deliver it by hand, fax it directly from your computer to a fax machine anywhere in the world, or export the report to a file.
If you choose the latter approach, Crystal Reports supports many output file formats, including HTML for viewing over the Web. At least one of these for-mats is bound to be readable by the people in your audience. The one caveat here is that if you export a report to any format other than the Crystal Reports native format (.rpt), you may lose some of the report’s formatting in the process. You can even export directly to an application such as Microsoft Word or Lotus Domino. In such a case, Crystal Reports launches the target application and opens your report in it.
A major new distribution mechanism in Crystal 10 is the Business Views fea-ture (actually a component of Crystal Enterprise, a companion product to Crystal Reports that enables users on client machines to view, schedule, and keep track of published reports). As discussed in Chapter 17, Business Views offer a new data-abstraction layer that simplifies the process of connecting to enterprise data sources. At that layer, you can combine data from multiple data sources of different kinds into a single data source.
Supplying Crystal Reports with data
As important as the output formats of a report are, the inputs to the report are equally important. Crystal Reports shines in this area too. It accepts data from a wide variety of data sources, including both personal computer databases such as Microsoft Access and enterprise-wide client/server databases such as Oracle, IBM’s DB2, and Microsoft’s SQL Server. In fact, Crystal Reports can accept data from any ODBC-compliant database or any data source that complies with Microsoft’s OLE DB standard. Essentially, if your data exists in a commonly used modern data source, Crystal Reports can use it.
The Four Editions of Crystal Reports 10
Crystal Reports 10 comes in four editions that differ in their target audiences and their capabilities. The four editions are the Standard Edition, theThe Standard Edition
The Standard Edition of Crystal Reports 10 is the least capable of the four, but that is not to say that it is deficient in any way. It is designed to be used by business professionals rather than information technology professionals. The Standard Edition contains nearly all the functionality I cover in this book. Rather than try to enumerate the features it contains, I’ll save a lot of space by listing the few things it doesn’t do:
It won’t create reports designed to be displayed on the Web. If you intend to develop reports for display on the Web, you need at least the Professional Edition.
It won’t integrate reports into application programs. Because the target audience for the Standard Edition consists of people who are not typically programmers, application integration tools would be more confusing than useful.
It won’t support XML or OLAP (discussed in Chapter 14), and it doesn’t include the Repository (covered in Chapter 18).
It doesn’t include native drivers for client/server databases such as Oracle, DB2, Hyperion Essbase, and SQL Server. If you want to draw data from those databases, use ODBC or move up to the Professional Edition.
The Professional Edition
The Professional Edition is aimed at IT and MIS professionals, such as database administrators, report designers, and systems analysts. It’s the product you need to publish reports on the Web. It also gives you more flexibility in using SQL than the Standard Edition does. The Professional Edition also allows you to draw data from client/server databases. The Repository is available in the Professional Edition and above.
The Developer Edition
The Developer Edition is for guru-class, heavy-duty application developers. It is designed to be used by programmers who want to incorporate reports in the applications they develop.
The Advanced Edition
The Advanced Edition is targeted at people who want to develop Enterprise Web applications using Java, COM, or .NET. It has essentially the same func-tionality as the Developer Edition, but it also has a license structure that accommodates more simultaneous users. People who receive Crystal Reports .NET as a part of Visual Studio .NET may want to upgrade to the Advanced Edition of Crystal Reports 10 when they’re ready to deploy their applications on the Web.
Viewing a Report
The majority of this book tells you how to create a new report from data in a database file, using Crystal Reports. It also tells you how to modify a report so you can create a new report (similar to, but distinct from, the existing one). These are concerns of the report designer. But what if you just want to viewa report that has already been designed?
The world has many more people viewing reports than creating such reports. You may be one of the former. No problem. Before I launch into telling you how to create reports in subsequent chapters of this book, I briefly describe the simple process of viewing reports that already exist.
Reading a printed report
Reading a report that you had Crystal Reports print on paper is the simplest (but also the most limited) way to get the information you want. It doesn’t take a lot of technical sophistication to read text and view charts and maps on a sheet of paper. People were doing so long before computers came along.
For some kinds of information, however, printed reports are not as valuable as those you can view online. Printed reports are not updated when the data-base from which they were derived is updated. They may contain obsolete — thus misleading — information. This is a factor you must always bear in mind when basing decisions on printed reports.
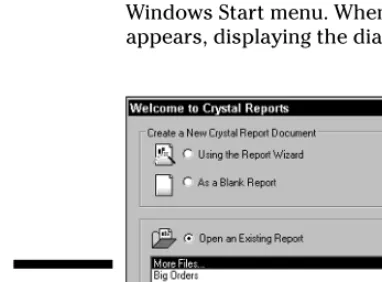
2. Select the report that you want to view and click OK.
If you don’t see the report you want, click More Files, click OK, and use the Open dialog box to select any report available on the system.
Crystal Reports retrieves and displays the report, as shown in Figure 1-2.
3. Move through the report.
Scroll around the report, and move back and forth among its pages. You can drill down into any summary report that supports drilldown. If the report contains hyperlinks, you can follow them to other locations in the report or in other reports
4. When you are finished viewing the report, choose File➪Close to close it.
Viewing a report on your local
area network or the Web
The Crystal Enterprise Web Desktop can display your reports to thousands of users on your local area network, or millions of users on the World Wide Web. Whether your users are on a local area network that’s directly con-nected to a server running the administrative part of Crystal Enterprise, or on a remote connection via the Web, they can use the Crystal Enterprise Web Desktop to access the reports they need. The user interface is a standard Web browser, such as Internet Explorer or Netscape.
Figure 1-2:
Chapter 2
Create a Simple Report
Right Now!
In This Chapter
Starting the programCreating your first report
Troubleshooting your report
Printing your report
W
hen you start Crystal Reports, generally you want to do one of three things: create a report, modify a report, or run a report against the data in your database. Reports take data from a database, process it, format it, and then output it to a printer, computer screen, or Web site.Crystal Reports comes with a sample database you can use for practice. It’s a Microsoft Access database for a fictitious company named Xtreme Mountain Bikes Inc. You might be able to buy one of their fictitious bikes with fictitious money, if you ever find a fictitious bike shop — and the Treasury Department doesn’t nab you first.
The xtreme.mdbdatabase contains a number of database tables that are rep-resentative of the tables a real bike manufacturer might maintain. The tables are filled with sample data that you can manipulate and display with Crystal Reports. You can use this sample data as the basis for your first report.
To create a report, you need to know a few things:
Which tables in the database contain the data you want
Which data items you want in those tables
What manipulations of the data must be performed to give you the infor-mation you want
How you want your report to be formatted
For the purposes of this introduction (and for now), imagine you already know all those things.
Starting Crystal Reports 10
You’ve probably chosen Crystal Reports because you have a database that contains information that’s important to you. In all likelihood, the data in that database changes with time, and you want to be able to keep up with its current status. You couldretrieve the information you want by making SQL queries, but that would be too much like work. It’s far better to create a report with Crystal Reports, and then run the report whenever you want the latest status of the information of interest. You have to create the report only once, but you can run it many times, getting the latest results with each successive run. You don’t have to learn SQL or any other method of pulling data out of databases. Reports created with Crystal Reports are easy to build, easy to read, and easy to understand. What could be better?
SQL is the international standard language for communicating with databases. It differs from most common computer languages in that it’s nonprocedural. It deals with data a set at a time rather than a record at a time. Database devel-opers use SQL. If you’re a database user (rather than a developer), Crystal Reports may give you everything you need to get what you want out of your databases.
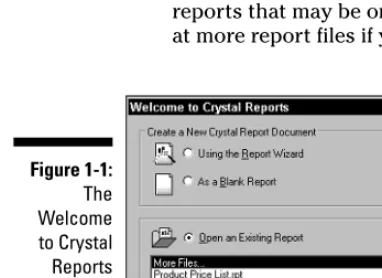
The first step to creating a report is to launch Crystal Reports from the Windows Start menu. When you do, the Crystal Reports main window appears, displaying the dialog box shown in Figure 2-1.
Figure 2-1:
Welcome to Crystal
You are invited to choose from three options. You can create a Crystal Reports document using Report Wizard or by starting with a blank report. Alternatively (as I demonstrate in Chapter 1), you can open a report that already exists, either to change it or to run it.
Although Report Wizard can be a time- and labor-saver, it does constrain the form of the report. So this chapter takes you right to the point and shows you how to create a report yourway, starting from a blank report instead of using Report Wizard.
Creating a Report with the
Blank Report Option
To create a report from scratch, starting with the blank report option, follow these steps:
1. Start Crystal Reports.
The Welcome to Crystal Reports dialog box appears.
2. Select the As a Blank Report option, and then click the OK button.
The Database Expert dialog box appears, as shown in Figure 2-2.
Figure 2-2:
3. In the Available Data Sources pane, click the plus sign to the left of the Create New Connection folder to expand it.
This is the folder you choose whenever you’re creating a report from scratch. When you have connected to a database, Crystal Reports remembers where it is.
4. Double-click the database type that matches your data source.
Crystal Reports recognizes a variety of different database types. You must select the right one. If you don’t know which type is correct, ask someone familiar with the data source. To follow along with the example, double-click Access/Excel (DAO). The Access/Excel (DAO) dialog box appears, as shown in Figure 2-3.
5. Click the ellipsis (...) button to the right of the Database Name box.
The Access and Excel files on your system appear. For the example, I selected an Access database file named xtreme. This may not be as easy as it sounds. Mine was located at D:\Program Files\Crystal Decisions\Crystal Reports 10\Samples\En\Databases\ xtreme.mdb.
You may have to browse to find this file on your system.
6. Click the Finish button.
Database Expert reappears, as shown in Figure 2-4, with the xtreme data-base connected.
7. Expand the Tables node, and then double-click the table on which you want to base your report.
Figure 2-3:
The tree in the Available Data Sources pane consists of a number of nodes, some of which branch off from others. Every data source has four of these nodes branching off from it: Add Command, Tables, Views, and Stored Procedures.
8. To follow along with the example, expand the Tables node and then double-click Product.
Doing so copies the Product table from the Available Data Sources pane to the Selected Tables pane.
9. Click the OK button to close Database Expert.
A blank report fills the window, as shown in Figure 2-5.
Figure 2-5:
A blank report.
Figure 2-4:
The Design tab (on the left edge) shows five sections of the report:
Report Header:Appears only at the top of the report and is the first thing that a viewer sees.
Page Header:Appears below the report header and at the top of all the other pages in the report.
Details:The actual content of the report.
Report Footer section:Appears after the last detailed information in the report.
Page Footer:Appears at the bottom of every page of the report.
Allocating more space to the layout
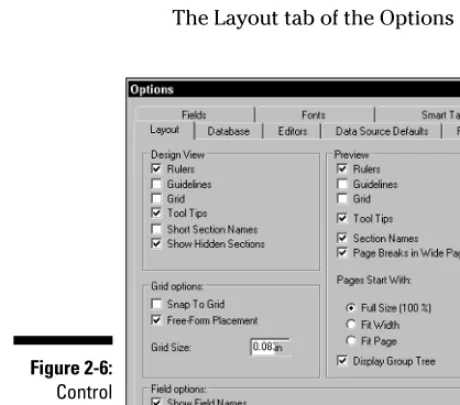
Depending on the resolution of your computer screen, the Crystal Reports window may not display the full width of your report. You can give yourself a little more width in the display by changing one of the display options. Follow these simple steps:
1. Choose File➪Options.
The Layout tab of the Options dialog box appears, as shown in Figure 2-6.
Figure 2-6:
2. In the Design View section, click to select the Short Section Names option.
This reduces the section names on the left edge of the window to one- or two-letter abbreviations, freeing up a little horizontal real estate.
3. Click the OK button.
4. Drag the left edge of the Field Explorer farther to the right, to allocate more horizontal space to the work area.
You can now view more of the report without resorting to horizontal scrolling.
Giving the report a title
The Report Header area (at the top of the first page of the report) is the ideal place to tell the reader exactly what the report contains. However, this forces you, right here at the beginning, to decidewhat the report is to contain. No problem: Start by considering who your target audience is and what they want to know.
If you are Xtreme Mountain Bikes, the target audience for your Products report is potential customers. They surely will want to know what products you carry, including information on color and size, where appropriate. They probably also want price information. They’ll also need to know the stock number of an item so they can specify it properly when they decide to purchase a bike.
Placing your company logo in the report header also makes sense. The Xtreme logo is not available conveniently on the Crystal Reports distribution CD. For the purposes of this demonstration, any logo-sized image file will do. You can add one to the report header along with a title, such as Product Price List.
To add a logo to a report, do the following:
1. Dismiss Field Explorer, if necessary, by clicking the X in its upper-right corner.
2. With the Design tab selected, click the Insert Picture icon in the Insert toolbar.
A dialog box appears, displaying the image files in the Databases folder. There were no image files in my database folder, so I looked around for a substitute. I found one here:
E:\Program Files\Crystal Decisions\Crystal Reports
Wow! That is one long URL. Perhaps you’ll find a suitable image some-where else. Your organization’s own logo would do fine.
3. Click the picture’s filename to select it (an outline of the logo appears on the report layout), place it in the upper-left corner of the report header with the mouse, and then click to fix it in place.
Figure 2-7 shows the result.
My substitute logo was mlb.bmp. It is a baseball logo. I have loved base-ball ever since I played in the farm league in Belleville, New Jersey. I played in the farm league almost my whole career, only moving up to Little League a few weeks before I became too old to play in Little League any more. You can use whatever you want for your substitute logo.
You can find out the names of the toolbar icons such as the Insert Picture icon by hovering the cursor over them. After a few seconds, a tooltip appears, telling you the name of the tool you’re looking at.
Next, you put a report title into the Report Header section as well. To do this, you will have to use several of the tools in the Insert toolbar.
1. Pull down the dividing line between the Report Header section and the Page Header section so that you can place the report title below the level of the logo.
To pull down a dividing line, hover the cursor over it until the cursor changes shape, depress the left mouse button and drag the line to the position you want it to be in, and then release the mouse button.
2. Click the Insert Text Object icon in the Insert Tools toolbar.
A text object rectangle appears.
3. Drag the rectangle into the Report Header section, and drop it.
To drag and drop the rectangle: Put the mouse pointer over the rectangle, press and hold down the mouse button to select it, move it to the desired location, and then release the mouse button to drop the rectangle. A text cursor starts to blink inside the rectangle.
Figure 2-7:
4. At the blinking cursor’s location, type the report title.
For the example, type Product Price List.
5. Select the title you just typed, and then increase its size by clicking the Increase Font Size icon.
6. Make the title bold by clicking the Bold icon.
7. Move the left and right edges of the text object to the left and right edges of the report, respectively, and then click the Align Center icon to locate the title in the center of the page.
At this point, your report should look similar to Figure 2-8.
Choosing the fields that will
appear in your report
The next logical step is to place in the Details section the fields you want the report to display. Simply follow these steps:
1. If the Field Explorer is not currently visible, display it by clicking View➪Field Explorer on the main menu.
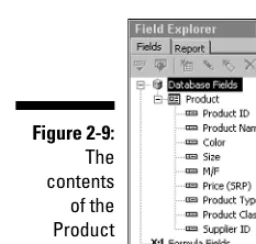
2. In Field Explorer, click the plus sign to the left of Database Fields; click the plus sign to the left of Product to display its fields (because the Product table is the only available data source, it is the only one listed).
Field Explorer displays the fields in the Producttable, as shown in Figure 2-9.
3. Click the first field that you want to include in the report, and then drag it to the left edge of the Detail section.
For the example, click the Product IDfield. When you drag the field, a rectangle appears. The field name appears in the rectangle in the Detail section and also above it in the Page Header section. Later, you may want to change the column titles in the Page Header section for cosmetic rea-sons. For now, just leave the default column titles.
Figure 2-8:
4. Repeat Step 3 for any other fields that you want to include in the report.
For the example, place the Product Name, Color, Size, and Price (SRP)fields in order in the Detail section, leaving just a little space between them.
Crystal Reports 10 automatically adjusts the fields displayed to match the field sizes you chose, and spaces them out proportionally. You can manually adjust the field sizes by grasping the handles on the left and right edges of the fields and moving them. You can resize the fields and move them back and forth until you arrive at a good balanced appear-ance. At this point, your report layout should look similar to the one shown in Figure 2-10.
Improving the readability of page headers
Everything in the Page Header section appears just below the Report Header on the first page of the report and at the top of all following pages. By default, the field names in the Page Header section are displayed in a normal font andFigure 2-10:
All fields have been placed in the Detail section.
Figure 2-9:
The contents
underlined. I think they’d look better in a bold font and not underlined, so I select the Bold attribute for each of them and deselect the Underline attribute. I’ll wait to see what the report looks like before deciding whether I want to change the font size as well. Figure 2-11 shows the layout with the enhanced column headings.
Previewing the report
So far, you’ve been able to see the layout of your report only in the sectioned structure of Design mode. To get a better idea of what the report looks like at this point, you can switch to Preview mode. To do so, click the Print Preview icon in the Standard toolbar. This displays the Preview tab in the upper-left corner of the work area and displays the report, complete with data pulled from the Products table. Figure 2-12 shows as much of the report as the screen can hold.
Figure 2-12:
A preview of the Product Price List report.
Figure 2-11:
You can notice a couple of things about the report at this point. First, Crystal Reports apparently automatically inserts commas between groups of three digits in number fields, such as the Product ID field. This is not what you want. Second, the color attribute must not apply to gloves because no color information is shown for the glove products that we can see.
The fact that gloves have no color is not a problem, but the comma in the middle of the Product ID is a problem. You can correct this as follows:
1. Click the Design tab to return to Design mode.
2. In the Details section, select the field whose number format you want to change.
For the example, select the Product ID field.
3. Choose Format➪Format Field.
Format Editor appears.
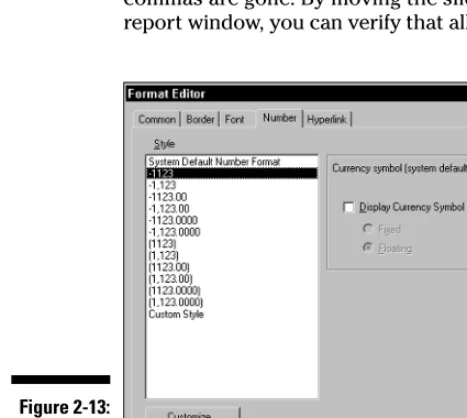
4. Click the numeric format that you want, and then click the OK button.
For the example, you want the format with no commas, as shown in Figure 2-13. This changes the format of the Product ID field to eliminate the unwanted commas.
You can verify the change by returning to Preview mode and noting that the commas are gone. By moving the sliders at the right and bottom edges of the report window, you can verify that all columns and rows are as they should be.
Figure 2-13:
Page footers carry useful information
At the bottom of each page, you might want to display some useful informa-tion, such as the page number. If you ever drop a stack of reports off your desk, page footers can be a valuable aid to putting them back together again in the proper order.
For the Product Price List, the page number, date printed, and report title are valuable additions to the page footer. (Prices tend to change frequently in a fast moving industry such as the mountain bike business, so the date of a price list is very important.) In Design mode, follow these steps to create a page footer for your report that includes all three of these items:
1. In the Insert toolbar, click the Insert Text Object icon.
You click this icon because all the items you want to place in the page footer are text items.
2. Drag the text object rectangle to the Page Footer section and place it by clicking the left mouse button.
3. Drag the handles on the left and right sides of the rectangle until it spans the full width of the page.
4. Click the Align Center icon.
There isn’t any text there yet, but there will be.
5. Right-click the text rectangle and choose Edit Text.
6. At the blinking cursor in the rectangle, type the report title, followed by a comma.
Type Product Price List, for this example.
Next, place the current date and page number into the page footer:
1. In Field Explorer, scroll down to Special Fields and expand it.
Remember, you expand a node by clicking the plus sign to its left.
2. Click the Print Date icon or the Print Date name next to it, and drag it to the Page Footer area, right after the comma.
3. After the Print Date field is in position, type a comma after it, and then type Page followed by a hyphen.
4. Click the Page Number icon or the name next to it, and drag it to the right of the hyphen.
5. Click the Preview tab at the top of the screen to switch to Preview mode.
The field names are replaced by actual values, as shown in Figure 2-15.
Wrap things up with a report footer
For some types of reports, it’s appropriate to have a final item to close out the report. This would appear after the last of the data on the last page. Items such as this go into the Report Footer section in Design mode. Remember, the report footer comes immediately after the last line of detail information and beforethe final page footer.
To illustrate this feature of Crystal Reports, put a company slogan at the bottom of the Product Price List. Place the slogan “Xtreme Mountain Bikes Take You to the Limit”into the Report Footer section in the same way that you put the report title into the Page Footer section. The result, in Preview mode, looks like Figure 2-16.
Figure 2-15:
Page footer in Preview mode.
Figure 2-14:
Recording helpful information
about your report
Now that the Product Price List report is essentially complete, you may want to generate some descriptive information about the report that’s associated with the report but not normally printed or displayed. To do this, follow these steps:
1. Choose File➪Summary Info.
The Document Properties dialog box appears.
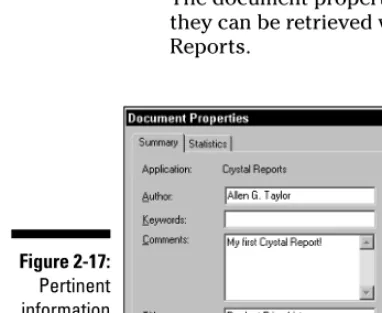
2. Fill in the boxes with whatever information you want to associate with your report.
I added the information shown in Figure 2-17.
3. Click the OK button.
The document properties you entered are stored along with the report; they can be retrieved whenever anyone views the report with Crystal Reports.
Figure 2-17:
Pertinent information about the Product Price List report.
Figure 2-16:
Troubleshooting a Report That
Doesn’t Look Quite Right
Sometimes the vision you have in your mind is not adequately reflected in the report you produce. There are various reasons why this might be true. Perhaps your vision is not something that can be built in the real world. You can’t do much about that. But you can do something about other reasons, such as not using Crystal Reports properly or not being aware of all its capabilities.
Crystal Reports gives you tremendous freedom in how you can lay out your report. It also gives you great latitude in what you include in the report. In addition to text and columns of numbers, you can include graphical images, charts, graphs, and maps. You could even crank out a full-length science fic-tion novel with Crystal Reports if you wanted to, although other tools are better suited to that task.
The bottom line is this: If you feel sure that a report ought to be able to include something, you can almost certainly do it with Crystal Reports. This book tells you about many of the most powerful and useful features of Crystal Reports. If I don’t mention a feature or capability that you’d like to use, it may nonethe-less be available. Check the Crystal Reports User’s Guideand online help for additional information on advanced features. Crystal Reports is a product of Business Objects SA. More information on Crystal Reports can be found at www.businessobjects.com.
Printing a Report
Chapter 3
Report Design Guidelines
In This Chapter
Defining the purpose of the report
Deciding what the report should include
Linking the report to a database
Laying out the report
Conveying the right message
N
o book can tell you in a step-by-step manner exactly how to build the report you want. However, this book gets you into some general princi-ples of good report design — and shows you some common types of reports. From those general principles and examples, you can decide how best to design reports that meet the needs of your organization.An effective report design depends on many factors:
The data that the report draws from the database
The way the database is structured
The level of detail that the users of the report require
The purpose of the report
The capabilities of the computer that displays or prints the report
What the users of the report really need (understanding this is critical)
Audience
Some potential audience members may be familiar with the information that the report contains — and old hands at the naming conventions used for objects in the database. These people may prefer a streamlined presentation of the data. Other audience members might be unfamiliar with the report content — so you may have to translate terms, use graphical devices (such as charts), and include explanatory text. If you have two such divergent audi-ences, you may need to produce two reports. Both would contain the same information, presented in different ways.
Another question to ask is, “What information does the audience need and in what form should it be delivered?” If they need several unrelated things, you may serve them better by creating several reports, each one focused on one specific purpose.
Although it’s best to write a report with one consistent audience in mind, sometimes you have to design a report for multiple audiences, each with its own needs. The challenge is to give the members of each audience the infor-mation they need in a form they can easily understand, without handicapping the members of other audiences by subjecting them to irrelevant material. The key is to organize the information so members of each audience can quickly and easily find and understand the information of interest to them.
Purpose
In addition to having a specific audience, the report should be restricted to one specific purpose — and accomplish that purpose by providing thorough, accurate, timely information to the target audience. This information, more often than not, is the basis for important decisions that the readers of the report will make.
Restricting a report to serving a single purpose does everyone a favor. Reports that cover multiple topics generally don’t do justice to any one of them and tend to confuse readers. A good report covers a single topic and conveys a message that the reader can easily comprehend and act upon.
Knowing how important the report is to its audience may affect the amount of time and effort you put into creating it. Is the report likely to be a basis for “bet-the-business” decisions? Or does it simply make visible some facts that are nice to know but not earth-shattering?
the latest information in the database every time. Reports that are run multi-ple times, by multimulti-ple peomulti-ple, deserve more attention to detail than reports run only once.
Content
After you know who the report is for, and the kinds of decisions they want to base on the information in the report, it’s time to decide exactly what infor-mation should bein the report. Leaving out distracting, irrelevant material is just as important as including material of interest.
The best reports are succinct and to the point, offering readers the information they want right away, minus the clutter of information they don’t care about. Keeping in mind the audience and the purpose of the report, also consider what level of formality or informality is most appropriate.
If your report has to meet the needs of several audiences, shape its content along these lines:
Determine which audience is the most critical.
Determine which information is the most important to that audience.
Display the most important information most prominently in the report.
Put other, less important information for the most critical audience in a nearby but subordinate position.
For the other audiences, cluster the information in such a way that each group reading the report can find all the information it needs within a single area of the report.
Connecting to Microsoft Access
Suppose you want to create a report based on data in a Microsoft Access database. Follow these steps:
1. Start Crystal Reports.
You are greeted by the Welcome to Crystal Reports dialog box.
2. Choose the As a Blank Report option, and then click OK.
Database Expert is displayed.
3. Expand the Create New Connection node by clicking the plus sign (+) next to it.
As shown in Figure 3-1, various data sources are available.
4. Connect to the appropriate database and display its tables in the Available Data Sources pane of Database Expert, as shown in Figure 3-2.
For more information on this process, see Chapter 2. To follow along with this example, connect to the xtremel.mdbdatabase.
5. Select the tables in the database that contain the data you want to include in the report.
Figure 3-1:
The Data-base Expert dialog box shows possible locations
For the example, double-click the Customer and Orders tables in the Available Data Sources pane (to add them to the Selected Tables pane).
6. Click OK.
The Link view appears, showing how the selected tables relate to each other.
7. Click OK to exit Database Expert.
You are now connected to the database of choice and have selected from it the tables that contain the data that will be included in your report.
So, how do you connect your report to the Access database? You don’t have to. It’s all transparent. Crystal Reports has made the connection behind the scenes, without any help from you, beyond specifying the name of the data-base, finding it on your system, and choosing which tables to use from the database.
Connecting to other data sources
Access is a desktop database application; usually it resides on the same physical computer you’re sitting in front of while you work with it. It also might be lurking on another computer on a small local-area network. Access is not designed to handle large databases or large numbers of simultaneous
Figure 3-2:
pre-and in an entirely different format for teenage video-game enthusiasts. The information in both reports might be identical — but to be effective, the pre-sentation of data should be vastly different.
Making a good first impression
I’ve heard that when you meet someone for the first time, within the first 30 seconds they form a judgment of you. They decide whether they like you, trust you, or respect you. That snap judgment, based on 30 seconds of input, affects how they deal with you from then on.
Salespeople have known this truth about first impressions for a long time, which is why they “dress for success” when making a sales call. They want to make a good first impression so their prospect will be predisposed to like them, trust them, respect them, and buy from them. For all the same reasons, you want every report you create to make a good first impression so its read-ers “buy” (buy into) what you’re selling: the information in your report.
One important way to make a good first impression is to make the appearance of your report appropriate for the audience and for the occasion. Know who your audience is and what they expect this particular report to tell them. When they look at the first page of your report for the first time, it should immediately meet their expectations. They should see a clear indication of what the report is, and an engaging presentation of the information they’re most interested in seeing.
It would be a mistake to bury the most important information somewhere in the back pages of the report. For some reports, it may even be appropriate to state the conclusions that can be drawn from the data, right up front. This can encourage readers to dig deeper and digest the data pulled from the database that backs up your conclusions.
Deciding how best to present
the information
With Design view, you have complete freedom to arrange the various report elements on the page. You also can use many more different kinds of report elements than the Report Creation Wizard allows, and add functionality way beyond merely displaying data from the database. Throughout this book, I show you sophisticated ways to give your report’s readers the information they want, in the most effective way.
Should the report include graphs,
charts, or pictures?
If a picture is worth a thousand words, a graph is worth a lot more than a large table of numbers. Graphs and charts are valuable parts of any report that needs to show relationships between data items or trends in data. Some types of reports — such as those displaying sales figures for a product or for a family of products — have much more impact if they include graphs of the data along with the figures that back up the graphs. Other types (such as membership lists for organizations) won’t benefit from graphs or charts.
Pictures such as photographs, illustrations, or line drawings can greatly increase the value of some types of report by presenting the information in an immediate, visual way. The more pathways into the brains of the readers you use, the likelier it is that they’ll fully receive and appreciate your message.
When you’re designing a report, ask yourself this question, “Would a graph, chart, or other illustration improve the understanding and acceptance of the content of this report?” If the answer is “Yes,” then consider adding such an illustration. If an added illustration won’t improve understanding and accep-tance, don’t include one; it could distract from the message the report is supposed to convey.
Style communicates meaning, too
You want to communicate with the reader on an emotional level as well as merely on an intellectual level. If, for instance, your report is designed to inform potential investors about the benefits of investing in your company, the report should convey an aura of professionalism, but at the same time be consistent with the business you are in. The prospectus for an investment-banking firm should have a very different style from the prospectus for a cutting-edge video-game company. Each should convey the idea that the com-pany understands the business it’s in, but the difference in industry dictates different presentation of company information. Reports should convey a style that readers would expect to see from the top organization in its field. Style adds credibility, on an emotional level, to the facts being presented.
Does the report convey the message?
Chapter 4
Reporting Overview
In This Chapter
Using Standard Report Creation Wizard
Building a report from scratch
Getting the data
Y
ou can start a report in any of several ways. Chapter 2, for example, shows how to create a report from scratch, starting with a blank report file. Another way is to use an existing report as a template; the new report has different content but is structurally similar to the existing report. Generally the quickest way is to use the Report Wizard, which does much of the work for you but makes some assumptions that limit your options.This chapter follows the speediest approach: I walk you step by step through building a report with the Report Wizard. You give up some freedom and flex-ibility (compared to the from-scratch approach) but the wizard does much of the work for you — fast.
Creating a Report with Report
Creation Wizard
The various styles of reports that the Report Wizard can produce are listed in the pane on the left. The pane on the right displays a sample layout for the currently selected report style.
Creating a standard report
You start your investigation with a standard report, which is the one most people will need most of the time. The example is from the fictitious Xtreme Mountain Bikes Inc., a business that sells mountain bikes and associated acces-sories. However, its information needs are much the same as the needs of any business that buys products from suppliers and sells them to customers. Thus, the kinds of standard reports that Xtreme needs are representative of the reports that many retail or wholesale businesses would find useful.
Suppose Xtreme’s sales manager wants a detailed report of all orders placed in December 2000. She wants the report to include each customer’s name, as well as the order date, order number, salesperson’s name, items ordered, quantities ordered, and the extended price of each item ordered. To build this report, data must be extracted from multiple tables. Follow these steps to get it done:
1. Start Crystal Reports.
The Welcome to Crystal Reports dialog box appears.
2. Make sure that the Using the Report Wizard option is selected, and then click OK.
The Crystal Reports Gallery dialog box appears (refer to Figure 4-1).
Figure 4-1:
Crystal Reports Gallery asks what kind
3. At the top of the screen, choose the Using the Report Wizard option.
4. In the Choose a Wizard area, select the Standard option.
5. Click the OK button.
The Standard Report Creation Wizard dialog box appears.
6. Locate the database by using the procedures outlined in Chapters 2 and 3.
7. Click the plus sign to the left of the database name, and then click the plus sign to the left of the Tables item.
To follow along with the example, click the plus sign to the left of the Xtreme sample database, xtreme.mdb, and then click the plus sign to the left of the Tables icon. You see the names of the tables in the data-base, as shown in Figure 4-2.
8. Select the tables that contain data that will be used by the report, moving them to the Selected Tables pane.
To follow along with the example, double-click the Customer table in the Available Data Sources pane and move it to the Selected Tables pane. Do the same for the Orders, Employee, Orders_Detail, and Product tables.
9. Click the Next button.
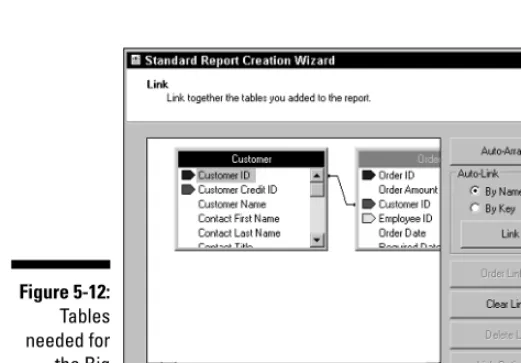
Standard Report Creation Wizard displays the Link view.
Figure 4-2:
The main pane of the Link view shows the tables, along with links to other tables with which they share common columns. Figure 4-3 shows what the Link view looks like at this point. The pane isn’t large enough to show all the tables, but you can use the scroll bars to make sure they’re all there and are all linked by common columns.
The Standard Report Creation Wizard has inferred that columns with the same name in different tables refer to the same objects — a valid assumption in this case, but it may not always be true. If any link that the wizard has assumed is incorrect, you can change it manually: Just click it to remove it, and then drag the pointer from one table to another to add new links.
After the tables and links are arranged to your satisfaction, do the following to continue with the example:
1. Click the Next button in the Link view of the Standard Report Creation Wizard.
The Fields view appears.
2. From the tables selected previously, select the fields you want for the report.
To follow along with the example, expand the Customer table node and select Customer ID and Customer Name from it. Select Last Name and First Name from the Employee table; Order ID, Order Amount, and Order Date from the Orders table; Product ID, Unit Price, and Quantity from the Orders Detail table; and Product Name from the Product table. At this point, Standard Report Creation Wizard looks like Figure 4-4.
Figure 4-3:
3. Click Next.
The Grouping view appears.
4. Because you don’t want to do any grouping in this report, click Next.
The Record Selection view appears.
5. Double-click the field that you want to filter on to move it to the Filter Fields pane.
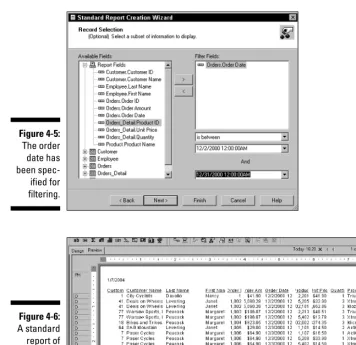
For the example, you want to filter out all orders that were notplaced during December 2000, so double-click the Orders.Order Datefield.
6. Pull down the list below the Filter Fields pane and select the method for filtering. Then make any secondary filtering selections, if necessary.
For the example, select is between. In the sublist, select the dates of the first and last orders that were placed during December 2000 (as in Figure 4-5). You may select any month displayed in the xtremedatabase.
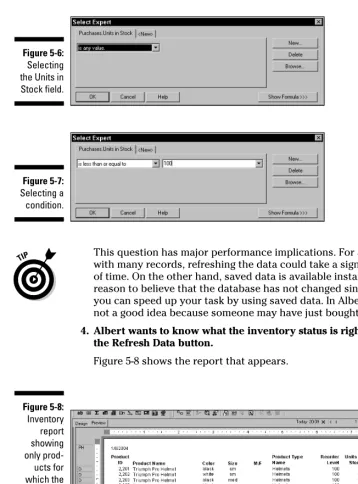
7. Click the Finish button.
The finished report is displayed, using the Preview tab in Crystal Reports, as shown in Figure 4-6. If the Field Explorer is still displayed, you can dis-miss it to show more of the right side of the report. You can also drag the left boundary of the report area farther to the left if needed.
To fit everything on an 81⁄
2x 11 inch sheet, the columns have been squeezed together; some information in some columns does not appear. To remedy this situation, choose File➪Printer Setup and change the orientation from Portrait to Landscape mode to get additional room.
Figure 4-4:
After a little rearranging with the Design tab active, the report might look like Figure 4-7.
Not bad, but you probably want to make it clear what this report is about by adding a report header. You can also change column headings in the Page Header band if you want to. In general, you can use Standard Report Creation Wizard to do the bulk of the layout for a fairly standard report, and then fine-tune the result using the tools available in the Design tab.
If you produce a report that’s close to one of the templates used by Standard Report Creation Wizard, it’s usually quicker and easier than designing a report from scratch.
Figure 4-6:
A standard report of December 2000 orders.
Figure 4-5:
When you’re satisfied with your report, save it by choosing File➪Save from the main menu. Later on, when you run the saved report, it reflects the state of the database at the time you saved it (the last time it was run). That’s useful if you’re reporting on historical data (as in the example report) or on data that changes on an ongoing basis.
The rest of the Report Creation wizards
The Standard Report Creation Wizard gives you a good idea of how Report Creation wizards work. The other Report Creation wizards have a lot in common with the Standard Report Creation Wizard, as follows:Cross-Tab Report Creation Wizardbuilds a report that displays data as a cross-tab object. I cover cross-tab reports thoroughly in Chapter 10.
Mail Label Report Creation Wizardautomates the task of laying out a report formatted to print mailing labels. It’s already set up for standard commercial label formats, but you can also design a custom label format.
OLAP Report Creation Wizarddisplays OLAP (On-Line Analytical Processing) data as a grid. OLAP reports are similar to cross-tab reports but have different data sources and a distinctive data structure. (For more about OLAP and how to report on OLAP data, see Chapter 14.)
Starting with a Blank Report
When it displays the Gallery, Crystal Reports makes the default assumption that you want to use Report Wizard. In many cases, however, starting with a blank report is the best choice — especially if what you want is not consis-tent with what Report Wizard can produce.
Figure 4-7:
Accessing database files directly
The fastest way to pull data out of a database and include it in a report is through a direct access interface. This makes sense — the less stuff you have between the database and the report, the shorter the transit time as data goes from one to the other. Another advantage is the simple connection. As a report designer, you don’t have to fuss with types of connections and middle-tier dynamic-link libraries (DLLs). You just name the data source you want to tap for data, and tell Crystal Reports to go get that data.
However, as you know, There Ain’t No Such Thing As A Free Lunch (TANSTAAFL). The price you pay for the speed and simplicity of a direct connection is the need for a different, highly customized driver for every different data source.Usually not a problem — Crystal Reports offers a wide variety of such drivers — unless your report draws data from two or more different data sources. In such a case, you can’t use direct access; you’d have to talk to each data source in its own “language,” and Crystal Reports doesn’t support using multiple languages in a single report.
Crystal Reports has direct access drivers for most of the popular PC database formats, including Microsoft Access, the dBase/FoxPro/Clipper triad, Paradox and the Borland Database Engine (BDE). In addition, it supports Microsoft DAO/OLE, Btrieve, ACT!, COM, Java data, Microsoft Exchange, and Microsoft Outlook. Crystal Reports has direct access drivers for the following client-server SQL databases: Oracle, Microsoft SQL Server, Sybase, Informix Online Server, and IBM’s DB2 Server. Crystal Reports also talks directly to IBM’s Lotus Domino, your computer’s local file system, the Windows NT, 2000, or XP Event Log, the Microsoft IIS or Microsoft Proxy log file, Web or IIS log files. If it holds data, is fairly widely used, and runs on a Windows box, Crystal Reports prob-ably had a direct access interface for it.
Linking to ODBC data sources
An ODBC database connection may not perform quite as well as a direct-access connection because the data has to pass through an extra layer of processing. This may or may not be a problem, depending on the implementation and the needs of the application. On the plus side, an application that communicates to its data sources through ODBC can pull data from multiple different data sources. It puts out its request in the same ODBC format, regardless of which data source it’s talking to. Each such source has its own ODBC driver that translates the common ODBC commands into data-source-specific commands that the data source can understand and obey.
Data sources for which Crystal Reports has a direct access connection are also reachable through ODBC. For example, you can connect to Microsoft Access either through the direct connection or through ODBC. Direct connection may give you better performance — as long as your report requires data onlyfrom Access. However, if you want to include data from a data source that has no ODBC interface, you must use ODBC for both Access and that second data source. Performance may be slower, but it beats a lack of access.
Retrieving data from Crystal
SQL Designer files
Crystal Reports Designer is a tool you can use to create SQL queries of ODBC data sources. The query runs on a server and returns a result set to your computer in the form of a Crystal SQL Designer file. Offloading some query processing frees up your computer to concentrate on other tasks, possibly improving performance — and that’s the primary advantage of using Crystal SQL Designer. A second advantage is that you can use the full power of SQL to retrieve exactly the data you want.
But there’s no free lunch here: You must be fluent in SQL to use Crystal SQL Designer. Gaining that fluency requires some effort, but may be well worth the time you put into it. Start by reading my SQL For Dummies,5th Edition (published by Wiley). It gives you a painless introduction to SQL and a thor-ough description of all major features of the language.
Reporting on data in OLE DB data sources
OLE DB is a connectivity methodology similar to ODBC (no surprise — both were developed by Microsoft). OLE DB adds some flexibility in the types of data sources it can communicate with (such as multidimensional OLAP sources and Web servers). ODBC communicates with relational databases that use SQL; OLE DB covers the rest, addressing data sources that don’t use SQL (although it works well with relational databases too). Crystal Reports supports OLE DB data sources, which are called OLE DB providers.Creating customized data access
with Crystal Dictionaries
Dictionariesare filters that tailor the appearance of data for specific groups of users (or even those of individual users). Typically set up by Information Systems (IS) managers, a dictionary can offer customized access to multiple data sources. Only the database tables or other sources in the dictionary are accessible. Table and source names may be changed to make more sense to the target users. A dictionary can also manipulate data pulled from the sources without the user being aware of the manipulation. The idea is to help users bypass unneeded information, use the system effectively, and reduce the chance of errors.
Which interface should you use?
Which interface to use? It depends. (You knew I was going to say tha