© 2018 IJSRCSEIT | Volume 3 | Issue 3 | ISSN : 2456-3307
Tuberculosis Disease Detection Using Image Processing
Rajkumar. M
Department of Computer Science, Pondicherry University, Puducherry, India
ABSTRACT
Tuberculosis is one of the deadliest disease in this world especially in developing countries. Sputum smear microscopy is the main diagnostic tool in developing countries and high burden countries for the detection of tuberculosis. Previous studies shows that the manual screening for sputum smear microscopic images lead to misdiagnosis and false result. Image processing techniques are applied in this research to enhance, segment and classify the sputum smear images for computerized process of tuberculosis bacilli identification. Image processing algorithm which used for sputum smear image include a series of enhancement techniques, segmentation methods and morphological operation. As the non-bacillus objects in sputum smear image can bias the detection, it should be suppressed from the smear image. This paper employs color image segmentation technique for segmenting the tuberculosis bacillus objects from the background.
Tuberculosis bacillus objects are segmented from the background in two stages based on color space conversion and k-means clustering to identify the tuberculosis bacilli. The proposed method uses thirteen texture feature extraction and makes the judgement using multi-support vector machine. The experiment result confirmed the superior performance of the proposed method.
Keywords: Image Acquisition, Preprocessing, Segmentation, Feature Extraction, Classification
I.
INTRODUCTION
Tuberculosis is one of leading deadliest disease in the worldwide, caused by bacillus mycobacterium tuberculosis. And the diagnosis of this disease had different detecting methods depending on the tuberculosis type and the patient’s status. Early diagnosis of tuberculosis and initiating optimal treatment it not only enable a cure of an individual patient but also it will also curb the transmission of the infection and disease to another in the community.
For developing countries like our country the sputum smear microscopy still the main method for diagnosing tuberculosis. The main advantages of smear microscopy is simple and inexpensive also it is relatively easy to perform and read and detect transmitters of tubercle bacilli also its results can be reported within hours of receipt of sample and
provide reliable epidemiological indicators for evaluation of patient status. Smear microscopy is quick but requires a very high organism load for positivity as well as the expertise to read the satin sample. For avoiding the two above main limitation of using smear microscopy computer based method for identifying the TB bacilli in stain sample is required. Automatic image processing of the stained sputum smear digital images would reduce the burden on the pathologist or technician, reduce human error, and improve sensitivity of the test. It would reduce the time required and need of lab technicians and allow preliminary detection of TB in remote or rural areas where pathologists or technicians are unavailable [1].
computer-aided systems for TB detection. The systems aim to assist medical technologist in the diagnostic process. Any automatic method for diagnosis TB disease was combination techniques between image processing and pattern recognition technique.
II.
LITERATURE SURVEY
In this section, various method of image processing for tuberculosis disease detection is discussed. Tuberculosis is a bacterial disease that can attack any part of the body, most frequently the lungs. The bacterium, mycobacterium tuberculosis, is an airborne bacterium, meaning that it is passed from person to person through the air, i.e. via coughing, sneezing, laughing or even just talking. So that the number of people that have been infected with TB is rapidly increase, according to world health organization (WHO) annual report on global control of tuberculosis published in 2014, there were an estimated 9.0 million new cases of tuberculosis (TB) incidence in 2013 and about 1.5 million TB deaths[2].
Gaps in TB case finding and the emergence of drug-resistant TB have created a pressing need for robust and accurate diagnostics. Newer tests such as Xpert MTB/RIF are having an impact in increasing case detection and reducing time to treatment [13] . The first methods for automatic bacilli screening in conventional microscopy were published only in 2008 by:
Costa et al [14] they have developed an automatic identification method of mycobacterium tuberculosis with conventional microscopy images based on Red and Green color channels using global adaptive threshold segmentation. Differing from fluorescence microscopy, in the conventional microscopy the bacilli are not easily distinguished from the first automatic identification method of tuberculosis bacilli for conventional light microscopy.
P. Sadaphal et al [15] proposed an automated multi-stage color-based Bayesian segmentation identified possible “TB objects”, has been used to remove artifacts by shape comparison and color-labeled objects as “definite”, “possible” or “non-TB”, by
passing photomicrographic calibration.
Superimposed AFB clusters, extreme stain variation and low depth of field were challenges. Their novel method facilitated electronic diagnosis of TB, permitting wider application in developing countries where fluorescent microscopy is currently inaccessible and unaffordable.
Khutlang et al [16] their research illustrate that the Screening for tuberculosis (TB) in low- and middle-income countries is centered on the microscope. They presented methods for the automated identification of Mycobacterium tuberculosis in images of ZN stained sputum smears obtained using a bright-field microscope. They segment candidate bacillus objects using a combination of two-class pixel classifiers. The algorithm produced results that agree well with manual segmentations, as judged by the Hausdorff distance and the modified Williams index. The extraction of geometric-transformation-invariant features and optimization of the feature set by feature subset selection and Fisher transformation follow. Finally, different two-class object classifiers are compared.
used to separate objects of interest from the background. A number of geometrical features are then extracted from the segmented images. A modified training algorithm called Extreme Learning Machine (ELM) was used to train a hybrid multi-layered perceptron network (HMLP) for the classification task.
Shan-e-Ahmed Raza et al [18] A key component of their proposed algorithm is the enhancement of raw input image using anisotropic tubular filtering (ATF) which suppresses the background noise while simultaneously enhancing strong anisotropic features of AFBs presented in the image. For segmentation they were used color features and candidate AFBs were identified. Finally, a multi-support vector machine classifier using morphological features from candidate AFBs decided whether a given image was AFB positive or not.
Kusworo Adi et al [19], in their research, represent an algorithm to identifying and counting the number of tuberculosis bacteria has been developed by microscope imaging. Color segmentation was done by way of extracting the Saturation channel of NTSC (Luminance, Hue, saturation) color model. Thresholding process was using Otsu Method. Feature extraction for bacteria shape identification process using two parameters i.e. eccentricity and compactness. The training and object recognition using multi-support Vector Machine algorithm. Rachna H.B et al [20] in their work, developed an algorithm based on image processing for identification of TB bacteria in sputum. The method based on Otsu thresholding and k-means clustering and show good accuracy and efficiency.
III.
BASIC STEPS FOR DISEASE DETECTION
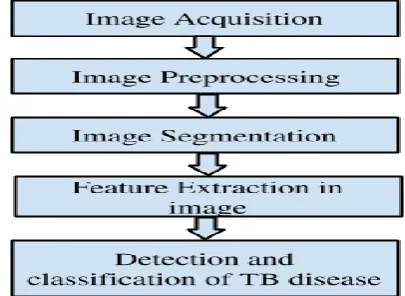
In this section, basic steps for tuberculosis disease detection and classification using image processing are shown in Figure 1.
Figure 1. Basics steps for TB disease detection
A.Image Acquisition
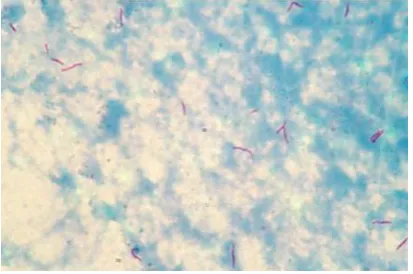
The images of the sputum smear are captured through the camera. This image is in RGB (Red, Green and Blue) form. Images were taken using a ZEISS iLED microscope and NIKON D3100 digital camera. The pixel resolution was 3456×2304. The images were stored in JPEG file format, with 24 bits per pixel, in color. The dataset was collected from the Ziehl-Neelsen Sputum smear Microscopy image DataBase(ZNSM-iDB) in Indira Gandhi Medical College, Shimla. An example image for ZN-stained sputum smear image as shown in Figure 2.
B. Image Preprocessing
Image pre-processing step was been perform in order to reduce the image information to be analyzed as it
would be an extremely slow and very
computationally expensive for matlab to process the whole image as it is originally given by the camera.
All unnecessary information such as the object of no interest are removed. After implementing this task the images were also resized to 300×400 according to the large image dimensions so that to be easily fitted and processed.
were used for enhancing the Ziehl-Neelsen Stained image Decorrelation Stretching, Gaussian filter and contrast stretching respectively. ZN- Stained image has more complex ground detail, so that the object (TB Bacteria) must be separated by the ground before identifiable.
For that reason the Decorrelation Stretching was used to increase color separation of an image significantly in the multi-channel image. This way increase the visual original color is charted to a new set of color value with a wider range[8] after that the Gaussian filter was implemented to diminish the effects of camera noise and spurious pixel value also it was used to reduce the sputum smear image details, furthermore it proposed as preprocessing stage in our computers vision algorithm in order to enhance the image structure at different scales. Finally the contrast stretching was used to improve the contrast in an image without distorting relative level of intensities [21].
Figure 2. Example ZN-stained sputum smear image
C. Color Image Segmentation and Bacilli Detection The ZN-stained bacillli are reddish in colour on a blue background. Therefore colour features may be useful to distinguish TB bacilli in ZN-sputum images. So that the colour image segmentation had been used. The segmentation of ZN-stained image was implemented in two stage. The figure 3 below illustrate the two stages.
1) Color image processing: The color image segmentation began with conversion the RGB image to another color model. Depending on the staining procedure the TB bacilli assume different colors may vary from light fuchsia to purple so that there were different types of color spaces used in color image segmentation for sputum smear images.
Figure 3. Illustrate segmentation stage
L*A*B and HSV color space were the frequently chosen color space for color image segmentation. The proposed method was converted the RGB enhanced image to the LAB color space when the background of enhanced image was off-white to identify different colors in the image so to be easily segmented in next stage, otherwise the image was converted to HSV color space.
2) Segmentation: Segmentation is an important step in image processing which aids extraction of information and attributes from images for image understanding and interpretation. The distinct characteristics of ZN-stained sputum smears, which contain red bacilli against a blue and off-white background present a useful property that can be exploited for segmentation of bacilli.
and corresponding cluster.
The algorithm for K-means clustering:
1. Pick center of K cluster, either randomly or based on some heuristic.
2. Assign each pixel in the image to the cluster that minimize the distance between the pixel and the cluster centre.
3. Assign compute the cluster centers by arranging all of the pixels in the cluster. Repeat 2 and 3 until convergence is attained.
D. Post processing stage
After completing the segmentation process, RGB image with black background and pink bacilli was obtained then it was converted to black and white to facilitate the feature extraction process, also the edge detection method was used to calculate the difference between the corresponding pixel intensities of black and white image for detection the image image edges. Region filling morphological operation was used to fill the area of edges that suppressed in previous step.
E. Bacilli feature extraction
After the segmentation step is finished not only the bacilli were segmented, different structure have appeared which have the same color properties as bacilli in conventional microscopy. The following feature descriptors were investigated to choose the best characteristics of TB bacilli and each of them were saved in format.mat, furthermore used as input features in the multi-support vector machine training process. The feature descriptors are Contrast, Correlation, Energy, Homogeneity, Mean, Standard_Deviation, Entropy, RMS, Variance, Smoothness, Kurtosis, Skewness, IDM. The features such as contrast, correlation, variance and homogeneity are calculated using the equation given below.
1) Contrast: Contrast is difference in visual properties that makes an object distinguishable from other objects and the background. Contrast is determined by the difference in the color and brightness of the object and other objects within the same field of view.
2) Inverse Difference Moment: This feature explains the smoothness of an image. The IDM is expected to be high if the gray levels of the pixel are similar. This measure relates inversely to the contrast measure.
3) Correlation: The gray level linear dependence between the pixels at the specified positions relative to each other.
4) Homogeneity: The closeness of distribution of elements in the GLCM to the GLCM diagonal and range=[0,1] is measured by homogeneity. Homogeneity is 1 for a diagonal GLCM.
F. Bacilli classification method
The proposed system was used a multi-support vector machine to identify TB bacilli in sputum smear image, which classified the thirteen computed features.
IV.
EXPERIMENTS AND RESULTS
The experiment is carried out by using different tuberculosis disease by implementing algorithms in Matlab platform.
1) Load Image and Resize: First the input image is resize by using matlab function imresize() with 300x400 pixel rates. The following figure 4 shows the resized original image.
Figure 4. Resized image
2) Contrast enhancement: In this preprocessing phase, the image is enhanced by converting rgb image into NTSC color space with mean adjustment. The figure 5 shows the contrast enhanced image.
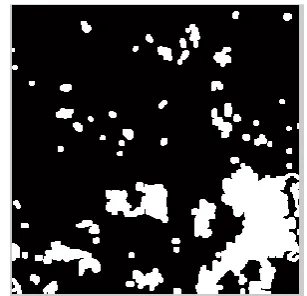
3) Segmentation: The segmentation was done by implementing K-means clustering algorithm with the k value of 3. The below figure(fig.6) demonstrate the segmented region of interest.
Figure 5. Contrast enhanced image
Figure 6. Segmented ROI
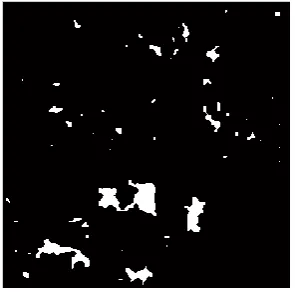
4) Post processing stage: After the segmentation process, the segmented image is converted to black and white image to facilitate the extraction of features. The figure 7 demonstrates the conversion of RGB into binary Image.
Figure 7. RGB to binary image conversion
The sobel edge detection method is used to detect edges for calculating the difference between the pixel intensities of the black and white image.
Figure 9. Cleared border image
And then morphological operation such as region filling with holes was performed in order to remove artifacts. The figure 12 illustrate the result of an image.
Figure 12. Result image
5) Feature extraction: The thirteen features were extracted from the resultant image as shown in Table 1. The datasets are grouped into four classes as shown in Table II. The features were extracted from the resultant image as shown in below Table.
Table 1. Features Extraction For Sample Image
S.no FEATURE NAME VALUE
1 CONTRAST 0.202512
2 CORRELATION 0.779510
3 ENERGY 0.764763
4 HOMOGENEITY 0.969571
5 MEAN 11.3519
6 STANDARD DEVIATION 33.2818
7 ENTROPY 1.44594
8 RMS 4.65699
9 VARIANCE 934.879
10 SMOOTHNESS 1
11 KURTOSIS 10.4149
12 SKEWNESS 2.92709
13 IDM 255
Table 2. Categories Of Bacilli
CATEGORY NUMBER
NAME OF THE CATEGORY
1 Overlapped TB Bacilli
2 Under-Stained TB Bacilli
3 Over-Stained TB Bacilli
4 Without Bacilli
6)Multi-Support Vector Classification Results Classification is the final stage of any image processing system where each unknown pattern is assigned to a category. The framework is developed in this paper for the classification of TB bacillus object and Non TB bacillus objects among four different classes is tested using a Acer Laptop, with 2.10 GHz Intel Pentium Processor and 2 GB of RAM. About 100 images were used as training images and the remaining ones as test images. TB bacillus objects are cropped from location that indicate with color there was TB bacilli.
Non TB bacillus are manually selected from sputum smear images. The accuracy is obtained for proposed system is more than 95%, which is better than existing system. The working principle of multi-SVM classification as shown in Figure 13.
V.
CONCLUSION
The accurately detection and classification of the tuberculosis disease detection is very important for the successful detection of tuberculosis and this can be done by using image processing. This paper discussed various techniques to segment the disease part of the tuberculosis. This paper also discussed thirteen Feature extraction and classification techniques to extract the features of infected tuberculosis and the classification of tuberculosis diseases in ZN-Stained Microscopic images. The use of m-SVM classification for identify and classify various tuberculosis disease using image processing techniques.
VI.
REFERENCES
[1]. VanDeun A, Salim AH, Cooreman E, Hossain MA, RemaA,etal,"Optimal Tuberculosis case detection by direct sputum smear microscopy: how much better is more?".Int J Tuber Lung Dis 6, (2002) , P 222-230 World Health Organization, Global Tuberculosis Report 2014. [2]. UNITAID, Tuberculosis: diagnostic, technology and market landscape. 2014, WHO: Geneva. p. 1–42.
[3]. Sputum Gram stain-Overview, University of
Maryland Medical Center
www.umm.edu/ency/article/ [4]. www.tbfacts.org/tb-tests
[5]. Biomedical image analysis book.
[6]. RonaldDendere, segmentation of candidate bacillus objects in images of ziehl-neelsen-stained sputum smears using deformable models, University of Cape Town February 2009.
[7]. https://en.wikipedia.org/wiki/Lab_color_space accessed on 3/5/2016
[8]. R.Gonzalez and R. Woods Digital Image Processing, Addison-Wesley Publishing Company, 1992.
[9]. Dong ping Tian, A Review on Image Feature Extraction and Representation Techniques,
International Journal of Multimedia and Ubiquitous Engineering Vol. 8, No. 4, July,2013.
[10]. M. Yang, K. Kpalma and J. Ronsin. "A survey of shape feature extraction techniques", Pattern Recognition, (2008), pp. 43-90.
[11]. Sawantet al., International Journal of Advanced Research in Computer Science and Software Engineering.
[12]. www.healthdiscoverycorp.com/svm.php [13]. Marzieh Ghiasi &Tripti Pande1 &
MadhukarPai , Advances in Tuberculosis Diagnostics.
[14]. Costa, M. G.F., Costa Filho, C. F. F., Sena, J. F., Salen, J. & Lima, M. O., Automatic identification of mycobacterium tuberculosis with conventional light microscopy, Proceedings of the 30th Annual International Conference of the IEEE EMBS,(2008), pp. 382- 385,Vancouver, British Columbia, Canada. [15]. Sadaphal, P, Rao, J., Comstock, G.W. & Beg,
M.F., Image processing techniques for identifying Mycobacterium tuberculosis in Ziehl-Neelsen stains. International Journal of Tuberculosis Lung Disease, (2008),Vol. 12, n. 5, pp. 579-582, ISSN 1027-3719.
[16]. Khutlang, R., Krishnan, S., Dendere, R., Whitelaw, A., Veropoulos, K., Learmonth, G. Douglas, T. S. (2010) , Classification of Mycobacterium tuberculosis in Images of ZN-Stained Sputum Smears, IEEE Trans InfTechnol Biomed. 2010 July; 14(4): 949–957. doi:10.1109/TITB.2009.2028339.
[17]. M. K. Osman , M. Y. Mashor, H. Jaafar , Detection of Tuberculosis Bacilli in Tissue Slide Images using HMLP Network Trained by Extreme Learning Machine ,electronics and electrical engineering , 2012. No. 4(120) , ISSN 1392-1215, T 125 .
Bacilli in Digitized Microscopic Images of Ziehl-Neelsen Stained Sputum Smear Samples.
[19]. Kusworo Adi1, RahmadGernowo,
ArisSugiharto , K. Sofjan F , Adi P , Ari B ,tuberculosis (TB) identification in the zihel-nelseen sputum sample in NTSC channel and support vector machine (SVM) classification , International Journal of Innovative Research in Science, Engineering and Technology ,Vol. 2, Issue 9, September 2013 , ISSN: 2319-8753. [20]. Rachna H.B., M.S.MallikarjunaSwamy
,detection of tuberculosis bacilli using image processing techniques ,international journal of soft computing and engineering .issn:2231-2307,volume-3,issue-4 ,September 2013.
[21]. JadhavMukti , Kale K.V , analysis of ZN-stained
sputum smear enhanced images for
identification of mycobacterium tuberculosis bacilli cells ,international journal of computer applications,vol.23 , no.5 , June 2011.