The Resource-Infrastructure-Environment Index for Measuring Progress:
An Application to Australia, Mexico and the US
Riccardo Natoli*
Financial Education Research Unit School of Accounting & Finance
Victoria University
300 Flinders Street, Melbourne, VIC, Australia Segu Zuhair
School of Accounting & Finance Victoria University
300 Flinders Street, Melbourne, VIC, Australia
ABSTRACT
The resource-infrastructure-environment (RIE) index was proposed as an alternative measure of progress which was then employed to: (a) compare the aggregate (single summary) index findings between Australia (mid-industrialised nation), Mexico (emerging economy), and the US (highly industrialised nation); and (b) compare the RIE index against the gross domestic product (GDP), human development index (HDI) and genuine savings (GS) measure. This paper builds on the previous work by assessing the seven themes and 21 dimensions which comprise the RIE index for the three aforementioned nations, as well as the associated policy implications. The results identified Australia’s strength in the human resource and infrastructure themes. For Mexico, strong contributions came from the natural and generated resource themes as well as the physical environment theme, while the US performed strongly in the infrastructure themes. The comparative results of the US and Mexico illustrated that it is possible to achieve high levels of progress without an excessive reliance on high levels of production and income.
Keywords: Measurement, Progress, Interdisciplinary, Weighting
* Riccardo Natoli (corresponding author) Email: [email protected] Ph: +61 3 9919 1522
1 Introduction
It has been said that when social science borrows a word from ordinary language, it takes time to settle on an agreed way of using it. A case in point is the use of the word rent in economics. The term progress is no exception. In mainstream economics, it has been defined as a term which involves an abundance of resources and material well-being possessing monetary or exchange value.1 This definition sought to collectively group income-generating assets. Such a narrow conception however, has proved to be increasingly problematic as demonstrated by the creation of a number of alternative progress measures. Consequently, the term has constantly evolved to a point where it now can also confer the property of welfare and well-being.
Increasingly, progress measures have incorporated both social and economic aspects into their evaluation (Soubbotina, 2004).2 Thus, progress is defined as the process of making advancements, within the limits of mankind’s knowledge, in the social, economic and environmental spheres, which echoes the sentiments of the HDI with its notions of social and economic progress. As a response to this need for an alternative measure of progress, the resource-infrastructure-environment (RIE) index was developed by Natoli (2008). The purpose of the current paper is to extend the previous work by Natoli and Zuhair (2011) which employed the use of the RIE index. Specifically, this involved the comparison of:
(a) the aggregate (single summary) index findings between Australia (mid-industrialised nation), Mexico (emerging economy), and the US (highly industrialised nation); and (b) the RIE index against the gross domestic product (GDP), human development index (HDI) and the genuine savings (GS) measure.
This paper adds to the initial empirical results by assessing the seven themes and 21 dimensions which comprise the RIE index for the three nations, as well as identifying the policy implications arising from the results. The RIE framework divides progress into three key areas:
1
Alfred Marshall, who articulated neoclassical economics in the late 1870’s, shifted the discourse of economics from the cause to the mechanics of wealth creation. The real economy, according to this concept, creates wealth by producing goods and services, which confer material well-being. Well-being is conferred by the flow of income and the stock, or capital, of material things and measured by utility.
2
1) Resources: comprises the machines, workers, money, land, raw materials and other things that a country can use to produce goods and services to make its economy grow (World Bank [WB] 2005).
2) Infrastructure: involves the basic facilities, services and installations needed for the functioning of a community or society. It includes roads, railways, canals, ports, airports and communications, and is manifested by its network structure, for instance, the road or rail network (Banister and Berechman 2000).
3) Environment: comprises the complex set of physical, geographic, biological, social, cultural and political conditions that surround an individual or organism and that ultimately determine the form and nature of its survival (WB 2005).
Each of the three key areas outlined above can be broken down into themes and dimensions which form the basis of the RIE index. This paper adopts a non-monetary approach to convert the themes and dimensions into usable and understandable information.
The RIE index is important as it serves to highlight the deficiencies (hidden limitations) of the traditional market based approaches to progress measurement. Further, the RIE index intends to more accurately reflect the state of a nation’s progress and provide a foundation for an alternative approach to progress measurement. The proposed progress index is designed to not only incorporate empirical applications, but to detect the meaningful underlying dimensions contributing to national progress to provide guidance in articulating policies for optimal use of resources. This will facilitate informed, balanced debate and lead to favourable outcomes.
Since this paper builds on a previous Social Indicators Research article, a very brief outline of the valuation approach, the established framework, justification of the treatment of data, and weighting technique is provided.3 This is followed by an assessment of the dimensions and themes of the RIE index for Australia, Mexico and the US. Finally, the conclusions are discussed.
2 A Non-monetary Approach to Progress Measurement
3 To facilitate a greater understanding of the RIE index, a comprehensive presentation and justification of the
The RIE index adopts a non-monetary approach to measuring progress. Its usefulness as a progress measure of progress is demonstrated via recent measures such as the happy planet index (HPI) developed by the new economics foundation (Marks et al. 2006) and the gross national happiness (GNH) initiated by the Centre for Bhutan Studies (2004) which all adopt a similar approach. This approach moves away from the acquisition of goods as a measure of affluence, to a concept that is truly reflective of the production value of the society we live in.
In fact, McGillivray (2005) states that the non-monetary approach employed by the HDI, the most prominent non-monetary progress measure, allows it to recognise a number of nations that have performed well in excess of what its economic status would imply. This is an important outcome if one views progress as being more than merely economic.
Empirically, the association between income and subjective measures of well-being has also been questioned. The seminal work of Easterlin (1974, and more recently 1995, 2001) as well as Oswald (1997), Frey and Stutzer (2000) and Blanchflower and Oswald (2004), found that the positive effects of extra income on quality of life are relatively small.
From a macroeconomic perspective, the current reliance by economists of equating progress in terms of a nation’s GDP (monetary measure) implicitly devalues the importance of factors such as natural capital (NC), unpaid work, knowledge and health (Cobb, Goodman and Wackernagel 1999), as well as social capital (SC) (Grootaert 1998).4 It also fails to distinguish economic activities that contribute to progress from those like crime and pollution that detract from it.
Despite the fact that measuring progress is fraught with difficulties, there is scope to construct measures that are a lot more informative and effective than those currently relied on for informing policy actions. The need for better measures is acknowledged (OECD 2007).
3 Establishing the Resource-Infrastructure-Environment Framework
Although the explicit identification of a rigorous conceptual framework is considered essential when developing a composite indicator (Freudenberg 2003), the conceptual framework presented in this paper will not encompass a detailed discussion. Instead, the focus of this paper is to demonstrate the application of the RIE index.
The multidimensional nature of progress suggests that a number of different theories or explanations are required to accurately capture the concept. The RIE index adopts an
4
interdisciplinary approach that is similar to the ‘overdetermination’ approach proposed by Wolff and Resnick but used in a different context.5
Adopting an interdisciplinary approach allows the RIE index to accommodate a diverse set of interconnected theories related to progress, of which the most pertinent of these different theoretical approaches were chosen for integration into the RIE framework. They are: resources, capabilities, intellectual capital (IC), environmental sustainability, social capital (SC) and institutions. These approaches have emerged in various fields from mainstream welfare economics to heterodox economics and all share interdisciplinary characteristics, which allow the inclusion of a mixture of inputs and processes; outputs and outcomes; and stocks and flows.
The RIE framework modifies and builds on Maskell and Malmberg’s (1999) framework which examines how firms locate and build their competitiveness via a regional analysis. This structure recognises that variations in resource endowments, infrastructure, technology, laws, attitudes and behaviours, institutions, environment, etc. all impact on the types of progress opportunities that can arise. The modifications to Maskell and Malmberg’s framework involved a change from a firm level regional analysis to a country-based analysis as well as including possible international effects. Given this, the localised capabilities consist of a country’s infrastructure and built environment; accessible natural resources; specific institutional endowment; and available knowledge and skills.
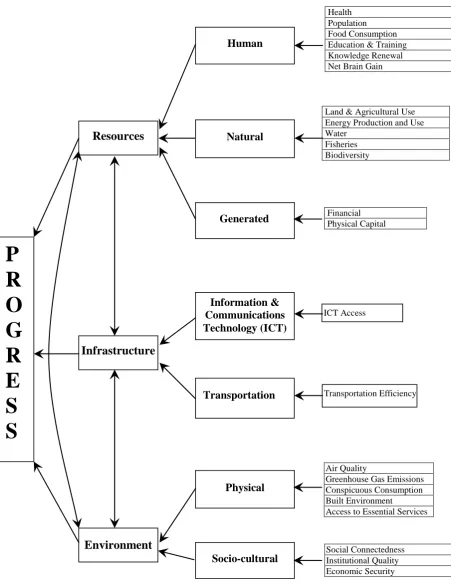
The RIE framework is split into three areas, which comprise a country’s resources, infrastructure, and environment. The interdisciplinary approach means that any given theme can overlap with one or more other themes and exhibit multiple relations with others in the form of simple causation or a varying degree of complex interactions. The structure of the framework incorporates the three main areas which will then be broken into themes and dimensions. In all, there are seven themes and 23 dimensions. Table 1 defines the hierarchy of the RIE framework.
Insert Table 1 here
The three identified areas (resources, infrastructure and environment) are then divided into their respective themes. For example, resources are divided into three themes: human, natural
5 Wolff and Resnick (1987) adopt Althusser’s concept of overdetermination regarding social formation. The term
and generated. These themes are then subdivided into dimensions.6 The dimensions are considered the fundamental building blocks of the RIE index. The conceptual framework is presented in Figure 1 and lists the areas, themes and dimensions of the RIE.
Insert Figure 1 here
4 Data normalisation and the weighting technique
The intention of the RIE index is to reward countries that perform well in dimensions considered highly important to progress, rather than reward average scores across all the indicators. Hence, a standardised (z-score) normalisation procedure to transform the data was employed. This approach calculates the average value and the standard deviation across countries and is widely used in CIs (Saisana and Tarantola 2002; Freudenberg 2003; Nardo et al. 2005b). Any bias introduced by this approach will be corrected by adopting a suitable differential weighting scheme, which gives greater weight to dimensions that possess greater theoretical or evidence based importance to the issue at hand, and aggregation method (Nardo et al. 2005a). Given that all variables do not automatically increase progress, a number of variables underwent a ‘reverse’ transformation.
The differential weighting scheme adopted is based on a survey developed by the Canadian Policy Research Network (CPRN), which involves extensive citizen participation in identifying priorities for Quality of life Indicators. In 2001, Michalski reported on the individual questionnaire responses on the importance of factors contributing to quality of life in Canada (n = 342). Twenty-two factors were ranked on a scale from 1 (not important) to 7 (extremely important). Rankings were done prior to and following a public dialogue process (Michalski 2001). From this, a weighting allocation system was devised.
The next step was to assign scores to the factors that reflected the proportional differences. Under this, the factor with the lowest proportion was assigned 1 and the factor with the highest proportion was assigned 10. The scores of the dimensions were then computed from the scores assigned to the factors. The weights of the dimension were standardised to fit a [1, 10] scale.
6 A detailed justification of the themes and dimensions of the RIE index can be found in Natoli (2008) and Natoli
The RIE index is applied to three countries representative of different clusters. The three countries are Australia (mid-industrialised nation), Mexico (emerging economy) and the US (highly industrialised nation). The choice of Mexico was partly due to their association with the OECD, which would minimise data collection issues. The next section assesses the areas, themes and dimensions in the RIE index. The analysis coincides with one of the goals of the comprehensive RIE framework, which is its ability to communicate information about specific dimensions (individual components). To provide a consistent overview of the application of the RIE index, the periods 1990, 1993, 1996, 2000 and 2004 were selected for assessment. Initially the RIE dimensions will be assessed. The first dimension that is reviewed is the human resource dimension.
5 Assessing the RIE Dimensions
The indices for the dimensions were calculated as described above. From these the theme contributions (Ti) were calculated as a summation of the standardised score for the jth
dimension of the ith theme (dij) as follows:
23 ,..., 1
, =
=
∑
d jT
j ij i
The RIE indices for the ith country (Ri,, i=1,2,3) is then calculated as a sum of theme
contributions as follows:
7 ,..., 1
, =
=
∑
T jR
j ij i
Tables 2 through 8 present the standardised scores for the seven themes and the corresponding dimensions. Each table is followed by an explanation of the trends within and between countries.
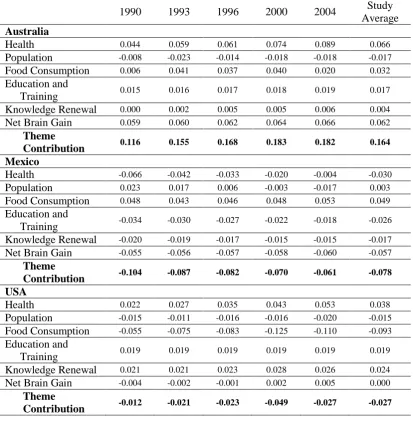
5.1 Human Resource Theme Dimensions
human resource theme. The food consumption results on the other hand are varied although always positive, with the period 1993 to 2000 producing quite strong results.
Insert Table 2 here
The analysis of the education dimension was restricted due to the break in classification at the UNESCO Institute for Statistics, which was a source of data. Although no trend can be detected, the results show that over the study period education in Australia has been a solid contributor to the human resource theme, increasing from 0.015 to 0.019, with an average of 0.017. The results of the next dimension, knowledge renewal (0.000 to 0.006) shows it as a minor yet growing factor for both human resources and progress. The low results are indicative of what is an emerging field, especially over the time period (1990-2004).
The final dimension of this theme, net brain gain, acts as a very strong contributor to Australia’s human resources, where up until 2000 it is the biggest contributor. Although the data is limited to within the OECD itself, the results reflect the fact that Australia has benefited greatly from this dimension (0.059 to 0.066), implying it is a net brain gain country.
The health dimension results for Mexico show that at no stage does the dimension, in isolation, contribute positively to progress (-0.066 to -0.004). In absolute terms though, the improvements made by Mexico over the entire period are the largest, and act as a major catalyst for the increase in the human resource theme. From a population perspective, despite
decreases for each trend period Mexico experiences the highest regeneration (0.023 to -0.017). By 2004, all three countries exhibit similar index scores, although, on average, Mexico’s contribution is the only positive one (0.003). Mexico’s strongest performance in the human resource theme occurs with the food consumption dimension displaying a consistently high trend (0.048 to 0.053).
The US health dimension results comprise its strongest contribution to the human resource theme with solid improvements made over the period (0.022 to 0.053), and a study average of 0.038. The population dimension results reflect low levels of human resource stock regeneration. After an initial improvement, the dimension declines to a point that is lower than the original observation (-0.015 to -0.020). The next dimension, food consumption, is easily the worst performed US human resource dimension (-0.055 to -0.110), with an average score of -0.093 that is reflective of very poor eating habits. The implications of this result will be discussed shortly.
The results of the education dimension show that a consistently strong (uniform 0.019) contribution is recorded. As expected, the US leads the knowledge renewal dimension (0.021 to 0.026). In fact, it is second only to health insofar as being the biggest positive contributor to the human resource theme.
Finally, the US figures for the net brain gain dimension indicate a slight increase (-0.004 to 0.005), although on average there is no impact on progress. This result is reflective of the data being confined to OECD transfers only, hence excluding tertiary educated immigrants from South Asia and other areas, as well as the strong results of Australia. Following is some general discussion of the human resource theme results.
The results of the six dimensions indicate that Mexico is clearly the worst performer in the human resource theme, particularly in the health and education dimensions which performed poorly, indicated by their study averages of -0.030 and -0.026 respectively. These dimensions therefore need to be prioritised by policymakers. This conclusion, despite not being able to be ascertained from examining the GDP, or the GPI measure which omits HC, is not overly insightful. A more interesting outcome from the human resource theme involves the food consumption dimension.
tendency for health measures to reflect death status, rather than quality of life.7 The life expectancy variable thus does not reflect the growing concern of the ‘obesity epidemic’ – as it has been termed in Australia and the US. Yet its employment by the HDI as one of its three variables to arrive at an HDI value shows that the RIEindex is preferable as it is able to shed more light on issues pertinent to progress and provide guidance in articulating policies for optimal use of resources.
The strong performances of Australia from the net brain gain dimension, with a study average score of 0.062, could be linked to the contribution of migrants to the skills base of Australia. This result further reinforces the usefulness of the RIE index which has the ability for certain dimensions to complement other dimensions. For example, the education dimension on its own shows a strong contribution to Australia’s progress. This may lead policymakers to adopt a ‘status quo’ approach. However, in the light of the net brain gain dimension results, policymakers would be able to identify necessary structural improvements to the education sector by adopting a long-term approach to reduce Australia’s reliance on tertiary-educated immigrant workers.
Of course, one may argue that since the RIE index associates a net brain gain with higher levels of progress, does it matter whether a nation, Australia in this case, continues to rely on skilled immigrant workers given that the end result is still an increase in progress? From the outset, the current paper has acknowledged that the proposed RIE index is not the solution, rather a step forward. Therefore, a similar or revised future measure may want to place a cap or limit on the net brain gain dimension, where anything exceeding a critical cut off value starts to detract from progress.
5.2 Natural Resource Theme Dimensions
The trends for the natural resource dimensions are presented in Table 3. The Australian land and agricultural use (LAU) results lag behind the other two countries and display the lowest study average (-0.018). Up until 2000, Australia experienced consistent improvements followed by a marked deterioration thereafter (0.003 to -0.024). Another poor performance for Australia comes from the energy and production use (EPU) dimension, with a study average of -0.021. Here, Australia recedes throughout the period signalling continued unsustainable levels of non-renewable energy production and consumption (-0.007 to -0.045). In fact, this
7
deterioration is similar for all three countries. Although the next dimension, water, suffers from limited data with respect to both its coverage and reliability, some general trends can still be identified. The results suggest that Australia’s water availability and quality improves over the entire observation period even though a slight deterioration occurs from 1993 onwards (0.043 to 0.037), making it Australia’s strongest contributor to the natural resource theme.
The trend for the fisheries dimension indicates a worsening situation over the entire period (0.015 to -0.003) with deterioration in each trend period. However, it does display an average positive contribution (0.007) over the study period. Although contested, the results of the dimension biodiversity seem to reflect expectations with all three countries’ performances worsening. Specifically, the Australian biodiversity results (-0.005 to -0.040) act as a significant negative contributor to both the natural resource theme and the RIEindex.
Insert Table 3 here
The Mexican LAU results are the strongest performing (0.020 to 0.055) of the three countries with consistent increases over the period and a strong positive contribution to the natural resource theme, proved by its 0.038 study average score. The EPU dimension figures however, despite a positive average score (0.009) become progressively worse culminating in a negative contribution in 2000 (0.023 to -0.004), before a marginal improvement for 2004 (0.001). Not surprisingly, Mexico’s water situation is its worst performer in the natural resource theme with an overall deterioration (-0.021 to -0.028). This is in contrast to the fisheries dimension which makes up Mexico’s strongest contribution to the theme, with an average score of 0.063, and an increase realised in every trend period (0.045 to 0.079). In real terms, the final dimension, biodiversity, declines significantly (0.033 to 0.003) even though it is the only country in the study to show a positive average score (0.018).
To a lesser extent this is also true for the fisheries dimension, where improvement occurs over the period (-0.060 to -0.033). However, it remains the poorest performing dimension in the natural resource theme with an average score of -0.046. The biodiversity dimension steadily worsens (-0.028 to -0.051) and its average score of -0.041 is second only to fisheries. Both dimensions represent a considerable negative contribution to the US’s natural resource theme. Following are some general discussion of the natural resource theme results.
Given that the LAU dimension results seem to reflect expected results, this helps justify the decision taken by the present study to include irrigated land as a positive contribution to progress. Although consideration was given regarding the water intensive nature of this practice, irrigated land was viewed as a conduit to food access. Additionally, any negative aspects pertaining to this would be reflected in the water and biodiversity dimensions.
The EPU results reflect a desire to reward sustainable practices, such as an increased reliance on renewable energy and lower energy consumption levels rather than efficiency alone. Thus, policies need to limit their damage to the environment. Focusing on increased efficiency ignores the fact that harm to the environment can continue to escalate. Given this, the results are not unusual. The water dimension results could have worsened because of the recent droughts, however.
The biodiversity results, where all three countries experience deterioration, highlight the need for a biodiversity component to be included in progress measures. The GPI, an influential progress measure, omits this dimension due to the incredible difficulties associated with placing a monetary value on the concept. Although this is understandable, it also serves to highlight the limitations of monetary measures of progress. Especially when one considers that many elements of progress, such as the majority of the human resource theme, the physical environment, the socio-cultural environment, and many aspects of natural resources, lack a readily identifiable and convenient price for evaluation purposes, at least at a conceptual level.
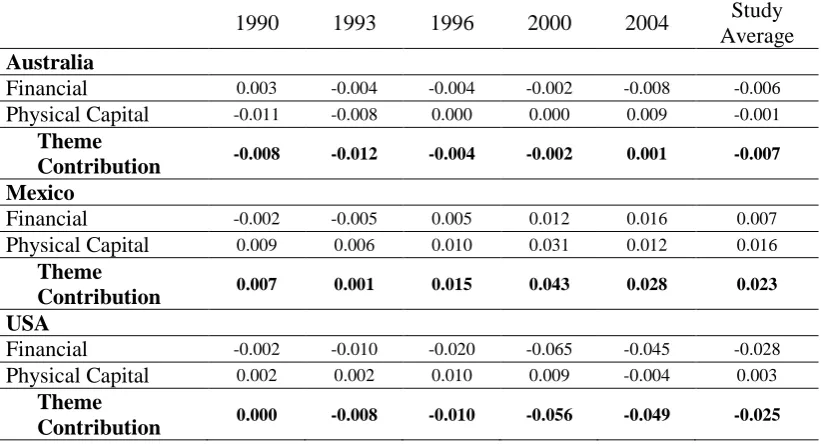
5.3 Generated Resource Theme Dimensions
The trends for the generated resource dimensions are presented in Table 4 below.
Insert Table 4 here
Australia’s performance in the financial resources dimension shows that initially Australia is the best performer (0.003). However, this performance deteriorated fairly rapidly till 2004, with a slight improvement between 1996 and 2000. This unfavourable trend resulted in a study period average of -0.006. This result is contrary to the GDP which suggests that the Australian economy is performing strongly. This apparent counter-intuitive result will be discussed below. The physical capital dimension for Australia undergoes dramatic improvement over the observation period (-0.011 to 0.009) with an average score of -0.001.
Another seemingly counter-intuitive result arises with Mexico’s performance from 1996 onwards in the financial resource dimension. Over the period Mexico improves from -0.002 to 0.016 finishing with a 0.007 average score, the highest of the three countries. Although the implications of this result will be discussed shortly, the current paper would like to reiterate that the RIE index was established to reward financial resources in relation to progress rather than its accumulation per se. The physical capital dimension results show Mexico outperforming the other two countries on average (0.016), with a consistent positive result over the period (0.009 to 0.012) with the exception of 2000 which rises to 0.031.
Apart from 1990, the US performance in the financial resource dimension lags quite a distance behind the other two countries (-0.002 to -0.045), with its worst result arriving in 2000 (-0.065) for an average study score of -0.028. The physical capital dimension produces consistent positive contributions up until 2000 (0.002 to 0.009). However, a noticeable decline occurs in the final period (0.009 to -0.004), even though the average contribution is still positive (0.003). Following are some general discussion of the generated resource theme results.
to the definition of progress. Consequently, financial resources attributable to high levels of stock market trading and market capitalisation are incongruous to progress.
This is another example where the RIE index distinguishes itself from most other measures. The comparative measures (GDP, HDI and GS) do not deduct for any form of finance, thus viewing all forms of finance as beneficial to progress. The GPI on the other hand, alludes to issues of illusory progress versus real progress and discounts certain types of consumption as a result. The RIEindex takes this a step further through its use of an allocated weighting system based on public opinion, which requires a paradigm shift, where the concept of value becomes disconnected from exchange-value or money.
One possible explanation for the physical capital dimension results, which had Mexico gaining the most from a progress standpoint, could be reflective of the historical place of their economic system. For instance nations in the maturity phase, such as Australia and the US, are less likely to experience gains in progress from physical capital proxied by machinery and equipment as opposed to emerging economies such as Mexico. This is partly reflected in the 2000 result for Mexico which experiences a vast increase due to a significant jump in gross fixed capital formation expenditure; a factor less likely to occur in established economies. Perhaps, this could also be explained by the diminishing marginal returns on investment.
5.4 ICT Infrastructure Theme Dimension
The trend for the ICT infrastructure dimension is presented in Table 5 below.
Insert Table 5 here
The results for the ICT theme appear to be relatively straightforward and quite unambiguous. Australia posts positive results which increases over the entire period (0.005 to 0.027), averaging 0.015. The Mexican results however, which averages -0.021 over the study period, place it a clear and distant last. In fact, Mexico does not seem to be making any advancement in this dimension despite a gradual increase over the period (-0.023 to -0.017). The US, as expected, is a clear leader, experiencing strong increases over the entire period (0.018 to 0.039), with the highest average contribution (0.028).
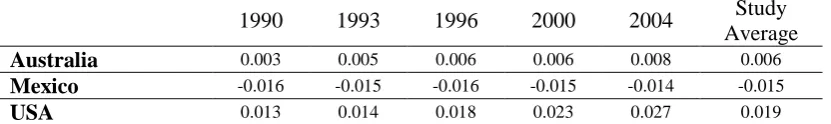
5.5 Transport Infrastructure Theme Dimension
Insert Table 6 here
Similar to the ICT access results, the transportation efficiency results appear to be relatively straightforward. Australia experiences a gradual, but continually positive result (0.003 to 0.008) averaging 0.006. The Mexican results seem to indicate little comparative advancement is being made in this dimension with a trend that is relatively flat (-0.016 to -0.014). The US again performs strongly with an infrastructure-based dimension, averaging 0.019 with steady increases over the period (0.013 to 0.027).
The results for Mexico in both the ICT access and transport efficiency dimensions indicate that policymakers should target the infrastructure area. Although this revelation may seem obvious, it nevertheless demonstrates that: (i) the RIE index is capable of identifying such a glaring structural weakness, and (ii) this type of observation, although seemingly apparent, is not capable of being highlighted by measures such as the GDP, GS, HDI and the HPI.
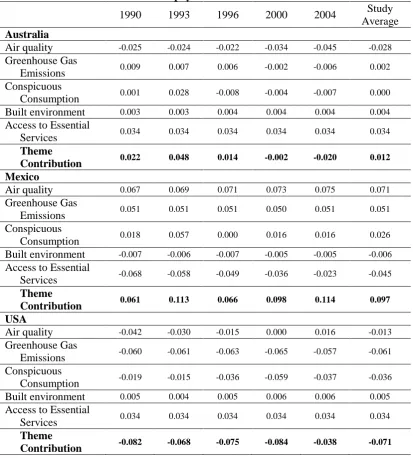
5.6 Physical Environment Theme Dimension
The trends for the physical environment dimensions are presented in Table 7. The table shows that Australia’s performance in the air quality dimension deteriorates over the period (-0.025 to -0.045). It also signifies the largest negative contributor to the physical environment theme and the only negative study average result (-0.028). The result of greenhouse gas emissions is also not encouraging, with every period signalling deterioration (0.009 to -0.006), although it does register a slight positive average score (0.002). From 1993 onwards, Australia experiences higher levels of conspicuous consumption, specifically from post-1993 (0.028 to -0.007), which mirrors the deterioration in the first two dimensions.
The results of the built environment dimension are a positive contributor to Australia’s physical environment theme (0.003 to 0.004), where little variation occurs over the time period. The final dimension, access to essential services provides limited analysis on trends given that the data for Australia and the US are capped with 100 per cent coverage. Suffice to say, it is the strongest contributor to the theme averaging 0.034.
results for Mexico tend to fluctuate with an initial increase (0.018 to 0.057) before a marked decrease in the period 1993 to 1996 (0.057 to 0.000) followed by another increase before steadying for the period 2000 to 2004, though it is still though a strong contributor to progress with an average score of 0.026.
Insert Table 7 here
The built environment dimension however detracts from Mexico’s physical environment theme, with consistent negative results for the entire time period (-0.007 to -0.005). The final dimension, access to essential services, is easily the worst performing dimension in the physical environment theme, averaging -0.045. Although advances occur over the period (-0.068 to -0.023), further improvement is still needed.
The air quality dimension, despite its -0.013 average score, undergoes a marked improvement for the US. In fact, by 1996 it surpasses Australia. Although the results commence negatively, by 2000 neutrality is reached and continues to improve (-0.042 to 0.016). However, the improvement by the US in air quality is not mirrored with the dimension greenhouse gas emissions. This constitutes the US’s worst performance in the physical environment theme, demonstrated by its average score of -0.061, with little if any real improvement occurring (-0.060 to -0.057). However, there are slightly encouraging signs from the period 2000 to 2004. Nonetheless, strict policies to combat and reduce these emissions are needed. With conspicuous consumption, the US average score is -0.036, the only country to have a negative result. A note of interest arises with the results for the period 1996 to 2004. Here, a spike occurs from 1996 to 2000 (-0.036 to -0.059), which is its peak year before almost returning to the 1996 figure by the final year.
The built environment dimension results make it a positive contributor to this theme, although little variation in trend over the time period exists (0.005 to 0.006). And finally, as with the reasons outlined for Australia, the US results for the access to essential services dimension are a uniform 0.034. This marks its strongest positive contribution to the natural resource theme. Following are some general discussion of the physical environment theme results.
The increased level in ‘defensive expenditures’, part of conspicuous consumption, for the same period (2000 to 2004) is reflective of increased US government expenditure post-September 11. However, the results suggest that no significant overall effect occurred. In fact, the overall improvement reflects the approach taken by the present paper to assign positive values to the final consumption expenditure variable. Therefore, the rates of increase in the final consumption expenditure variable seemingly outstripped defensive expenditure rates.
This also occurs with Mexico, which experienced a decrease in conspicuous consumption during the period 1993 to 1996 due to increases in the final consumption expenditure variable. This seems to mirror the financial crisis in Mexico where citizens were spending a greater part of their income on goods and services. Hence, a future revised measure may need to determine a critical cut off value for the final consumption expenditure variable, and treat any breaches as detracting from progress. Despite this possible refinement, the general trend of this dimension is, at a minimum, intuitively meaningful given that the US experienced the highest levels followed by Australia and then Mexico. This suggests that the variables representing conspicuous consumption in the RIE index seem suitable as a basis for further assessment.
As with the previous dimension section, the RIE index is able to capture the growing concerns for progress as opposed to the GDP or the HDI which do not have provision for this. Additionally, the RIEindex more accurately captures this concept compared to the GS which undervalues the effect due to its monetary valuation based on a weak sustainability approach.
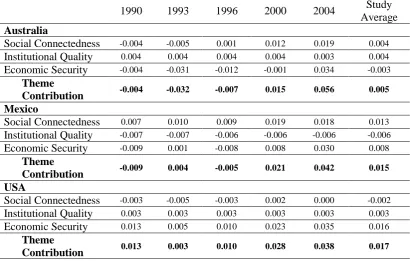
5.7 Socio-cultural Environment Theme Dimension
The trends for the socio-cultural environment dimensions are presented in Table 8 below. The social connectedness dimension result for Australia increases over the observation period (-0.004 to 0.019) however its growth is not gradual, as it worsens initially before increasing. The 0.004 average score demonstrate this. The institutional quality dimension results produce a solid and consistent positive increase (0.004 to 0.003), while the results of the final dimension of the RIE index, economic security, are more interesting. The Australian results take a sharp dip by 1993 (-0.004 to -0.031) then slowly recover before increasing for the rest of the period with a significant increase from 2000 to 2004 (-0.001 to 0.034), ending with an average score of -0.003. This possible counter-intuitive result will be discussed below.
Mexico’s social connectedness dimension results show the highest average score of the three countries with 0.013. In fact, Mexico shows an overall increase (0.007 to 0.018) although this stabilises in the last period. The institutional quality results show a steady but negative contribution to the socio-cultural environment theme (-0.007 to -0.006) reflective of their relative poor quality. The economic security dimension results average 0.008, however the periodic outcomes tend to fluctuate. For instance, there is an initial increase, followed by a drop in the period from 1993 to 1996 (0.001 to -0.008), before a recovery for the rest of the period (-0.008 to 0.030).
The US social connectedness results show little variation over the entire period (-0.003 to 0.000), reflected in an average score of -0.002. The negative outcomes for the US do not seem to be counter-intuitive given that the dimension includes aspects such as divorce and prisoner rates, where the latter would seem fit for a policy shift. Not surprisingly, the institutional quality dimension results for the US are consistently positive (uniform 0.003). And finally, the results of the economic security dimension are the strongest on average, with 0.016. This dimension displays an initial decrease before increasing for the rest of the period to exhibit an overall marked increase (0.013 to 0.035). It also represents the US’s most significant contributor to the socio-cultural environment theme. Following is some general discussion of the socio-cultural environment theme results.
Although Mexico produced strong results in the social connectedness dimension, it may have been undervalued given the absence of an indicator which accounts for informal networks. From the US standpoint, the result lends support to Putnam’s (2000) findings in Bowling Alone, which demonstrated that higher wage levels do not necessarily translate to greater social connectedness, but rather less.8
The most interesting aspect arising from the socio-cultural environment theme involves the economic security dimension results for Australia. The sharp deterioration for Australia in 1993 seems to be reflective of the recession in the late 1980s to the early 1990s, which is associated with lower levels of economic security (higher unemployment). Similarly, the deterioration experienced by Mexico in 1996 could be partially explained by the financial crisis of 1994. This is supported by the fact that Australia displays a significant increase from the period 2000 to 2004 at a time when the economy is performing strongly and unemployment is quite low. Additionally, another factor may be the variable overwork hours which fluctuated throughout the observation period.
8
Another reason for this seemingly counter-intuitive result where Mexico outperformed Australia, may stem more from the focus of the dimension namely, economic security. The economic security dimension attempts to provide an indication of people’s access to or command over resources, as well as acting as a gauge for power relations in the society, reflected by the characteristics unemployment and financial pressures. The Australian social security system, which allows its citizens to remain unemployed for longer periods while still receiving payment, is viewed as a reason for the very high number of long-term unemployed.9 Thus, a possible explanation for the counter-intuitive result emerges.
Consequently, even though the payments provide a level of economic security (hence the term social security payments), this is not reflective of the RIE framework approach. Rather, individuals who are unemployed and reliant on government payments have limited command over the resources while belonging to a system reliant on the government. Hence, power relations shift further away from the citizen. This more accurately reflects the intent of this dimension and is why the results appear counter-intuitive at first glance. From a policy perspective, the long-term unemployed need a work-based government payment to encourage the unemployed into the workforce, increase their skill base and eventually find work elsewhere. The additional benefits include being able to function at the societal level and a greater subjective feeling of well-being.
Aside from the GPI, the variables employed by the GDP, HDI and GS do not account for the social contribution to progress. This represents a sizeable omission for any progress measurement given the increasing recognition this theme has attained. The inclusion of Bourdieu’s power relations differentiates this measure from most other SC studies which adopt a Putnam framework. It also, more pertinently, differentiates itself from the GPI’s attempt at measuring the social aspects of progress. Although the economic security dimension of the RIE index may seem to adopt an individualistic approach (contrary to the collectivist approach favoured throughout), this is just one of the many complexities involved in the SC field (which is a combination of individual and collectivist attributes).
Having assessed the RIE index from a dimension standpoint, the paper will now aggregate upwards to investigate the RIE index at the theme level.
9 This is reflected in a South Australian parliamentary report assessing long-term unemployment and income
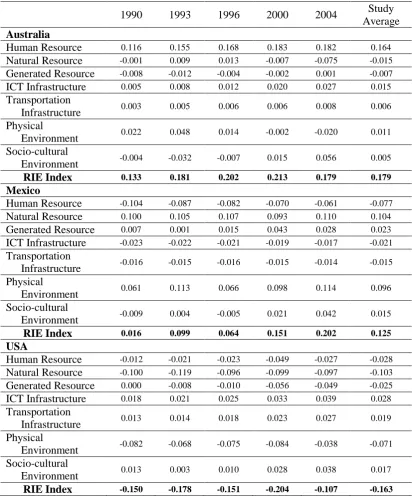
6 Assessing the RIE Themes
Table 9 presents the trends for the seven RIE themes and enables the current study to explain these trends within and between nations. Australia displays quite strong results in the human resource theme and far in advance of either Mexico or the US. Australia experiences strong overall growth from 1990 to 2000 (0.116 to 0.183) before stabilising in the period 2000 to 2004 (0.183 to 0.182). This is reflective of the superior results obtained in the health and net brain gain dimensions. Not surprisingly this theme is Australia’s biggest positive contributor to progress. The next theme, natural resources shows an improvement for the first half of the period (-0.001 to 0.013). However, it then deteriorates, particularly the period 2000 to 2004 where a significant decline occurs (-0.007 to -0.075). This is due to worsening performances in the land and agricultural use, energy production use and biodiversity dimensions. The final resource theme generated resources experienced an initial decrease that placed it behind the US, however it then experiences steady improvement (-0.008 to 0.001) over the period.
Insert Table 9 here
The themes, ICT and transportation each consist of only one dimension. Consequently, the results are identical to their dimension results discussed previously, which show solid positive contributions. The physical environment results for Australia start off with a noticeable improvement (0.022 to 0.048) before experiencing a sizeable drop in the remaining periods (0.048 to -0.020). This decline is strongly linked to the worsening rates of the air quality, greenhouse gas emissions and conspicuous consumption dimensions.
Given that the institutional quality dimension results are fairly stable for all three countries over the specified time period, fluctuations in the socio-cultural environment theme can be narrowed to changes in the social connectedness and economic security dimensions.
The results for Australia initially worsen (-0.004 to -0.032) due to the economic security dimension, before showing marked improvement for the rest of the period (-0.032 to 0.056) due to increases in the aforementioned themes. During the final two periods, the socio-cultural environment is one of the strongest contributors to Australia’s overall progress.
despite a decrease in 1996 it is, along with the physical environment theme, Mexico’s strongest contributor to overall progress. The generated resource theme results are quite varied with an initial decrease, then increasing before decreasing again in the final period; however the overall trend is upward (0.007 to 0.028). On average, it constitutes Mexico’s third highest contributor to progress. The ICT and transportation infrastructure themes, apart from the human resource theme, contribute most to lowering overall progress. Hence, Mexico’s infrastructure is an area that is potentially responsive to government policy initiatives and thus should be high on the agenda of policymakers.
With the physical environment theme, Mexico’s results are varied with an increase (0.061 to 0.113), followed by a decrease (0.113 to 0.066), and then a steady increase (0.066 to 0.114), constituting its second strongest theme and contributor to Mexico’s overall progress score. Finally, the results from the socio-cultural environment exhibit some fluctuation, with an initial increase followed by a decrease (which mirrors the economic security dimension) before significant increases for the rest of the period. Overall, a positive trend emerges (-0.009 to 0.042). This is also a strong contributor to progress.
The US performance for human resources poses the most interest as it is the only one that deteriorates over the period (-0.012 to -0.027), albeit slightly. This is reflective of the deteriorating results in the food consumption dimension. The natural resource results are quite poor (-0.100 to -0.097). After initially worsening, outcomes improve, but then remain steady from 1996 onwards. For the next theme, the US results (0.000 to -0.049) suggest that, in comparison to Australia and Mexico, the generated resources theme contributes the least to progress.
The performances in the ICT and transportation themes are consistent strong contributor to overall progress. Conversely, the physical environment theme detracts from overall progress. Generally, there is an improvement in the theme although marked variations occur from period to period. Specifically, worsening greenhouse gas emissions and higher conspicuous consumption rates offset improvements in air quality. However when all three dimensions improve, as occurred in the period 2000 to 2004, the theme undergoes a significant improvement (-0.084 to -0.038). The US’s performance in the socio-cultural theme is a positive one, despite a drop in the initial period, with an overall increase for the period (0.013 to 0.038). It constitutes a solid contributor to progress. Following is some general discussion of the RIE theme results.
the US average score of -0.028 is of most interest. The major discussion point centres on the impact that the US food consumption results have on its overall human resource index. It would seem that the large values of this dimension are obscuring the fact that the US performs rather adequately in the rest of the human resource dimensions. However, the food consumption dimension value is commensurate and reflective of the value obtained via a citizen participation survey.
The natural resource theme results suggest that Australia and the US, with average study scores of -0.015 and -0.103 respectively, need to address environmental concerns. The physical environment theme results show that Australia, with an average study score of 0.011, needs to work more diligently in reducing air pollutants and reducing wasteful consumption. This applies even more to the US, which averages -0.071 despite improvements made in the air quality dimension.
A final point of discussion involves Mexico. Despite Mexico clearly outperforming Australia and the US in the natural resource and physical environment themes, it was not until 2004 that Mexico finished highest in the standardised RIEindex. This is noteworthy because this result allows the RIEindex to be presented in a different light from other comprehensive approaches to progress, such as the HPI which is centred on the environment.
Although beneficial environmental outcomes are undoubtedly crucial for progress, as this present paper acknowledges, it should not necessarily usurp bad, or good, performances by concealing other critical areas. For Mexico, this equates to poor human resource performances, reflected in its average score of -0.077 due to the health, education and net brain gain dimensions; as well as poor study average infrastructure results with ICT (-0.021) and transportation (-0.015).
From a country perspective, the results for Australia suggest that the most important contributors to progress are its human resource and infrastructure themes, with improvements required in the areas of natural resource and physical environment. The Mexican results show, for the most part, strong contributions in the social and environmental category, while health, education and infrastructure dimensions need development. The results for the US identify infrastructure as a solid contributor to progress, however concerns occur in the environmental and social aspects of progress.
7 Policy implications arising from the RIE
The proposed framework allows policymakers to prioritise policy initiatives via the weighted scheme employed (public opinion). This enables countries to apply unique sets of priorities at different levels of the economy as well as in different sectors resulting in fine tuning of resource allocation. For instance, even though both Mexico and Australia need more effective policies relating to the environment, their priority levels, as adjudged by their respective standardised scores, vary.
Consequently, the environment becomes a greater immediate policy priority for Australia than Mexico. Thus, the RIE framework, which links policies to progress, ensures that policies are determined on the basis of their degree of contribution to a nation’s overall progress, rather than on any single issue.
For Australia, the greatest potential for policy intervention lies in the area of the environment. Policies need to consider: natural resource protection (instituting a greater number of preservation places); limits on harvesting renewable resources (ensuring farmers adopt less environmentally damaging farming techniques); and strict policies to combat and reduce high pollutant emissions while increasing the use of renewable energy sources.
Other policy considerations for Australia include a long-term focus on education to reduce the reliance on foreign-born tertiary educated workers filling the current skill shortage. One alternative is to improve domestic tertiary completion rates and reduce the rate of school leavers in upper-secondary level. The low population growth rate also needs to be addressed. Currently, policies with a financial incentive (child support scheme) are in place to improve this; however this situation needs to be monitored to prevent this evolving into a perverse incentive.
Finally, another policy initiative which could lift Australia’s level of progress, involves reducing the barriers to entry in the workforce for the long-term unemployed. Specifically, the social welfare scheme should include strong incentives for the recipients to be productive thereby reducing the disincentive to work. This would promote a sense of empowerment and a greater subjective feeling of wellbeing.
citizens). Additionally, policies need to be implemented to prevent brain drain and to improve opportunities for the tertiary qualified workforce. This may involve providing incentives to complete tertiary qualifications.
Further, improvement is required on the infrastructure dimensions: transportation and ICT, and also the built environment dimension. This may require enhanced technological transfers from abroad (via an easing of barriers to foreign direct investment) and a general strengthening of investor confidence.
Contrary to current trends in giving priority to the environment towards attaining progress, the results for Mexico’s RIE index prescribes a higher priority in the areas of health and access to resources. This ability to differentiate the level of policy concern between nations is an important feature of the RIE framework.
The final dimension for policy consideration for Mexico is institutional quality. The current low outcome could be improved via policies that focus on greater protection of political and civil liberty, and curtailment of corruption. While the current climate is one of democracy and relative freedom there is a responsibility to ensure that such a climate continues.
Despite traditional health status indicators suggesting otherwise, a major policy concern arising from the US, according to the RIE index, centres on the food consumption dimension. Consequently, the government should consider placing tighter regulations on the “fast food” industry as well as undertaking an educational campaign to promote healthy diets and regulate the food industry to provide full product disclosure.
The environment is also a major policy concern for the US, where policy initiatives need to consider: natural resource protection (instituting a greater number of preservation places), limits on harvesting renewable resources (ensuring farmers adopt less environmentally damaging farming techniques), and tighter controls in the fisheries industry.
The low population growth rates in the US may require similar policy initiatives to Australia (child support scheme) to help increase the growth rate to an appropriate level. The RIE index also identifies the social connectedness dimension as a noteworthy barrier to progress. Specifically, this deals with high divorce rates and abnormally large prisoner numbers. Overcoming this may require greater family support policies by the government to reduce breakdowns (such as improved working conditions and tax breaks). As Cummins et al. (2001) state, feeling connected to one’s family is a vital part of any measure of wellbeing.
greater notions of progress. The results of the RIEindex (regarding convicted adults) suggest that the current US practice of continual expenditure increases on the prison system is not producing the desired results. Acknowledging this opens the possibility for alternative solutions such as introducing policies that prioritise rehabilitation over punishment. A similar argument regarding the utility of expenditures can be made regarding security expenditure. A relevant question is: Do increases in security expenditure reflect a society that is better or worse off?
The RIE index was intended to reflect the complexity of the progress concept; hence trade-offs became a feature of the index. These trade-offs are also reflected in the policy implications, for instance investment in educational quality. Although most policymakers understand that greater investment in this segment should benefit Australia, this analysis alone is not sufficient. It also needs to monitor the number of skilled migrants, something that the cohesive RIE framework allows. Consequently it can provide guidance in articulating policies for optimal use of resources.
In the policy summary above, two categories have been deliberately omitted: financial resources and conspicuous consumption. This is because changes to these categories require a fundamental shift in values rather than direct policy intervention.
The strength of the RIE index is that it can help identify areas where such changes would be most effective. For too long, governments have implemented policies that have not been measured against their worth to progress but rather their contribution to GDP – a widely held de facto measure of progress. If the GDP increased, then policy prescriptions were seen to be working since the GDP assumes that all production is beneficial. In contrast, the RIE index, via its comprehensive framework which specifies dimensions that add and detract from progress, abandons this misguided practice.
The RIE framework does, however, suffer from its inability to accommodate long term sustainability aspects of resources. The current formulation of RIE is biased towards human development and does tend to ignore other aspects of development to some extent. However, with the employment of an allocated weighting scheme, policymakers are better able to prioritise policy initiatives based on its contribution to overall progress as opposed to making policy decisions in a vacuum. Consequently, the RIE index can help facilitate a shift in value by refocusing government priorities away from market based economic growth.
The comprehensive nature of the RIE index enabled the present paper to conduct an assessment of the dimensions and themes contributing to progress. This assessment was undertaken via the standardised RIE index. The results confirmed Australia’s strength in the human resource theme and infrastructure area with improvement needed in the following themes: natural resource, generated resource and physical environment. The socio-cultural environment started poorly but by the end of the period became a strong contributor. For Mexico, strong contributions came from the natural and generated resource themes as well as the physical environment theme. Areas of concern include the human resource theme and infrastructure area. The socio-cultural environment followed a similar pattern to Australia with a strong contribution in the later stages. The US results identified the infrastructure area and the socio-cultural environment theme as solid contributors to progress. However, much improvement is required in the resources area (human, natural and generated) and the physical environment theme. The comparative results of the US and Mexico illustrated that it is possible to achieve high levels of progress without an excessive reliance on high levels of production and income.
References
Australian Bureau of Statistics (ABS). (2002). Measuring Australia’s progress 2002, cat. no. 1370.0. Canberra: ABS.
Australian Bureau of Statistics (ABS). (2004). Measures of Australia’s progress, 2004, cat no. 1370.0. Canberra: ABS.
Australian Bureau of Statistics (ABS). (2006). Measures of Australia’s progress 2006, cat. no. 1370.0. Canberra: ABS.
Banister, D., & Berechman, J. (2000). Transport investment and economic development. London: UCL Press.
Blanchflower, D. G., & Oswald, A .J. (2004). Well-being over time in Britain and the USA. Journal of Public Economics, 88 (7-8), 1359-1386.
Centre for Bhutan Studies. (2004). Gross national happiness and development. In K Ura & K Galay (eds), Bhutan: The Centre for Bhutan Studies.
Cobb, C. W., Goodman, G. S., & Wackernagel, M. (1999). Why bigger isn’t better: The genuine progress indicator – 1999 update. San Francisco: Redefining Progress.
Cummins, R. A. et al. 2001, ‘The Australian Unity Wellbeing Index: Survey 1 Report 1’, June 2001, Australian Centre on Quality of Life, Deakin University.
Easterlin, R. A. (1974). Does economic growth improve the human lot? Some empirical evidence. In P. A. David & M. W. Reder (eds), Nations and households in economic growth: Essays in honor of Moses Abramowitz (pp. 89-125). New York: Academic Press.
Easterlin, R. A. (1995). Will raising the incomes of all increase the happiness of all? Journal of Economic Behavior and Organization, 27(1), 35-47.
Easterlin, R. A. (2001). Income and Happiness: Towards a Unified Theory. The Economic Journal, 111(473), 465-484.
Freudenberg, M. (2003). Composite indicators of country performance: A critical assessment. OECD Science, Technology and Industry Working Paper 2003/16. Paris: OECD Directorate for Science, Technology and Industry.
Frey, B. S. & Stutzer, A. (2000). Happiness, economy and on stitutions. The Economic Journal, 110(466), 918-938.
Grootaert, C. (1998). Social capital: The missing link? Social capital initiative working paper no. 3. Washington, DC: World Bank.
Marks, N., Simms, A., Thompson, S., & Abdallah, S. (2006). The happy planet index: An index of human well-being and environmental impact. London: New Economics Foundation.
Maskell, P., & Malmberg, A. (1999). Localised learning and industrial competitiveness. Cambridge Journal of Economics, 23(2), 167-185.
McGillivray, M. (2005). Measuring non-economic well-being achievement. Review of Income and Wealth, 51(2), 337-364.
Michalski, J. H. (2001). Asking citizens what matters for quality of life in Canada: Results of CPRN’s public dialogue process. Ottawa: Canadian Policy Research Networks.
Nardo, M., Saisana, M., Saltelli, A., & Tarantola, S. (2005a). Tools for composite indicators building. EUR Report, EUR 21682, European Commission. Ispra: Joint Research Centre.
Nardo, M., Saisana, M., Saltelli, A., Tarantola, S., Hoffman, A., & Giovannini, E. (2005b). Handbook on constructing composite indicators: Methodology and user guide. OECD Statistics Working Papers STD/DOC (2005) 3. Paris: OECD.
Natoli, R., & Zuhair, S. (2010). Establishing the RIE index: a review of the components critical to progress measurement. International Journal of Social Economics, 37(7-8), 574-591.
Natoli, R., & Zuhair, S (2011). Measuring progress: A comparison of the GDP, HDI, GS and the RIE. Social Indicators Research, (forthcoming). DOI 10.10007/s11205-010-9695-3 Organisation for Economic Co-operation and Development (OECD). (2007). Measuring and
fostering the progress of societies. Second OECD World Forum on Statistics, Knowledge and Policy. 27-30 June, Istanbul, Turkey.
Oswald, A. J. (1997). Happiness and economic performance. The Economic Journal, 107(445), 1815-1831.
Putnam, R. D. (2000). Bowling alone: The collapse and revival of American community. New York: Simon & Schuster.
Saisana, M. & Tarantola, S. (2002). State-of-the-art report on current methodologies and practices for composite indicator development. EUR Report, EUR 20408 EN,European Commission. Ispra: Joint Research Centre.
Social Development Committee. (1995). Long-term unemployment and the adequacy of income support measures. Sixth report of the social development committee, South Australia: State Parliament.
Soubbotina, T. P. (2004). Beyond economic growth: An introduction to sustainable development. Washington, DC: World Bank.
Wolff, R. D., & Resnick, S. A. (1987). Economics: Marxian versus neoclassical. Baltimore: John Hopkins University Press.
Resources
Infrastructure
Environment
Human
Natural
Generated
Information & Communications Technology (ICT)
Transportation
Physical
Socio-cultural
P
R
O
G
R
E
S
S
Air Quality
Greenhouse Gas Emissions Conspicuous Consumption Built Environment
Access to Essential Services
Social Connectedness Institutional Quality Economic Security
Financial Physical Capital Land & Agricultural Use Energy Production and Use Water
Fisheries Biodiversity
Health Population Food Consumption Education & Training Knowledge Renewal Net Brain Gain
ICT Access
Transportation Efficiency
Table 1: The RIE framework building blocks
Hierarchy Rationale
Area (3) Main areas that interact with the each other to create or deplete progress.
Theme (7) Breaks the areas into more manageable parts. A main focus area of the framework.
Dimension (23) Parts of the theme that provide the specific performance criteria of the themes.
Table 2 Standardised scores for the human resource dimensions
1990 1993 1996 2000 2004 Study Average
Australia
Health 0.044 0.059 0.061 0.074 0.089 0.066 Population -0.008 -0.023 -0.014 -0.018 -0.018 -0.017 Food Consumption 0.006 0.041 0.037 0.040 0.020 0.032 Education and
Training 0.015 0.016 0.017 0.018 0.019 0.017 Knowledge Renewal 0.000 0.002 0.005 0.005 0.006 0.004 Net Brain Gain 0.059 0.060 0.062 0.064 0.066 0.062
Theme
Contribution 0.116 0.155 0.168 0.183 0.182 0.164
Mexico
Health -0.066 -0.042 -0.033 -0.020 -0.004 -0.030 Population 0.023 0.017 0.006 -0.003 -0.017 0.003 Food Consumption 0.048 0.043 0.046 0.048 0.053 0.049 Education and
Training -0.034 -0.030 -0.027 -0.022 -0.018 -0.026 Knowledge Renewal -0.020 -0.019 -0.017 -0.015 -0.015 -0.017 Net Brain Gain -0.055 -0.056 -0.057 -0.058 -0.060 -0.057
Theme
Contribution -0.104 -0.087 -0.082 -0.070 -0.061 -0.078
USA
Health 0.022 0.027 0.035 0.043 0.053 0.038 Population -0.015 -0.011 -0.016 -0.016 -0.020 -0.015 Food Consumption -0.055 -0.075 -0.083 -0.125 -0.110 -0.093 Education and
Training 0.019 0.019 0.019 0.019 0.019 0.019 Knowledge Renewal 0.021 0.021 0.023 0.028 0.026 0.024 Net Brain Gain -0.004 -0.002 -0.001 0.002 0.005 0.000
Theme
Table 3 Standardised scores for the natural resource dimensions
1990 1993 1996 2000 2004 Study Average
Australia
Land and
Agricultural Use -0.033 -0.026 -0.005 0.003 -0.024 -0.018 Energy and
Production Use -0.007 -0.008 -0.012 -0.025 -0.045 -0.021 Water 0.029 0.043 0.042 0.040 0.037 0.039 Fisheries 0.015 0.012 0.008 0.003 -0.003 0.007 Biodiversity -0.005 -0.012 -0.020 -0.028 -0.040 -0.022
Theme
Contribution -0.001 0.009 0.013 -0.007 -0.075 -0.015
Mexico
Land and
Agricultural Use 0.020 0.025 0.035 0.043 0.055 0.038 Energy and
Production Use 0.023 0.020 0.017 -0.004 0.001 0.009 Water -0.021 -0.021 -0.026 -0.027 -0.028 -0.025 Fisheries 0.045 0.054 0.060 0.071 0.079 0.063 Biodiversity 0.033 0.027 0.021 0.010 0.003 0.018
Theme
Contribution 0.100 0.105 0.107 0.093 0.110 0.103
USA
Land and
Agricultural Use 0.013 0.000 0.022 0.031 0.035 0.022 Energy and
Production Use -0.016 -0.019 -0.025 -0.039 -0.052 -0.031 Water -0.009 -0.009 -0.010 -0.005 0.004 -0.006 Fisheries -0.060 -0.057 -0.045 -0.040 -0.033 -0.046 Biodiversity -0.028 -0.034 -0.038 -0.046 -0.051 -0.041
Theme
Contribution -0.100 -0.119 -0.096 -0.099 -0.097 -0.102
Table 4 Standardised scores for the generated resource dimensions
1990 1993 1996 2000 2004 Study Average
Australia
Financial 0.003 -0.004 -0.004 -0.002 -0.008 -0.006 Physical Capital -0.011 -0.008 0.000 0.000 0.009 -0.001
Theme
Contribution -0.008 -0.012 -0.004 -0.002 0.001 -0.007
Mexico
Financial -0.002 -0.005 0.005 0.012 0.016 0.007 Physical Capital 0.009 0.006 0.010 0.031 0.012 0.016
Theme
Contribution 0.007 0.001 0.015 0.043 0.028 0.023
USA
Financial -0.002 -0.010 -0.020 -0.065 -0.045 -0.028 Physical Capital 0.002 0.002 0.010 0.009 -0.004 0.003
Theme
Table 5 Standardised scores for information and communication technology
(ICT) access
1990 1993 1996 2000 2004 Study Average
Australia 0.005 0.008 0.012 0.020 0.027 0.015
Mexico -0.023 -0.022 -0.021 -0.019 -0.017 -0.021
USA 0.018 0.021 0.025 0.033 0.039 0.028
Note: There is no theme contribution row since the ICT infrastructure theme is represented by only one dimension. Therefore, the standardised score is the theme contribution.
Table 6 Standardised scores for transport efficiency
1990 1993 1996 2000 2004 Study Average
Australia 0.003 0.005 0.006 0.006 0.008 0.006
Mexico -0.016 -0.015 -0.016 -0.015 -0.014 -0.015
USA 0.013 0.014 0.018 0.023 0.027 0.019
Table 7 Standardised scores for the physical environment dimensions
1990 1993 1996 2000 2004 Study Average
Australia
Air quality -0.025 -0.024 -0.022 -0.034 -0.045 -0.028 Greenhouse Gas
Emissions 0.009 0.007 0.006 -0.002 -0.006 0.002 Conspicuous
Consumption 0.001 0.028 -0.008 -0.004 -0.007 0.000 Built environment 0.003 0.003 0.004 0.004 0.004 0.004 Access to Essential
Services 0.034 0.034 0.034 0.034 0.034 0.034
Theme
Contribution 0.022 0.048 0.014 -0.002 -0.020 0.012
Mexico
Air quality 0.067 0.069 0.071 0.073 0.075 0.071 Greenhouse Gas
Emissions 0.051 0.051 0.051 0.050 0.051 0.051 Conspicuous
Consumption 0.018 0.057 0.000 0.016 0.016 0.026 Built environment -0.007 -0.006 -0.007 -0.005 -0.005 -0.006 Access to Essential
Services -0.068 -0.058 -0.049 -0.036 -0.023 -0.045
Theme
Contribution 0.061 0.113 0.066 0.098 0.114 0.097
USA
Air quality -0.042 -0.030 -0.015 0.000 0.016 -0.013 Greenhouse Gas
Emissions -0.060 -0.061 -0.063 -0.065 -0.057 -0.061 Conspicuous
Consumption -0.019 -0.015 -0.036 -0.059 -0.037 -0.036 Built environment 0.005 0.004 0.005 0.006 0.006 0.005 Access to Essential
Services 0.034 0.034 0.034 0.034 0.034 0.034
Theme
Table 8 Standardised scores for the socio-cultural environment dimensions
1990 1993 1996 2000 2004 Study Average
Australia
Social Connectedness -0.004 -0.005 0.001 0.012 0.019 0.004 Institutional Quality 0.004 0.004 0.004 0.004 0.003 0.004 Economic Security -0.004 -0.031 -0.012 -0.001 0.034 -0.003
Theme
Contribution -0.004 -0.032 -0.007 0.015 0.056 0.005
Mexico
Social Connectedness 0.007 0.010 0.009 0.019 0.018 0.013 Institutional Quality -0.007 -0.007 -0.006 -0.006 -0.006 -0.006 Economic Security -0.009 0.001 -0.008 0.008 0.030 0.008
Theme
Contribution -0.009 0.004 -0.005 0.021 0.042 0.015
USA
Social Connectedness -0.003 -0.005 -0.003 0.002 0.000 -0.002 Institutional Quality 0.003 0.003 0.003 0.003 0.003 0.003 Economic Security 0.013 0.005 0.010 0.023 0.035 0.016
Theme