Article
Spectrogram Analysis: An Approach to Identify
The Quadrotor Thrust Model
Igor H. B. Pizetta1,†, Alexandre S. Brand˜ao2,†,‡*, Tarc´ısio A. Pizziolo2,‡ and Mario
Sarcinelli-Filho 3
1 Federal Institute of Esp´ırito Santo; [email protected]
2 Federal University of Vi¸cosa; [email protected]
3 Federal University of Esp´ırito Santo; [email protected]
* Correspondence: [email protected]; Tel.: +55 31 3899 4105 † These authors contributed equally to this work.
‡ Current address: Av. P.H. Rolfs, sn, DEL Campus UFV, Vi¸cosa – MG, Brazil
Abstract: This paper deals with a non-contact method to identify the aerodynamic propeller
parameters of the Parrot AR.Drone quadrotor. The experimental set consists in a camera recording the vehicle flights, the audio signal is extracted and is used a spectrogram analysis to estimates the propeller velocity. First, the aerial vehicle takes off and starts a hovering maneuver. The experiment is repeated with different additional masses attached to its rigid body. If the weight over the UAV increases/decreases, then the propeller must rotates faster/slower to produce a higher/lower thrust, and consequently, the sound frequency increases/decreases. Finally, this proposition is validated experimentally, and the estimated velocity is used to identify the quadrotor thrust parameters.
Keywords: UAV; Low-level Model; Velocity Measurement; Spectrogram
1. Introduction
Recent advances in technology have generated a wide range of applications of Unmanned Aerial
Vehicles (UAV). Most of them are related to the the increasing computational power of embedded
systems and the improvement of sensors measurement. Rotorcraftnavigation is still a challenge, which
motivatesresearch groupsworldwidetodevelop autonomoussystems.
Nowadays, rotorcraft UAVs have been a great testbed, due to its three-dimensional mobility when
comparedwithgroundor otheraerialvehicles (airplanesand balloons,forinstance). Incontrast, such
UAVsare inherently unstable, non-linearand multi-variable systems, with complexand highly coupled
dynamics. Therefore, controlthemisanother challenge,whichstartsfrom a suitabledynamicmodel [1].
In our previous work [2], the quadrotor mathematical model, obtained by Euler-Lagrange equations,
has been represented as a cascade connection of four interconnected subsystems, which compose the
low- and high-level models. The low-level one represents the actuator model, which relates the input
signals, the internalPD control loop, the Electronic Speed Controller, the motor dynamics, its angular
velocity and the generated thrust. While the high-level one relates the rigid body dynamics, which
includesthethrustappliedontheUAVbodyanditsposeresponseasdisplacementon3-Dspace.
An autonomous flight requires reliable sensor information. For AR.Drone Parrot quadrotor, the
UAV used in this work, these information are available from a inertial measurement unity (IMU), an
ultrasoundsensorandabuilt-incamera.Then,afilteringalgorithmembeddedonitsfirmwareisresponsible
fordeterminingitsaltitude,attitude,linearandangularvelocities.Finally,thisUAVcanperformseveral
flighttasks,includingpathplanningandcollisionavoidance[3–5],butevenwithgoodsensorsquality,itis
necessaryareliablemodel,withtunedparameters,oncethenonlinearcontrollerdependsonit.
The whole parameter identification of a quadrotor requires input signal information, rotor-speed
values and 3-D pose during a non-constraint flight. For a rotor-speed estimation, one can use the
mathematical model of the propeller system, and then validate it with a tachometer sensor. In [6] an
identificationtechniquedeterminesthebrushlessDC-motorparametersofRChelicoptersandquadrotors.
Rotaryencoderandhallsensorsinformrespectivelytherotor-speedandtherequiredcurrent.Insuchaway,
thepropellervelocityisindirectlyestimated.
Spectral analysis, or spectrogram, is another way to estimate an angular velocity. Such method
avoids mechanical contact or the proximity needed by optical sensor and a specific equipment for
measurements,onlyamicrophone.Accordingto[7],thereisaproportionalrelationshipbetweentheaudio
frequencyand theangularfrequency.In sucha context,thepresent work aimsto estimatethepropeller
velocityofarotary-wingvehicle,theAR.DroneParrotquadrotor.However,inourapproach,theUAVflies
withoutconstraintsinanindoorenvironment.Asinglestationarymicrophoneinstalledinaroomcaptures
theacousticsignal,andwithspectrogramanalysisestimatestherotorspeed.Thus,thepropellersconstants
ofthe UAVmodelcan be determined.This method avoidserrorscaused by thetest platform,when the
vehicleisattachedtoit.Insuchacase,themeasurementsaredonebyforcesensors.
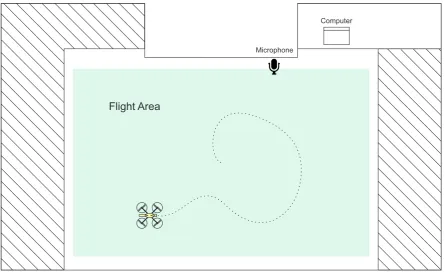
Figure1illustrates the top view of the room used in the experiments. The light color in the figure
shows the useful flight area for thequadrotor, the hatched line shows the forbidden zone (due to room
partialoccupation).Thecomputerislocatedinatablenearthewallandthemicrophoneisplaced2meters
aboveground,inthepositionillustrated,tocaptureallthesoundintheroom.Itimportanttostressthat,
evenastandardmicrophonecanmeasurethefrequencyandtheintensity,duetothehighintensitysound
producedbyUAV.
Computer
Microphone
Flight Area
Figure 1. Top view of room used in the experiments.
This paper is hereinafter split as follows: First, a brief state of the art on spectral analysis is
presented. In the sequel, the quadrotor dynamics model is introduced, emphasizing its rotary wing
dynamics (also called thrust model). The experimental setup is described, and the results are shown
and discussed. Finally, themain conclusions are highlighted and some suggestions for future works are
2. Spectrogram approach: State of the Art
The main advantage of spectral analysis to determine angular velocity is its non-contact approach.
Moreover, this method does not require proximity to the equipment, as usual in optical or magnetic
sensor applications. In contrast, the only restriction is the capture and interpretation of the sound
signalofthesourceofinterest.
The authors in [8] emphasize that a typical technique to measure the fundamental frequency of
rotary machines requires proximity probes or photo-sensors which can be hard task. In this work,
mechanical vibration and/or acoustic signals are used to exact the fundamental frequency of an
automotive passenger car. A Bayesian approachcombinesthe fundamentalfrequencyand itsharmonics
andprovidesa bettervelocityestimation.
In the aerial robotic perspective, spectrogram and sound processing can be used to identify acoustic
signatureandclassifymovingUAVs[9].Insuchacase,themicro-Dopplersignatureclassifieriscapableto
distinguishplanes,quadrocopter,helicoptersandstationaryrotors.Thepatternsofeachvehicleareextract
form their spectralsignature, and the classifier accuracy is around95%. Sonogram isapplied in [10], to
obtaintherelationshipbetween distance sound level iscorrelated, andthe sound profilein thepropeller
plane,fordistinctrotorvelocities.In[11],acollisionavoidancetechniqueisperformedbyacousticsignals,
similartoconventionalradars.Insuchacase,afixed-wingUAVisequippedwithasetoftwomicrophones
thatdetectsandavoidsothernearbyUAVs.
The spectrogram analysis is also applied in [12] to determine the altitude, velocity and/or
revolutionsperminuteofanaircraft,basedonastaticbeaconsignalrecorder(ground-basedmicrophone).
Inturn,theidentificationofUAVatlongdistanceistheproposalpresentedin[13].Dopplereffectestimates
thenumberofrevolutionsperminuteofthedronerotors,andthePlottedImageMachineLearning(PIL)
andK-NearestNeighbors(KNN)classifythem, basedonaveragedistancesimilarityofa presetsignature
data-base.Theidentificationaccuracyare83%and61%,respectively.In[14],acoaxialUAVcalledFlyper
helicopter,ismountedinaplatform,whereasetofmicrophonesrecordsitsacousticsignal.Then,therotor
speedsareestimatedwithoutanypriorknowledgeaboutitsacousticproperties.Theproposedmethodbased
on neural network and genetic algorithm could identify each rotor velocity, without being affected (or
corrupted)bytheother.
Another perspective is to use a microphone array in the quadrotor to use in missions as “search
andlocate”,or,soundsourcelocalizationasitiscalled[15,16].In[17],thethepotentialofusingtheacoustic
signatures for precision moving target detection and tracking. Four types of airplanes perform a set of
predefinedmaneuversoverthemicrophonearray,suchasapproaching,departing,turningleft,andturning
right. Then, spectrogram is performed to classify the airplanes and estimates its height, speed and
fundamentalfrequency.
Acoustic technologies have also become an important tool for solving problems of UAV swarn
navigation.In[18], thenoise emittedbythepropellers isused todetectand identifytheUAVpositions,
minimizing the mid-air collision risk. In a distinct way, when the UAV carries the microphone array,
anothersetofmissionscanbeperformed,suchas“findandrescue”ofhumansinadisastersituation,usinga
quicklyspeechrecognition[19,20].TheUAVego-noiseissuppressedtoemphasize,recognizeandlocalizethe
voicesignal(whichgenerallyoccupydifferenttime-frequencybins).
3. The Quadrotor Model
The complete model of a quadrotor can be represented by four interconnected subsystems [21],
as shown in Figure 2 and the reference systems and the propeller forces acting on it are shown in
Figure 3. The actuator dynamics is responsible for transformingthe servo inputs into rotor-speed. The
rotary wing dynamic relates the aerodynamic parameters to the thrust/propulsion. The force/torques
generationdecomposesthethrustintothe3-Dforces/torquesactuatingontheUAVrigidbody. Finally,the
rigidbodydynamicdescribestheaircraftdisplacementin theCartesian space.
A quadrotor is an aircraft comprising four rotors symmetrically distributed around a rigid body.
ucol
uped
ulat
ulon
QMR QT R
B A
TMT TT R
b1c b1s
f t x ˙ x h W Actuator Dynamics Rotary Wing Dynamics Torque and Forces Generation Rigid Body Dynamics
Figure 2. Block diagram of a quadrotor UAV.
Figure 3. 6-DOF CAD model of a quadrotor, including the reference frames and abstract control inputs (forcesfi) associated to it. The inertial, the spatial and the body reference frames are referred to ashei,hsiandhbi, respectively.
the propellers). The profile of the propeller, associated to its rotational speed, generates a normal
propulsion. As seen in Figure 3, the thrust points towards bz at the body reference frame, and is
alwayspositive.
For the AR.Drone Parrot quadrotor, the low-level system is responsible for its stabilization. In other words, an inner controller executes a hovering maneuver, whenever none control signal is sent to it. Thus, the first subsystem is the embedded low-level controller, composed by an inner control loop, normally a PD controller. Such block receives the joystick commands in the following order: pitch
angleθd,roll angleφd,yaw rate ψ˙d and vertical ratez˙d. Its output is the voltage increase applied to
the motors, given by
∆v1
∆v2
∆v3
∆v4
=
1 −1 1 1 1 1 −1 1
−1 1 1 1
−1 −1 −1 1
kdφφ˙˜+kpφφ˜
kdθθ˙˜+kpθθ˜
kdψψ¨˜+kpψψ˙˜
kdzz¨˜+kpzz˙˜
whereφ˜ =φd−φis the roll error. Similarly, we have the pitch errorθ˜,yaw rate error ψ˜ and vertical
rateerrorz˜.Noticethatkpiandkdiaretheproportionalandthederivativepositivegainsoftheembedded
lowlevelcontroller.
Remark1.Thecommandssentbythejoystick,ui,arenormalizedin±1.Thus,thedesiredvalueofroll,for
instance,isdeterminedbyφd=uφφmax,whereφmaxdefinesthemaximumscalevalue(thesameappliesforthe
otherlow-levelcontrolsignals).
Remark2.TheAR.Dronemotorsarenotalignedwithbxandbyaxes.Actually,theyareinadirectionthat
isdisplaced45◦ofsuchaxes.Thereby,toperformanylateralorlongitudinalmaneuveritisrequiredajoint actionofallengines,unlikeotheravailablequadrotors.
Forthesecondsubsystem,assumingthateachAR.DronebrushlessmotorismodeledlikeasabrushDC
one,onecandescribefrom[22,23]therelationshipamongtheinputvoltagev,theloadtorqueτlandtherotor
speedωas
RJm
km
d
dtω+
RBm
km
+kb
ω=v− R
rkmτl,
(2)
whereRrepresentstherotorresistance,kmandkbaremagneticfieldflowconstants,risthegearratio,andJm
andBmarethemomentofinertiaandadissipativetermsofthemotor.
Remark3. Therelationship betweenv andω representedin(2) isappliedtoeachmotor ofthe aircraft,
having v = vo+ ∆v, wherevois the voltage value correspondent toa hovering flight. In other words, vo representsthevoltagerequiredtocompensatetheownAR.Droneweightthroughthepropellers.
According to [23–26], the rotary wing dynamics (also called thrust model) can be written as
fi=Cfωi2, (3)
τli=Cτωi2 (4)
wherefiandτliarethethrustandloadtorquegeneratedbythei−thmotor.Moreover,Cfand
Cτ are the aerodynamic constants, which are dependent on the number, the width and the shape of
therotorblades,theinnerand outerradiusoftheairflowthroughtherotor,theairdensity,among other
phenomena.Theseparametersareconsideredasconstantsforrestrictedapplications,suchasnon-aggressive
maneuversandlowaltitudeflights,forinstance.
ThefocusofthisworkisidentifytheCfcoefficientusingspectrogramanalysis.Inthiscurrent
proposal,Cτestimationisnotconsidered,becauseitscomputationrequirestorquemeasurements,whichare
notavailableinourlab.
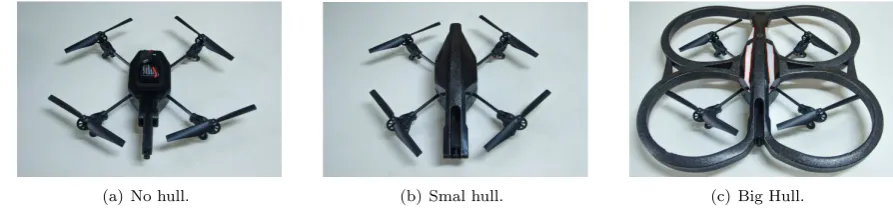
(a) No hull. (b) Smal hull. (c) Big Hull.
3 filtered subsets
Experiment
1º Trial
1º Set
2º Set
3º Set
4º Set
5º Set
2º Trial
1º Set
2º Set
3º Set
4º Set
5º Set
3º Trial
1º Set
2º Set
3º Set
4º Set
5º Set
4º Trial
1º Set
2º Set
3º Set
4º Set
5º Set
5º Trial
1º Set
2º Set
3º Set
4º Set
5º Set
Bandpass Filtering
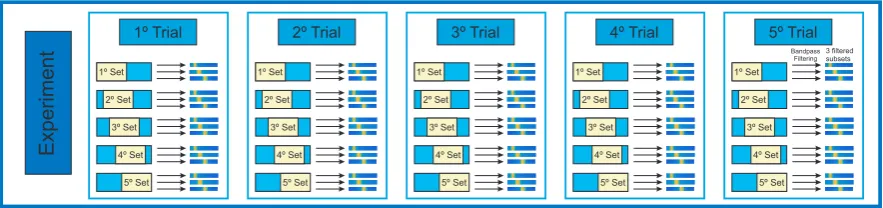
Figure 5. The schematic of a database for one experiment.
As comment the two first subsystems in Figure2 are commonly labeled Low-level Model. The
other two subsystems are the High-level Model, which describes the aircraft movement at the 3-D
space. Detailsaboutthecompletemodelcanbefoundin [27].
4. The ExperimentalSetup
A set of dynamic equations can describe the whole AR.Drone Parrot model (see [27]), i.e., a
representationthroughawhiteboxmodel.However,theparameteridentificationofeachsubsystemshown
in Figure2requirestheinputsignals,therotorspeeds,thethrustproducedbyeachpropellerandthe3-D
poseoftheUAV.Forthelow-levelmodel,aforcesensorcouldbeusedtorelatestraightforward
the inputsuiandthe thrustsfi.But, suchsensor iscommonlydedicated to specificapplicationof robotic
manipulators(forcefeedbackcontrolforweldingtasks,forinstance),besidesbeingnotavailableforusagein
manyresearchlaboratories.Hence,theobjectiveisestimatetherotorspeed,andthendetermineindirectly
thepropellerthrust.Inourapproach,spectrogramanalysisestimatestherotorspeed,wherethespectrogram
isobtainedby
STFT{x[n]}=
∞
∑
n=−∞
x[n]w[n−k]e−
j2πnk
N (5)
wherex[n]isthediscretesignal,w[n]isthediscretewindowfunctionand Nisthenumberofsamplesin
theanalysiswindow.
The sound signature is measured during flight, and then a relationship between the UAV plus
additionalload(thehoodsthatcamewithintheboxoftheArDroneParrot).Insuchaway,Cfcanbe
identifiedfrom(3)duringahoveringflight.
According to [7], the audio signature is represented by
N=60 ζ
n·r (6)
whereNistherevolutionperminute,nisthenumberofblades,andζistheaudiofrequency.Inourcase,n=
8,onceeachpropellerhastwoblades,andallofthemcontributesconstructivelytotheaudiosignature.For
theAR.DroneParrot,thepropellergearreductionris8.625.
The experiments took place in a regular laboratory with no concern about the acoustic
performance of the room, also, there was some background noise,as peopletalking outside and running
equipment,butitdoesnotaffecttheexperiments,sincetheanalyzedfrequencyrangeisdistinctfrommostof
theenvironmentnoise.Furthermore,thetechniqueusedisrobustagainstthesenoises.Theproposedmethod
considers that even a regular cameracan measure thedesired frequenciesand intensitiesto estimate the
aerodynamicconstants.SoalltheexperimentswasfilmedwithaNikond7000digitalcamera,andthenthe
audiowas extracted.Theonlycaution neededis toknow thefrequencyrangeof theequipment to better
In our proposal, the rotor speed varies according with the weigh. Maintaining the same altitude,
thecontrollerincreasesthecontrolsignalstocompensatetheextraweight.Thusthepropellersrotatefaster,
and, consequently thethrust along the z-axis increases, keeping the vehicle in the same altitude. Three
differentconfigurationsshowninFigure4areused:
Withoutany hull: totalweightof413g,with2000mAbattery;
Smallhull: withadditional31g thatyields442g,i.e. 7.5%ofitstotalmass;
Bighull: withadditional59g thatyields462g,i.e. 14.3%ofitstotalmass.
Althoughnotbeingdesignedforloadtransportation,thesewastheitemsdesignbythemanufacturer
thathasinanyoftheproductboxes.
Remark 4. According to the manufacturer, the main characteristics of the AR.Drone propellers are: 4
brushlessinrunnermotors;14.5wattand28,500rpminhoveringmode;self-lubricatingbronzebearings;low noiseNylatrongearsfor8.625propellerreduction;andspecifichighpropelleddragforgreatmaneuverability.
In order to achieve a good amount of data for estimation, three experiments was run for altitude
control (hovering task), where the vehicle should keep at an altitude of 1m height, with each hull
configuration.Eachexperimentwasrepeatedfivetimes,during10s.Eachexperimentrepetitioniscalleda
trial.Thetakeoffandthelandingmaneuverwereremovedfromtheoriginalaudio,oncethepartofinterest
isthehoveringtask.Foreachtrial,a newsetofsmallerexperimentsisobtainedbya rectangularwindow
with40%ofoverlap,totaling25samplesofapproximately5slong.
Two methods are proposed to estimate the mean velocity of the rotors. Both of them require
thefundamentalfrequency,itssecondandthirdharmonicstoestimatethepropellerspeed.So,three
band-passfiltersareapplied,creatingthreesubsets.Thereisnoneedtouseanarrowbandorahighorderfilter,it
only must contain the desired frequency.Figure 5 illustrates the database structure, highlighting the 75
availablesamplesperexperiment.
Maximum Trace and Gaussian approximation are proposed to estimate the Cf constant, as
describein thefollowingsubsection.
4.1. Maximum TraceMethod
For each one of the samples, Maximum Trace method consists in looking for the highest module
oftheFFTalongeachi-thtimeinstant,andidentifyitscorrespondentfrequency. Then,apply(6)to
obtainthevelocity. Ifonlythefundamentalfrequencyisconsidered,one canapply
¯
ζ= 1
n
n
∑
i=1ζi (7)
togetthefrequencyaverageζ¯,whereζiisi-thfrequency,foreachi-thtimeinstant,andnisthenumberof
observationsinthesample.Ifthefundamentalandthesecondandthirdharmonicsaretakenintoaccount,
thestandarddeviation
σζ=
s
1
n
n
∑
i=1|ζi−ζ¯| (8)
isalsorequiredforeachinterestfrequency.
Theweightedaverageconsistsintoimprovethevelocityestimationusingthefundamentalfrequency
and itsharmonics. Intheory, thefirst harmonichasthe double frequencyof thefundamental, hencethe
standarddeviationweightstheestimationandalsocompensatesanyuncertaintyorinaccuraciesofthe
cameramicrophone. Thus, thespeedestimationbecomes
¯
ζω =
2
∑
H=0
1
(H+1)2
∑n
i=1sζiζi
∑n
i=1sζi
(9)
whereζ¯ωistheweightedfrequencymean,Histhenumberoftheharmonic(0forthefundamental
frequency).Applying(6)and(3)withζ¯ω,onehasCf.
4.2. Gaussian ApproximationMethod
Thesecondmethodconsistsinnotonlyconsiderthehighestvaluesbutapercentageofthisvalue.For
example,the80%oftheuppervaluesarecollectedofeachoneofthethreefilters.Then,aGaussian
approximationgiven by
γ= 1
σ
√
2π
e−
ζ−ζ¯
2σ2 (10)
representseachi-thtimeinstant,whereζ¯ isthefrequencyaverageandGaussiancentroid.Oncemore,
applying(6)and(3),onecanestimateCf.
5. ExperimentalResults and Discussion
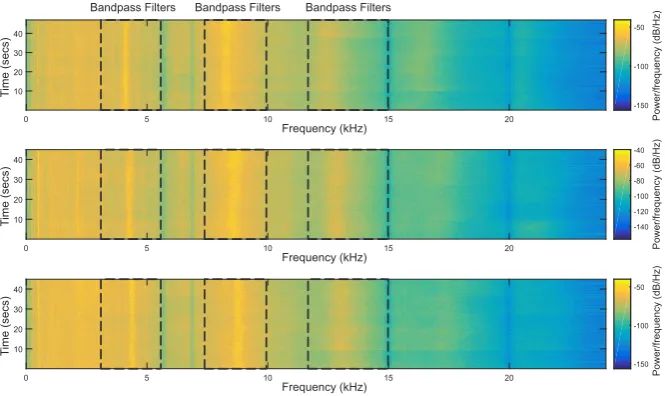
Three different experiments were run five times, each one for a distinct hull configuration, during
ahoveringtask.TheAR.Dronequadrotorfliesfreelyinthe3DCartesianspace,withitsaltitudecontrolled.
TheinnerPIDcontrolleroftheUAVguidesitslongitudinalandlateralmovements.Figure6illustratesthe
specrogramofeachexperiment.Noticethatallfivetrialswerejointedtocomputethespectralgraphandto
showitasafigure.
0 5 10 15 20
10 20 30 40 T ime (secs) -150 -100 -50 Power/frequency (dB/Hz)
0 5 10 15 20
10 20 30 40 T ime (secs) -140 -120 -100 -80 -60 -40 Power/frequency (dB/Hz)
0 5 10 15 20
Frequency (kHz) Frequency (kHz) Frequency (kHz) 10 20 30 40 T ime (secs) -150 -100 -50 Power/frequency (dB/Hz)
Bandpass Filters Bandpass Filters Bandpass Filters
Figure 6. Altitude Flight with no hull, small and big one, respectively.
Further, an attentive reader can see the slight difference among the trials. In the horizontal sense,
as theloadcarryingincreases,as thefrequencyshiftstotherightdirection, indicatinghighervalues.In
turn, in the verticalsense, for a preset frequency (fundamentalone or its harmonics),the values
remaincontainedinthesetdefinedbytheaverageζ¯andstandarddeviationσζalongthetime.
Figure7(a)illustrates the spectrogram of an experiment, while Figure7(b)highlights the filtering
Frequency (kHz)
Power/frequency (dB/Hz)
(a) Audio spectrum.
Frequency (kHz)
Power/frequency (dB/Hz)
(b) Filtered audio spectrum.
Figure 7. Spectrum highlighting the bandpass filters.
Applying the proposed Maximum Trace approach, one can identify the highest values of each time
window,asshowninFigure8forthefundamentalfrequency,forno-hullcase. Table1presentstheCf
averagevalue,aswelltheotherparameterusedtoestimateit.NoticethatCf=28.5180×10⁻⁴Ns2
istheaveragevalueforallsamplesofalltrials.
Frequency (Hz)
Power/frequency (dB/Hz)
x 104
Time (s)
Figure 8. Maximum Trace method.
Table 1. Measured velocity values and the calculatedCf with Maximum Trace Method.
Load [g] Total Mass
m[g]
Propeller Velocity
[103 rpm] STD [rpm]
Motor Angular
Velocityω[102rad/s] Cf [10
−4Ns2]
No Hull 413 3610.3438 44.4916 378.07 2.8315 Small Hull 442 3742.0275 48.3813 391.86 2.8336 Bug Hull 462 3820.1625 47.7473 400.05 2.8903
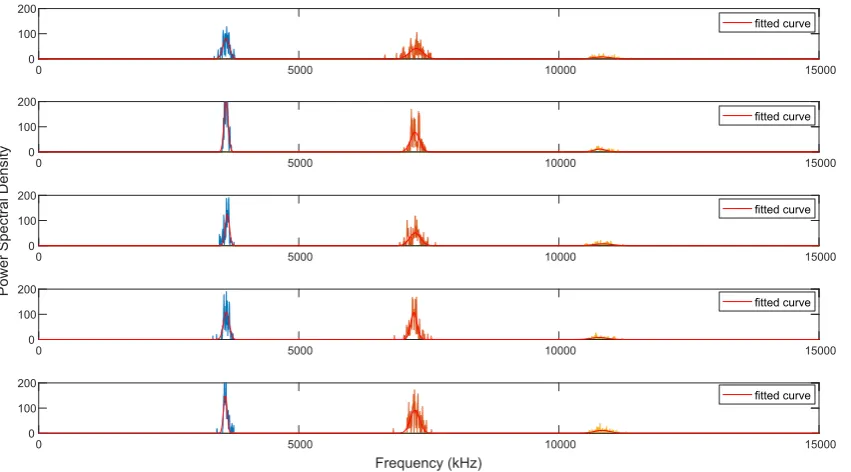
For Gaussian approximation method, after finding the amplitude peak in a time instant, the
frequencyanditsneighborvalueswithatleast80%aretakentodeterminetheGaussianparameters.Figure
9illustratesthetraceofthefundamentalfrequencyanditsharmonics,aswellthefittedGaussiancurve.
The estimated Cf with other other interesting values can be seen in Table2. The final value of
0 5000 10000 15000 0
100 200
Power Spectral Density
0 5000 10000 15000
Frequency (kHz)
0 100 200
0 5000 10000 15000
0 100 200
0 5000 10000 15000
0 100 200
0 5000 10000 15000
0 100 200
fitted curve
fitted curve
fitted curve
fitted curve
fitted curve
Figure 9. Approximation by Gaussian method.
Remark 5. From 50% to 90% of the highest frequency (peak in amplitude),Cf has negligible variations.
Table 2. Measured velocity values and the calculatedCf with Gaussian Method.
Load [g] Total Mass
m[g]
Propeller Velocity
[
103 rpm]Motor Angular
Velocityω [102 rad/s] Cf [10
−4Ns2]
No Hull 413 3608.1298 377.8425 2.8350
Small Hull 442 3740.0479 391.6569 2.8366
Bug Hull 462 3822.284 400.2686 2.8871
6. ConcludingRemarks
This work presents a non-contact method to identify the aerodynamic propeller constants of the
ParrotAR.Dronequadrotor.First,theexperimentsarefilmed,andthentheaudioisextracted.Inthesequel,
the spectrogram is performed, and the frequency profile is analyzed. The experimentsdemonstrate that
additionalmassesontheUAVrequiremorethrusttokeepthealtitudeonthepresetvalue.Thus,onecan
conclude that there is a direct relationship between the rotorspeed and the sound frequency. Such
assumptionisusedtodeterminesindirectlythepropelleraerodynamiccoefficient.
The aerodynamic constant Cf are dependent on the number, the width and the shape of the
rotor blades, the inner and outer radius of the airflow through the rotor, the air density, among other
phenomena.So,itisimportantasimplemethodofitsidentificationforthedevelopmentof thequadrotor
dynamicmodel.Inthispaper,MaximumTraceandtheGaussianapproximationmethod
getaerodynamicconstantwiththesameorderofmagnitude,Cf=28.5×10⁻⁴Ns2.Andisworth
rememberthatthisconstantwillbedifferentfromtheoneusedintheseexperiments,unlessthebladesare
thesameaswellastheatmosphericproperties.
Next steps of this research involve the whole identification of the AR.Drone low-level model. As
showninFigure2,therotorspeedcanbeusedtoidentifytheparametersofthemotorcontrollerandits
and relates the joystick inputs with the rotor speeds. However the challenge is to discriminate, from
thespectrogram,which acousticsignaturecorrespondto whichmotor.
Acknowledgments: The authors thank CNPq for financing this project. Dr. Sarcinelli-Filho also thanks the additionalfinancialsupportofFAPESthatsupportsscientificandtechnologicaldevelopment,totheproject.They alsothankFederalInstituteofEsp´ıritoSanto,Federal UniversityofVi¸cosaandFederalUniversityof Esp´ırito Santo,respectively,forsupportingtheir participationinthisresearch.Dr.Brand˜ao andDr.Pizzioloalsothanks FAPEMIGandFUNARBE,forsupportingtheirparticipationinthiswork.
Author Contributions: Sarcinelliproposed theideaof the work, basedonhis knowledgeonsignalprocessing. Pizziolosubmittedtheprojecttothesupportagencies.Brand˜aoandSarcinelliproposedthemethodologyandthe wayto runthe experiments.Then,Pizetta performedthe experiments.Allthe authorsdiscussedthe data.After concluding,PizettaandBrand˜aowrotethemanuscript,whichwasreviewedbyall.
ConflictsofInterest:Theauthorsdeclarenoconflictofinterest.Thefoundingsponsorshadnoroleinthedesignof thestudy;inthecollection,analyses,orinterpretationofdata;inthewritingofthemanuscript,andinthedecisionto publishtheresults.
Bibliography
Masuda, K.; Uchiyama, K. Robust Control Design for Quad Tilt-Wing UAV. Aerospace2018,5, 17. 1.
2. Brand˜ao, A.S.; Gandolfo, D.; Sarcinelli-Filho, M.; Carelli, R. PVTOL maneuvers guided by a high-level nonlinear controller applied to a rotorcraft machine. European Journal of Control2014,20, 172–179. 3. Lin, Y.; Saripalli, S. Path planning using 3D Dubins Curve for Unmanned Aerial Vehicles. Unmanned
Aircraft Systems (ICUAS), 2014 International Conference on, 2014, pp. 296–304.
4. Lin, Y.; Saripalli, S. Sampling based collision avoidance for UAVs. 2016 American Control Conference (ACC), 2016, pp. 1353–1358.
5. Israelsen, J.; Beall, M.; Bareiss, D.; Stuart, D.; Keeney, E.; van den Berg, J. Automatic collision avoidance for manually tele-operated unmanned aerial vehicles. 2014 IEEE International Conference on Robotics and Automation (ICRA), 2014, pp. 6638–6643.
6. Xiang, C.; Wang, X.; Ma, Y.; Xu, B. Practical Modeling and Comprehensive System Identification of a BLDC Motor. Mathematical Problems in Engineering2015,501, 879581.
7. Lin, H.; Ding, K. A new method for measuring engine rotational speed based on the vibration and discrete spectrum correction technique. Measurement2013,46, 2056 – 2064.
8. Pedersen, T.F.; Herlufsen, H.; Hansen, H.K. Order Tracking in Vibro-acoustic Measurements: A Novel Approach Eliminating the Tacho Probe. Technical report, 2005.
9. Molchanov, P.; Harmanny, R.I.; de Wit, J.J.; Egiazarian, K.; Astola, J. Classification of small UAVs and birds by micro-Doppler signatures. International Journal of Microwave and Wireless Technologies 2014,6, 435–444.
10. Kloet, N.; Watkins, S.; Clothier, R. Acoustic signature measurement of small multi-rotor unmanned aircraft systems. International Journal of Micro Air Vehicles2017,9, 3–14.
11. Harvey, B.; O’Young, S. Acoustic Detection of a Fixed-Wing UAV. Drones2018,2, 4.
12. Sadasivan, S.; Gurubasavaraj, M.; Sekar, S.R. Acoustic signature of an unmanned air vehicle exploitation for aircraft localisation and parameter estimation. Defence Science Journal2002,51, 279–284. 13. Gustavsson, M.; Andersson, A.; Johansson, T.; Jonsson, R.; Karlsson, N.; Nilsson, S. Micro-Doppler
extraction of a small UAV in a non-line-of-sight urban scenario. 2017, Vol. 10188, pp. 10188–10188. 14. Passow, B.N.; Gongora, M.A.; Hopgood, A.A.; Smith, S. Intelligent acoustic rotor speed estimation for
an autonomous helicopter. Applied Soft Computing2012,12, 3313–3324.
15. Zhang, X.; Huang, J.; Song, E.; Liu, H.; Li, B.; Yuan, X. Design of small MEMS microphone array systems for direction finding of outdoors moving vehicles. Sensors2014,14, 4384–4398.
16. Tiete, J.; Dom´ınguez, F.; Silva, B.d.; Segers, L.; Steenhaut, K.; Touhafi, A. SoundCompass: a distributed MEMS microphone array-based sensor for sound source localization. Sensors 2014, 14, 1918–1949.
18. Marmaroli, P.; Falourd, X.; Lissek, H. A UAV motor denoising technique to improve localization of surrounding noisy aircrafts: proof of concept for anti-collision systems. Acoustics 2012, 2012.
19. Morito, T.; Sugiyama, O.; Kojima, R.; Nakadai, K. Partially Shared Deep Neural Network in sound source separation and identification using a UAV-embedded microphone array. 2016 IEEE/RSJ International Conference on Intelligent Robots and Systems (IROS), 2016, pp. 1299–1304.
20. Wang, L.; Cavallaro, A. Time-frequency processing for sound source localization from a micro aerial vehicle. 2017 IEEE International Conference on Acoustics, Speech and Signal Processing (ICASSP), 2017, pp. 496–500.
21. Ahmed, B.; Pota, H.R.; Garratt, M. Flight control of a rotary wing UAV using backstepping. International Journal of Robust and Nonlinear Control2010,20, 639–658.
22. Spong, M.W.; Hutchinson, S.; Vidyasagar, M. Robot modeling and control; Vol. 3, Wiley New York, 2006.
23. Alsaif, k.A.; Foda, M.A.; Rosyid, A. Dynamic Simulation of an Unmanned Hybrid Flying Robot. International Journal of Micro Air Vehicles2015,7, 257–273.
24. Li, Q. Grey-box system identification of a quadrotor unmanned aerial vehicle. PhD thesis, TU Delft, Delft University of Technology, 2014.
25. Luukkonen, T. Modelling and control of quadcopter. Technical report, School of Science, Aalto University, Espoo, 2011.
26. Bouabdallah, S. Design and control of quadrotors with application to autonomous flying. PhD thesis, Ecole Polytechnique Federale de Lausanne, 2007.