Determination of Acid Content in Chemistry
Laboratory Air Using Very Simple Inexpensive
Method
Prakash Samnani*, Shreepa Patel, Bharat Kumrecha
*Department of Chemistry, Faculty of Science, The Maharaja Sayajirao University of Baroda, Vadodara, Gujarat, India
ABSTRACT: Determination of acid fumes in working atmosphere continues to be an active area of research and
concern. Though a large variety of sampling and determination methods are available, they are often associated with one or more limitations. Further, there is little data on acid in air in undergraduate chemistry laboratory, possibly because intra and inter-day variations in concentration are expected and because time and exposure levels are low. As MSc research project, therefore, we ventured into using existing knowledge to work out some simple and economic method for determining acid in chemistry laboratory air, using conventional equipment / glassware and chemicals available in the laboratory. Thus we report a very simple and inexpensive method for determination of low concentration of acid in chemistry laboratory air. In this method ordinary filter paper, impregnated with bicarbonate,
was used for the sampling of acid fumes. A 10 cm × 10 cm filter paper sheet soaked in a solution of 0.1g/mL NaHCO3
solution was used after drying. A simple aquarium aeration pump was used to sample the acid fumes in the laboratory air. Amount of acid absorbed by the paper was determined by simple titration with standard acid solution. The data shows that for upto 3 hours of exposure of this sheet to HCl fumes, noticeable difference in blank and test is observed by means of titration. This indicates impregnated paper works well as absorption medium for acid in air. Approximately 0.003g acid (calculated as HCl) /100L air sampled for 30 minutes (approximately 3 ppm) was measured in working chemistry laboratory air.
KEYWORDS: Acid fumes, chemistry laboratory, NaHCO3, titration
I. INTRODUCTION
Acids have many uses like in production of chlorides, fertilizers, dyes, electroplating, textiles rubber, etc. The physical
state of the acids in workplace air differs from liquid aerosols for non-volatile acids such as H2SO4 or H3PO4, to mists
and vapours for volatile acids like HCl or HNO3. Acid mists and vapours are highly corrosive and irritate the eyes and
the mucous membranes of the nose, pharynx and respiratory tract, even at low concentrations. The acids in air have
occupational exposure limit values between 0.1–1 ppm (H2SO4), 1 ppm (H3PO4), 2–8 ppm (HCl) and 5 ppm
(HNO3).[1]
Different types of sampling devices and absorbing / scrubbing agents are reported.
Diffusion denuders have been used in a variety of atmospheric monitoring studies to collect gaseous atmospheric pollutants [2-7]. Various sampling methods describe suitability of denuders and filters, for this purpose in studies using ambient air (Allegrini et al., 1994)[8]. The efficiency of magnesium oxide (MgO), sodium chloride (NaCl), and
sodium carbonate (Na2CO3) coated substrates in collecting nitrogenous species was determined by challenging the
substrates to synthetically generated gases. This sampling technique was found to be suitable for measuring
atmospheric aerosols and gases. Possanzini et al. [9] described application of an annular denuder configuration that
quantitatively collects reactive atmospheric gases 15-20 times more efficiently, per unit length, than the tubular denuders. Vossler et al. [10] evaluated a sampler (EPA system) consisting of a glass impactor followed by two annular
denuders and a filter pack. Measurements of SO2, HNO3 and HNO2 gases showed mean collection efficiency values of
representing about 5-10% of the concentrations of HNO3 and HNO2, occurred in the Na2CO3-coated annular
denuder[11].
TheDFG [12] and INRS [13] methods both use a pre-filter to remove interfering chloride containing particulates. They
reported method for sampling HCl and other chemical agents to which workers in the galvanizing industry were
exposed - a two-stage filter method, using a GLA-5000 PVC prefilter to collect ZnCl2, ZnO and NH4Cl and a sodium
carbonate-impregnated QMA quartz fibre filter to trap HCl. Radiello diffusive samplers were found to over sample in comparison to the two-stage filter method, but it was possibly due to contamination of the external diffusive body of the samplers, which appeared to be drawback of this type of device.[14]
A diffusion denuder using capillary gas chromatographic columns as tubes for the collection of semivolatile organic compounds consisted of 120 short (25-cm) sections of a gas chromatographic column that were assembled in parallel and the semivolatile organic compounds were collected by pulling air through the sampler; vapor-phase molecules were collected on the walls of the tubes, while particles pass through and were collected on a filter.[15] Measurements of
acidic (e.g., SO2, HNO3) and basic gases (e.g., NH3) that coexist with fine particles (< 2.5 μm) were used in models to
assist in determining the origin and age of aerosols. Bias associated with each measurement method used to obtain this air quality data was found to degrade the real correlation between species. In addition, the sensitivity of most
instrumental methods to measure SO2, NH3, HNO3 or HNO2 was reported to be limited to measurements at
concentration levels above 2-5 ppb [16].
Coated filters and Denuders (honeycomb and annular coated with different slurries of NaCl Na2CO3 and MgO) were
used for measuring nitrogen dioxide, nitric acid and nitrous acid and the efficiency of working Na2CO3 annular denuder
in trapping acids was found to be 95% more compared to honeycomb denuders and also 1,2-phenylenediamine and
1,3-phenylene diamine concentrations were measured in the work place air using these denuders[17]. Phenylene diamine
and the conducting polymer polyaniline, nano fiber, were found to have greater sensing capabilities due to the small fiber diameter, high surface area, and porous nanofiber network that enhances gas diffusion into the fibers used for the detection of phosgene gas in industries [18].
Thus, several techniques are available for sampling of acid fumes in work place environment though they are relatively expensive. Further, little data is available for determination of acid fumes in college university chemistry laboratory, possibly because intra and inter-day variations in concentration are expected and because time and exposure levels are low. As MSc research project, therefore, we ventured into using existing knowledge to work out some simple and economic method for determining amount of acid in chemistry laboratory air, using conventional equipment / glassware and chemicals available in the laboratory.
II. METHODS AND MATERIAL
Reagents: NaHCO3 (LR), Concentrated HCl (LR), NaOH (LR), Oxalic acid (LR), Methyl orange indicator (LR),
Phenolphthalein Indicator (LR), Class B laboratory glass ware, Pump used for aeration in aquarium (Output=3.5L/min, Pressure: 0.02Mpa), cardboard box, petri dish, tubings, glass turf and power supply.
Following sets of experiments were carried out in laboratory.
Stock solutions of NaOH and HCl (1 N) were prepared and stored for not more than one month. Suitable dilutions were prepared every day for experiments. Before starting every experiment standardization of NaOH was carried out with 0.1N oxalic acid solution.
The following experimental set ups were used for sampling of the acid in air.
1) Glass Wash Bottle Method
Figure 1: Experimental setup 1
Amount of NaHCO3 consumed by the acid computed by titration with a standard solution of 0.1N HCl using methyl
orange as indicator. A blank titration was also performed.
2) Glass Tube Method
In this method solid NaHCO3 powder loosely packed inside glass tube with dimensions 10cm 0.5cm. This was
connected to the pump for sampling lab air (Fig 2).
Figure 2: Experimental setup 2
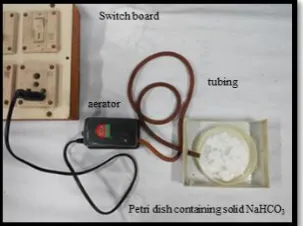
Further the amount of acid absorbed was determined by titration as mentioned above. 3) Petri Dish Method
5g NaHCO3 spread in Petri dish and kept in the box as shown in figure 3 and kept for 24 hour in laboratory. After
exposure, it was dissolved in 100mL distilled water and titration was performed as mentioned earlier.
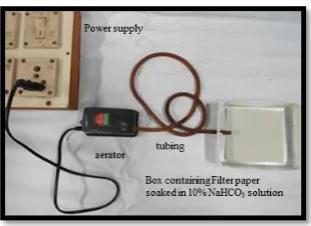
4) Filter paper
Figure 4: Experimental setup 4
(a) In this method normal filter paper, 10cm × 10cm, was impregnated with NaHCO3 by soaking it for 5 minute in
50mL distilled water containing 5g NaHCO3 . Then it was dried in air. For feasibility experiments, controlled
environment was created in another room. In this, the impregnated filter paper was kept in the box, connected to outlet of the aerator. Then, 20mL concentrated HCl in beaker along with pump was placed in enclosure. After exposure, the solution of this filter paper was prepared by cutting in small pieces in 100mL distilled water. The titration was performed as discussed above.
(b) In this method normal filter paper was impregnated with o-phenylene diamine by soaking it in 50 mL solution
of 5 g o-phenylene diamine distilled water. This filter paper was exposed to acid fumes in controlled conditions for
feasibility studies.
Actual laboratory experiments were conducted in an undergraduate chemistry laboratory in the same fashion, in which
fumes generated in the Lab environment were allowed to enter the box containing NaHCO3 impregnated filter paper.
III. RESULTS AND DISCUSSION
In the wash bottle method the medium becomes basic after bubbling air, this is due to absorption of CO2 from the air
and the difference between blank and test was negative.
Among glass tube and petri dish methods, in former very less difference in blank and test values was observed, this
may be due to less surface area of NaHCO3 exposed. Therefore, latter experiment was conducted, in which NaHCO3
has more surface area. This experiment also shows small difference in the two readings and experiment time was too
long. Apparently, there was need to increase surface area of the NaHCO3, hence impregnation of the bicarbonate on
porous medium, like filter paper, was considered.
The filter paper method showed notable difference indicating the amount of acid being absorbed. Optimization experiments were then conducted as follows.
1) Effect of concentration of NaHCO3 solution on % loading of NaHCO3.
2) Loading of NaHCO3 on different types support materials.
3) Acid absorption on different media under controlled conditions.
4) Effect of soaking time on % NaHCO3 loading.
5) o-phenylene diamine experiment under controlled conditions
6) Results of exposure of lab hours (Sodium bicarbonate)
7) Results of exposure lab hours (o-phenylene diamine)
Data in Table 1 shows effect of varying concentration of NaHCO3 in solution when the filter paper was soaked in
different concentrations for 10 minutes, each. After drying, the amount of NaHCO3 loaded on paper was determined by
Table 1: SOAKING TIME 10 MINUTES
Concentratio n
Of NaHCO3
(%)
(%) Loading
of NaHCO3
Amount of HCl (g)
0.5 0.17 0.000366
1.0 0.25 0.000366
2.0 0.17 0.001098
3.0 0.17 0.002196
4.0 0.17 0.001464
5.0 0.14 0.002562
10.0 0.11 0.004758
20.0 0.05 0.004941
At 10% and 20% concentration of sodium bicarbonate solution shows maximum amount of HCl absorbed but for further experiments 10% solution was chosen because it showed reasonable amount of % loading.
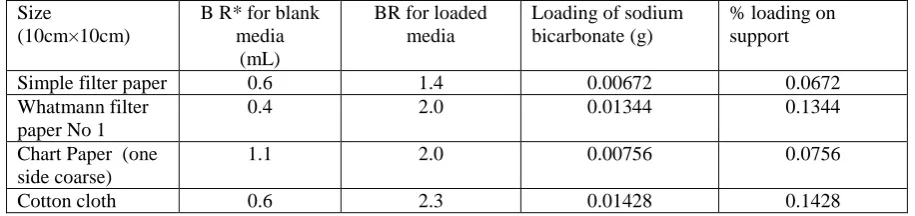
Table 2: DIFFERENT TYPES MEDIA AS SUPPORT MATERIAL FOR NAHCO3 (10 % SOLUTION, SOAKING
TIME 10 MIN)
Size
(10cm×10cm)
B R* for blank media
(mL)
BR for loaded media
Loading of sodium bicarbonate (g)
% loading on support
Simple filter paper 0.6 1.4 0.00672 0.0672
Whatmann filter paper No 1
0.4 2.0 0.01344 0.1344
Chart Paper (one side coarse)
1.1 2.0 0.00756 0.0756
Cotton cloth 0.6 2.3 0.01428 0.1428
*BR = burette reading
The % loading is maximum in case of cotton cloth and Whatman filter paper. However, for cloth, determination of
remaining o-phenylene diamine and sodium bicarbonate did not yield repeatable results. This was because adhesion or
impregnation of the bicarbonate or diamine was much stronger on the fabric.
Table 3: ACID ABSORPTION ON DIFFERENT MEDIA (CONTROLLED CONDITIONS) (10 % NAHCO3), 10
MINUTES EXPOSURE
Size (10cm × 10cm) Amount of HCl in g.
Simple filter paper 0.004392
Whatmann filter paper 0.004026
Chart Paper (one side coarse) 0.001830
Cotton cloth 0.005856
Table 4: EFFECT OF SOAKING TIME ON % NAHCO3 LOADING.(10 % NAHCO3 CONCENTRATION)
Time % loading on filter paper
00.5 0.0672
01.0 0.1176
02.0 0.1344
03.0 0.1428
04.0 0.1344
05.0 0.1596
10.0 0.1428
15.0 0.1344
20.0 0.1260
25.0 0.2100
30.0 0.0924
60.0 0.0756
Table-5. O-PHENYLENE DIAMINE EXPERIMENTAL RESULTS
Time g. in terms of
HCl
05 0.000732
10 0.001464
15 0.001464
20 0.001830
25 0.002196
30 0.002928
60 0.003294
The data in Table 5 was studied under controlled conditions and different exposure time, o-phenylene diamine
impregnated (10 %) filter paper appears yellow in colour but when exposed to acid fumes turns orange.
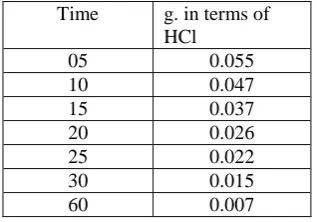
TABLE-6. SODIUM BICARBONATE EXPERIMENTAL RESULTS
Time g. in terms of
HCl
05 0.055
10 0.047
15 0.037
20 0.026
25 0.022
30 0.015
60 0.007
The data in Table 6 is for exposure of NaHCO3impregnated (10 %) filter paper under controlled conditions and effect
of exposure time.
o-Phenylene diamine (10%) impregnated filter paper under controlled conditions shows more extent of absorption of
HCl fumes compared to sodium bicarbonate (10%) , the results of o-phenylene diamine did not show reproducibility
After optimization of conditions, the experiments were conducted in actual working chemistry laboratory, with
exposure time of 30 minutes. Filter paper soaked in 10% and 20% sodium bicarbonate solution and o-phenylene
diamine solution respectively. Laboratory capacity was 40 students and working hours were 12.00 noon to 5.00 pm evening.
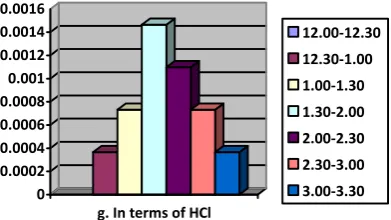
0 0.0005 0.001 0.0015 0.002 0.0025 0.003
g. In terms of HCl
12.00-12.30 12.30-1.00 1.00-1.30 1.30-2.00 2.00-2.30 2.30-3.00 3.00-3.30
Figure 5: Graph showing exposure of lab hours (12 p.m.- 6 p.m.) (Sodium Bicarbonate)
The impregnated filter paper (10% NaHCO3) treated acid fumes generated in working chemistry laboratory, result as
shown above indicates, the amount of HCl present in lab is maximum after 1.30 p.m.
0 0.0002 0.0004 0.0006 0.0008 0.001 0.0012 0.0014 0.0016
g. In terms of HCl
12.00-12.30 12.30-1.00 1.00-1.30 1.30-2.00 2.00-2.30 2.30-3.00 3.00-3.30
Figure 6: Graph showing exposure Lab hour (12 p.m.- 6 p.m.) (o-phenylene diamine)
The impregnated filter paper (10% o-phenylene diamine) treated acid fumes generated in working chemistry laboratory
shows result as above indicates, the amount of HCl present in lab is maximum after 1.30 p.m. These experiments prove the working of this simple method for determination of acid fumes in laboratory air.
IV. CONCLUSION
Thus, the impregnated filter paper, loaded with NaHCO3 provides satisfactory results for determination of acid in
REFERENCES
[1] US National Institute of Occupational Safety and Health (1994). NIOSH Manual of Analytical methods, 4th Edition Method 7903 Acids, Inorganic DHHS (NIOSH) Publication 94-113.
[2] R. K. Stevens; T.G. Dzubay; G .Russworm; D. Rickel; Atmos. Environ. 1978, 12, pp 55-88. [3] J. L. Durham; B. E. Wilson; E. B. Bailey; Atmos. Environ. 1978, 12, pp 883-886.
[4] M. Ferm; Atmos. Environ .1979, 13, pp 1385-1393.
[5] R. W. Shaw; R. K. Stevens; J. W. Bowermaster; J. W. Tesch; E. Tew; Atmos. Environ. 1982, 16, pp 845-853. [6] J. Forest; D. J. Spandan; R. L. Tanner; L. Newmann, Atmos. Environ. 1982, 16, 1473-1485.
[7]Deutsche Forschungsgemeinschaft (2002) Volatile organic acids (HCl, HBr, HNO3) in Analysis of HAzarous substances in air Volume 6, Wiley VCH Verlag, Weinheim.
[8] I. Allegrini; A. Febo; C. Perrino; and P. Masia; Intern. J. Anal. Chem. 1994, 54, pp 183-201. [9] M. Possanzini; A. Febo; Atmos. Environ. 1983, 17, pp 2605-2610.
[10] T. L. Vossler; R. K.Stevens; R. E. Baumgarden; In proceedings of the 1987 EPA/APCA sympoism on measurement of toxic Air pollutants; pp 168-171.
[11] P. Koutrakis; J. M. Wolfson; J. L. Slater; M. Brauer; J. D. Spengler; Environ. Sci. Technol. 1988 , 22, pp 1463-1468. [12] L. C. Kenny; R. J. Aitken; C. Chalmers;, App. Occup. And Environ. Hyg.; 1997, 41, pp 135-153.
[13] M. Demange; P. Gorner; J. M. Elcabache; R. Wrobel; App. Occup. And Environ. Hyg.; 2002, 41, (3), pp 135-153. [14] M. S. Krieger; R. A. Hites; Environ. Sci. Technol.; 1992, 26, pp 1551-1555.
[15] R. K. Stevens; Reseach of National Bureau of Standards; 1988, 93, pp 283-284.
[16] D. R. Scott; W. J. III Dunn; W. J. III S. L. Emery; Environ Sci. Tech., 1987, 21 (9), pp 891-897. [17] D. R. Fitz; EPA-454/R-02-011, 2002, pp 1-173.