Tracking of Television Viewing Time during
Adulthood: The Young Finns Study
XIAOLIN YANG1, ANNA KANKAANPA¨ A¨1, STUART J. H. BIDDLE2, MIRJA HIRVENSALO3, HARRI HELAJA¨ RVI4, JOUNI KALLIO1, NINA HUTRI-KA¨ HO¨NEN5, RISTO TELAMA1,3, JORMA S. A. VIIKARI6, OLLI T. RAITAKARI7, and TUIJA TAMMELIN1
1
LIKES–Research Center for Sport and Health Sciences, Jyva¨skyla¨, FINLAND;2Institute of Sport, Exercise an Active Living (ISEAL), Victoria University, Melbourne, AUSTRALIA;3Department of Sport Sciences, University of Jyva¨skyla¨, FINLAND; 4
Department of Health and Physical Activity, Paavo Nurmi Centre, University of Turku, FINLAND;5Department of Pediatrics, University of Tampere and Tampere University of Hospital, FINLAND;6Department of Medicine, University of Turku, and Division of Medicine, Turku University Hospital, FINLAND; and7Department of Clinical Physiology and Nuclear Medicine, Turku University Hospital, and Research Centre of Applied and Preventive Cardiovascular Medicine, University of Turku, FINLAND
ABSTRACT
YANG, X., A. KANKAANPA¨ A¨, S. J. H. BIDDLE, M. HIRVENSALO, H. HELAJA¨RVI, J. KALLIO, N. HUTRI-KA¨HO¨NEN, R. TELAMA, J. S. A. VIIKARI, O. T. RAITAKARI, and T. TAMMELIN. Tracking of Television Viewing Time during Adulthood: The Young Finns Study. Med. Sci. Sports Exerc., Vol. 49, No. 1, pp. 71–77, 2017.Purpose: The aim of this study was to investigate the tracking of television viewing (TV) time as an indicator of sedentary behavior among adults for a period of 25 yr.Methods: A random sample of 1601 subjects (740 men) age 18, 21, and 24 yr participated in the Cardiovascular Risk in Young Finns Study in 1986. TV time during leisure time was measured with a single self-report question at baseline and in 2001, 2007, and 2011. Tracking of TV time was analyzed using Spearman rank correlations and simplex models. Level and change of TV time were examined using linear growth modeling.Results: The 4- and 6-yr integrated TV time stability coefficients, adjusted for measurement errors, wereQ0.60 in adulthood and quite similar for both men and women. The stability coefficients tended to decline as the time interval increased. The stability of the indirect estimation of TV time for a 25-yr period was moderately or highly significant for both genders in most age groups. Younger age, but not gender, was found to be associated with a higher initial level of TV time. Male gender and older age were found to be significantly associated with the slope of TV time.Conclusion: The stability of TV time is predominantly moderate to high during adulthood and varies somewhat by age and gender.Key Words: SEDENTARY BEHAVIOR, ADULT POPULATION, STABILITY, MULTILEVEL ANALYSIS, AGE COHORTS, TV VIEWING
S
edentary lifestyle has been recognized as an increased risk factor for major health and well-being problems (23). Sedentary behavior is defined as ‘‘any waking behavior characterized by an energy expendituree1.5 meta-bolic equivalents while in a sitting or reclining posture’’ (25). Television viewing (TV) time is one of the most prevalent sedentary behaviors (6), and excessive levels have been foundto be more harmful to health than other types of sedentary behavior, such as computer use or driving (3).
In the last decade, there has been an increasing interest in the tracking of sedentary behavior among children and adoles-cents (4) and even among very young children (14). Findings from systematic reviews suggest a moderate-to-high tracking of sedentary behaviors from early childhood to middle child-hood and during childchild-hood or adolescence, but weak tracking from childhood to young adulthood. In particular, TV time seems to be more predictable than computer use/video gaming and tends to be more stable during shorter follow-ups (8,20). The nature of screen time is likely to be changing rapidly and unpredictably as new technologies and applications emerge. That said, TV time remains hugely popular and highly preva-lent. Indeed, nearly three quarters (73%) of people in Finland still watch traditional television on a daily basis. The average daily TV time between 2004 and 2014 has gradually increased from 167 to 184 min (10%) (24). However, only a few pro-spective longitudinal studies have explored the tracking of TV time from childhood to adulthood (10,17,26). These studies have been limited because of the lack of testing for gender differences, the study of a specific birth cohort only, Address for correspondence: Xiaolin Yang, Ph.D., LIKES–Research Center
for Sport and Health Sciences, Viitaniementie 15a, 40720 Jyva¨skyla¨, Finland; E-mail: [email protected].
Submitted for publication January 2016. Accepted for publication August 2016.
0195-9131/17/4901-0071/0
MEDICINE & SCIENCE IN SPORTS & EXERCISEÒ
CopyrightÓ2016 the Author(s). Published by Wolters Kluwer Health on behalf of the American College of Sports Medicine. This is an open-access article distributed under the terms of the Creative Commons Attribution-Non Commercial-No Derivatives License 4.0 (CCBY-NC-ND), where it is permissible to download and share the work provided it is properly cited. The work cannot be changed in any way or used commercially without permission from the journal.
DOI: 10.1249/MSS.0000000000001072
EPIDEMIOL
and different assessments of TV time using either parent- or self-reported methods.
Despite the increase in research on TV time in children and adolescents, no study has shown whether this specific sedentary behavior persists into adulthood. To our knowl-edge, the present study is the first to investigate the longi-tudinal stability of TV time in a large sample of adults for a long period. This is particularly important since sedentary screen time tends to carry over into adulthood, suggesting that children who spend more time sitting in front of TV may be more sedentary in adulthood (26). Excessive TV time is a risk factor for many adverse health outcomes re-lated also to the lack of physical activity and obesity (18,29). The multiple measurements of TV time between baseline and final follow-up in the current study allow for the eval-uation of the level of tracking in different phases of life.
To date, most TV time tracking studies have been conducted using self-report methods. However, these results have not been adjusted for measurement error or other error variance. There-fore, the real stability of TV time may be greater than indicated by unadjusted self-report results. Only a moderate correlation was found in a study where TV time was associated with sed-entary time measured using objective methods (6). The aim of the present study, therefore, was to use simplex modeling to investigate the tracking of TV time from young adults (ages 18–24 yr) to early middle-age adults (ages 43–49 yr) by gen-der in a nationally representative sample from the Cardio-vascular Risk in Young Finns Study during a 25-yr follow-up period. The simplex modeling is used to extend structural equation modeling frameworks to underlie the repeated mea-sures. The model with latent variables is to allow for the es-timation of individual_s initial status (level) and changes (slope), and predictors (gender and age) are included in the model to estimate their effects on the level and slope.
MATERIALS AND METHODS
Participants.Data were obtained from the
Cardiovas-cular Risk in Young Finns Study that was launched in 1980 with follow-ups in 1983, 1986, 1989, 1992, 2001, 2007, and 2011 (22). Altogether, 4320 children and adolescents age 3, 6, 9, 12, 15, and 18 yr were randomly chosen from the population register of five university cities with medical schools (Helsinki, Kuopio, Oulu, Tampere, and Turku) and their surroundings to produce a representative sample of Finnish children. A total of 3596 children (83.2%) partici-pated in the first cross-sectional survey in 1980. For the present study, we chose 1986 as the baseline because it was the first year for which TV time was self-reported in three age subgroups (i.e., in those 18 yr or older). Follow-up TV time data were collected in 2001, 2007, and 2011, when the participants who were 43–49 yr old were assigned to each of the three age groups. In brief, the response rate of TV time was 69.8% in 1986, 73.7% in 2001, 65.1% in 2007, and 63.3% in 2011. The reason of increased sample size in 2001 was that those who did not answer this question in 1986
were asked to answer the question in 2001. The study pro-tocol was reviewed and approved by the ethics committee of each of the five participating universities. The informed consent of all participants was obtained in accordance with the Helsinki Declaration (22).
Sedentary behavior (TV time).In 1986, participants
were asked to report how many hours per day they spent watching TV/video. From 2001 to 2011, all participants were asked to report how much time on average they spent daily on TV. In 2001, the daily TV time was recorded in minutes and in 2007 in hours. The self-reported TV time in 2011 was measured in minutes separately for weekdays and weekend days, and those self-reports were calculated by (5weekday + 2weekend) / 7 as a mean daily TV time. To have the same unit of measurement for tracking TV time, all four measurements of daily TV time were converted into a 1-h increments (hours of daily TV) before analysis (11).
Statistical analysis.Descriptive analyses were conducted
separately for men and women in three age groups. Mean and SD values for TV time at each measurement and Spearman rank correlations (Spearman rho) between consecutive mea-surements were calculated and tested for significance using SPSS 20.0 for Windows (SPSS Inc., Chicago, IL).
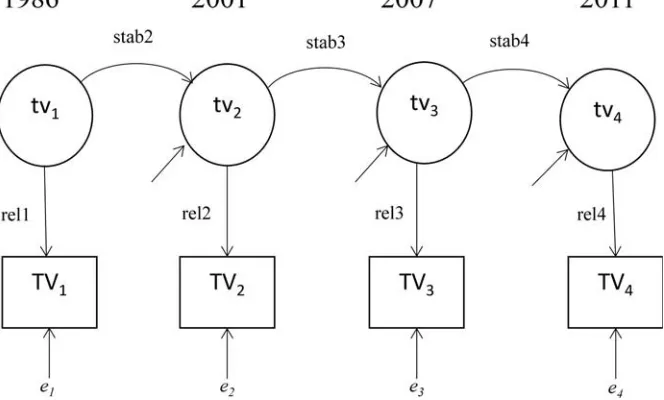
To evaluate reliability and stability of the TV time mea-sures, a simplex model within a structural equation modeling framework was used (Fig. 1). The simplex model (more pre-cisely, the quasi-simplex model) was fitted for the repeated measures of TV time for the time interval from 1986 to 2011 in each age cohort of young adults. Simplex modeling con-sists of two parts: measurement model and regression model (2,15). In the measurement model, an observed variable (TVt) is linked to a latent variable (tvt) at the certain time of mea-surement (t) (corresponding factor loading is fixed to be one). A measurement error (et) is isolated, and the latent variable represents unobserved ‘‘true trait.’’ In the regression part, the latent variable at a certain time of measurement is regressed on the latent variables at a previous time of measurement. Thus, the simplex model enables us to distinguish the mea-surement error from the change in the ‘‘true trait.’’ This means that it is possible to estimate the measurement error variance and, consequently, the reliability of the measure at each measurement (relt) and the stability of the ‘‘true trait’’ (stabt), that is, the correlation between the latent variables at con-secutive measurements (2). To end up with an identifiable model, the measurement error variances between the first and the second measurements (1986 and 2001) were estimated as equal, and so were the measurement error variances in last two occasions (2007 and 2011) for both genders in each age group. This is probably the most logical way to achieve the identifiable simplex model (16) to apply to understand the tracking of physical activity behavior (9,27,28).
To evaluate the goodness of fit of the simplex models, the Satorra–Bentler correctedW2test, the comparative fit index (CFI), the Tucker–Lewis Index (TLI), the standardized root mean square residual (SRMR), and the root mean square error of approximation (RMSEA) were estimated. A model
EPIDEMIOL
fits the data well when thePvalue associated with theW2test is nonsignificant. CFI and TLI values close to or higher than 0.95, SRMR values less than 0.08, and RMSEA values less than 0.06 indicate a relatively good fit between the hypoth-esized model and the observed data (13). If the model does not fit the data adequately, modification indices (MI) are examined. The reliability coefficients of the observed vari-ables at each measurement and the stability coefficients be-tween adjacent latent variables were calculated. Indirect effects of latent TV time at baseline on latent TV time at follow-up via the repeated measures were calculated and tested for significance by using simplex models.
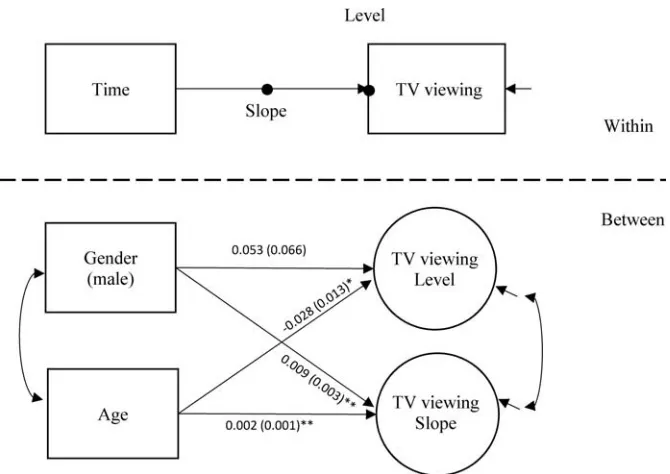
Furthermore, linear growth curve modeling was used to examine the effects of gender and age on intercept (level) and development (slope) of TV time during the follow-up period from 1986 to 2011. Multilevel modeling was applied to fit the growth model (12). Data were in long format be-cause of process requirements for the growth modeling analyses, and participants_IDs were treated as cluster vari-ables. Time variable was coded to correspond to intervals between the measurement years (1986: time = 0; 2001: time = 15; 2007: time = 21; and 2011: time = 25). At the within-subject level, the regression coefficient between time and TV time was specified as a random slope, and the level of TV time was specified as a random intercept. At the between-subject level, the effects of gender and age on
the level and slope of TV time were estimated and tested for significance.
The simplex and linear growth curve models were fitted by using the Mplus statistical software package (Version 7) (19). Full information maximum likelihood (FIML) estimation with robust standard errors was used to estimate means and param-eters of the models. Missing data were assumed to be missing at random and were considered missing as a function of observed covariates and observed outcomes (19) because the exclusion of the missing data from the final analysis might significantly reduce statistical power and lead to biased estimation results (21). FIML produces unbiased parameter estimates under the ‘‘missing at random’’ assumption and uses all available infor-mation in the data set.
RESULTS
The overall number of participants, mean values, and SD values for daily TV time at each measurement are shown in Table 1. Participants were born in 1968, 1965, and 1962 and were 18, 21, and 24 yr old at the time of the first assessment, respectively. The participants (n= 1601, 46.2% men) having at least one measurement of TV time were included in the present study. Of these, 708 participants (44.2%) completed all four measurements, 396 (24.7%) completed three measurements,
TABLE 1. Number of participants, mean values, and SD values of TV time (hIdj1) by gender, age, and measurement year.
Men Women
1986 2001 2007 2011 1986 2001 2007 2011
Age in 1986 n(MeanTSD) n(MeanTSD) n(MeanTSD) n(MeanTSD) na n(MeanTSD) n(MeanTSD) n(MeanTSD) n(MeanTSD) na
18 204 (2.1T1.1) 203 (2.2T1.1) 173 (2.0T1.1) 149 (2.1T1.0) 268 259 (1.9T1.1) 264 (1.9T1.1) 233 (1.8T1.1) 199 (1.8T1.0) 311 21 192 (1.9T1.3) 208 (2.1T1.1) 185 (1.9T1.3) 153 (2.1T1.3) 256 229 (1.9T1.3) 254 (1.9T1.1) 221 (1.7T1.1) 197 (1.8T1.1) 289 24 162 (1.9T1.2) 177 (2.0T1.2) 160 (2.0T1.1) 152 (2.4T1.7) 216 203 (1.9T1.3) 213 (1.8T1.0) 194 (1.8T1.1) 189 (2.1T1.4) 261
anwas the total sample size used in modeling.
FIGURE 1—The simplex model for TV time (Note: TVt=observed TV time; tvt= true TV time; et= measurement error; stabt= the coefficient of
stability; relt=the coefficient of reliability on occasiont;A= regression coefficient).
EPIDEMIOL
256 (16.0%) completed two measurements, and 241 (15.1%) completed one measurement. Thus, to make use of all available data and to achieve the unbiased estimates, the FIML was used to analyze the incomplete data. Unlike, e.g., the listwise dele-tion method, FIML does not lose the valuable informadele-tion and statistical power to detect statistically significant effect. The level of daily TV time in each age group varied slightly during a 25-yr period. One exception was found among the initially 24-yr-old men and women where the average TV time in-creased significantly between the baseline and the final assess-ment only.
Spearman rank correlations of TV time between the dif-ferent measurements are shown in Table 2. The correlation coefficients during the 4- and 6-yr periods (2007–2011 and 2001–2007) were all highly significant and ranged from 0.52 to 0.68 in men and from 0.52 to 0.60 in women. The correlations during the 10-yr period (2001–2011) were also all significant, ranging from 0.34 to 0.61 in men and from 0.44 to 0.47 in women. The correlation coefficients for TV time during the 15-yr period (1986–2001) ranged from 0.28 to 0.52 in men and from 0.40 to 0.47 in women. The cor-relations during the 25-yr period (1986–2011) ranged from 0.13 to 0.38 in men and from 0.25 to 0.42 in women. In both long periods, all correlations were significant except in the group of men age 18 yr at baseline.
Almost in every age-gender group, the simplex model fitted the data well or the model was saturated: W2test was insignificant, CFI values were higher than 0.97, TLI values were 0.91 or higher, SRMR values were 0.03 or lower, and RMSEA values were 0.08 or lower. However, the simplex model showed poor fit to the data (W21= 14.48,PG0.001, CFI = 0.94, TLI = 0.66, SRMR = 0.04, RMSEA = 0.23) in women age 24 yr in 1986. The modification indices suggested that the direct effect between latent TV time in 1986 and in 2011 should be estimated (MI = 13.98 for the association). Thus, TV time in 1986 was omitted in 24-yr-old women, and a simplex model for three measurements was fitted.
The reliability coefficients derived using the simplex model for TV time ranged from 0.55 to 0.93 in men and from 0.62 to
0.96 in women (Table 3). All reliability coefficients were Q0.60 in both genders, except men age 21 yr in 2001.
Stability coefficients for TV time are shown in Table 4. In all age groups, the stability coefficients for the 4-yr period (2007–2011) were high and ranged from 0.61 to 0.94 in men and from 0.65 to 0.72 in women. Similar results were found during the 6-yr period (2001–2007), ranging from 0.77 to 0.99 in men and from 0.70 to 0.94 in women. For 15 yr (1986–2001), the stability coefficients varied by age and gender: the coefficients were high (90.60) among men age 24 yr and women age 18 and 21 yr and moderate (0.36 and 0.50) among men age 18 and 21 yr in 1986, respectively, whereas the corresponding stability coefficient could not be estimated among women age 24 yr.
The standardized indirect effects of latent TV time in 2001 on latent TV time in 2011 via the measurement in 2007 (10-yr interval) were significant for men and women in all age groups and ranged from 0.46 to 0.72 in men and from 0.46 to 0.58 in women. The indirect effects of latent TV time in 1986 on latent TV time in 2011 via the measurements in 2001 and 2007 (25-yr interval) were significant for both genders in all age groups, except men age 18 yr in 1986. For 24-yr-old women at baseline, the corresponding indirect effect could not be estimated. The coefficients ranged from 0.17 to 0.92 in men and from 0.37 to 0.39 in women. All the stability coefficients were higher than corresponding correlation co-efficients, indicating that there were considerable measure-ment error variances captured by the models.
Figure 2 illustrates the unstandardized regression co-efficients for gender and age on level and overall growth (slope) for TV time. Gender (0 = female, 1 = male) was significantly associated with the slope but not with the level of TV time. This indicated that the development of TV time differed between men and women. Among men, TV time tended to increase slightly over time, whereas opposite trend was observed for women. Age was negatively associated with the initial level and positively associated with the slope of TV time. This indicates that older participants had lower levels of TV time than the younger ones, but the TV time of TABLE 2. Tracking of TV time (Spearman correlations) split by age, gender, and measurement years.
Men Women
Age in 1986
1986–2001 (15 yr)
2001–2007 (6 yr)
2007–2011 (4 yr)
2001–2011 (10 yr)
1986–2011 (25 yr)
1986–2001 (15 yr)
2001–2007 (6 yr)
2007–2011 (4 yr)
2001–2011 (10 yr)
1986–2011 (25 yr)
18 0.28*** 0.52*** 0.53*** 0.34*** 0.13 0.42*** 0.52*** 0.60*** 0.44*** 0.25** 21 0.42*** 0.60*** 0.59*** 0.61*** 0.28** 0.47*** 0.55*** 0.58*** 0.44*** 0.29*** 24 0.52*** 0.66*** 0.68*** 0.53*** 0.38*** 0.40*** 0.58*** 0.57*** 0.47*** 0.42***
**PG0.01. ***PG0.001.
TABLE 3. Estimated coefficients of reliability (simplex) of TV time.
Men Women
Age in 1986 1986 2001 2007 2011 1986 2001 2007 2011
18 0.74 0.71 0.84 0.79 0.72 0.68 0.79 0.78
21 0.65 0.55 0.64 0.65 0.71 0.62 0.93 0.94
24 0.76 0.74 0.90 0.93 –a 0.92 0.93 0.96
aReliability could not be evaluated because simplex model for four measurements did not fit the data adequate.
EPIDEMIOL
older participants tended to increase more over time than that of the younger ones (see Table 1).
DISCUSSION
This study investigated how TV time as an indicator of sedentary behavior tracks from early to middle adulthood in three age groups of men and women for 25 yr. The main result was that the 4- and 6-yr integrated TV time stability coefficients adjusted for measurement errors were high in adulthood and quite similar for men and women. The sta-bility coefficients were slightly lower for the 10-yr interval than for the two shorter intervals and lowest for the 25-yr interval, as expected. The stability of indirect analyses of TV time during the period of 10 and 25 yr was moderately or highly significant for both genders in most age groups. Men watched daily TV more than women during the follow-up, and the long-term pattern of TV time varied in magnitude between men and women in different age groups.
In the few longitudinal studies, where participants have been followed from childhood to young adulthood, the tracking correlations have been lower with longer follow-ups (10). However, the tracking of daily TV time in a study by Landhuis et al. (17) from adolescence (ages 13 and 15) to young adulthood (age 21) had significant moderate stability (0.33 and 0.42, respectively), and weekday TV time from youth (aggregated ages 5–15 yr) tracked moderately (0.33) to adulthood (age 32) as well. In the study by Smith et al. (26), children at age 10 yr who reported watching TV ‘‘often’’ had a 1.4-fold higher likelihood to watch TV93 hIdj1in adult-hood at age 42 yr compared with those who reported watching TV ‘‘never/sometimes.’’ This was independent of sports activities both during childhood and adulthood. In the present study, the coefficients of stability throughout the 25 yr (0.36–0.99), in which measurement error had been taken into account, were higher than the traditional Spearman rank correlations within the shorter or longer intervals in all age-groups for both genders. It seems that TV time is a relatively TABLE 4. Estimated stability coefficients of TV time and indirect effects with varying length of the follow-up period in years.
Stability Coefficient Indirect Effect (SE)
Age in 1986 1986–2001 (15 yr) 2001–2007 (6 yr) 2007–2011 (4 yr) 2001–2011 (10 yr) 1986–2011 (25 yr)
Men
18 0.36** 0.77*** 0.61*** 0.47 (0.17)** 0.17 (0.09) 21 0.50** 0.99*** 0.94*** 0.46 (0.16)** 0.92 (0.14)*** 24 0.76*** 0.97*** 0.75*** 0.72 (0.08)*** 0.55 (0.12)*** Women
18 0.64*** 0.81*** 0.72*** 0.58 (0.17)** 0.37 (0.12)** 21 0.63*** 0.94*** 0.69*** 0.51 (0.13)*** 0.39 (0.10)***
24 –a 0.70*** 0.65*** 0.46 (0.10)*** –a
a
Stability and indirect effect could not be evaluated because simplex model for four measurements did not fit the data adequate. **PG0.01.
***PG0.001.
FIGURE 2—The growth model for TV time (Note: Model was fitted for four measurements (1986, 2001, 2007, and 2011). Level and slope of TV time were predicted by gender and age. Unstandardized regression coefficients (standard errors) are presented. ***PG0.001.
EPIDEMIOL
stable behavior in adulthood over time. The high stability coefficients were partly due to the fact that the residual vari-ances were fixed to be near zero. However, the Spearman correlations between the TV time measurements were sig-nificant in all age-gender groups, with only one exception. In particular, the correlations showed high levels in most of the age-gender groups within the last 4-yr interval ranging from 0.49 to 0.72 in men and from 0.53 to 0.67 in women, and explaining 24%–52% of the variance among men and 28%–45% of variance among women in TV time 4 yr later. This is in line with a contemporary review (7), which reported moderate to high reliability for TV time within a short period in adulthood.
Furthermore, none of the previous studies reported vari-ation by age in tracking correlvari-ations or stability coefficients of TV time. In this study, the interage correlations and sta-bility coefficients in adulthood were relatively high, indi-cating that TV time is largely stable throughout adulthood. As reliability is high, measurement errors are small in comparison with the true differences between participants who are in different age groups and life stages so that the assessment of TV time by self-reports appears to be suitable for examining age diversity among adult populations.
The gender effect on the tracking of TV time was appar-ent in all phases of adulthood, with men_s TV time being more stable than women_s. There are no clear reasons for the gender difference, but some behavioral differences may ex-ist. It is possible that many life changes, such as smoking habits, low education, unemployment, poor health, and overweight, have a greater influence on the TV time of men than that of women (5). Some evidence indicates that women are more likely to be physically inactive than men after getting married and due to higher engagement with domestic chores and having small children in the family (1,30). These sociodemographic factors may result in dif-ferent effects on TV time across difdif-ferent periods.
TV time has usually been tracked through coefficients, for example, ranking correlations, showing the extent that in-dividuals maintain the same position in the activity distri-bution. Our recent findings derived from the same database of the Young Finns Study (28) suggest that the Spearman correlations between physical activities within the 6-yr in-terval (2001–2007) are moderate in all age-gender groups, ranging from 0.49 to 0.55 in men and from 0.39 to 0.46 in women. In this study, the results indicated that TV time tracked better than physical activity during the same period, ranging from 0.52 to 0.66 in men and from 0.52 to 0.58 in women. This is in line with the results from previous studies where sedentary time in young people, and particularly TV time, seems to track slightly better than physical activity (4). Consistent with previous research, TV time in adulthood tended to increase over the four assessments in a 25-yr follow-up. Gender differences were observed in the slope of TV time. TV time seemed to increase slightly among men, whereas opposite trend over time was observed among women. This finding suggests that the gender difference should be taken
into account in the effectiveness of intervention to reduce TV time in adulthood. Age differences were also observed in the level and slope of TV time. Older participants who initially had lower levels of TV time (level) had subsequently higher levels of TV time (slope) compared with younger participants. These findings indicate the importance of both preventing high TV time among younger adults and subsequently re-ducing TV time among older adults.
Although objective instruments for measuring sedentary time, such as accelerometers and inclinometers, are increas-ingly used, most long-term TV time tracking studies are based on self-reports. As objective measures of sedentary time be-come more widespread, it will be possible to study the track-ing of overall or total sedentary time in a more reliable and valid way. Measurement errors in self-report studies may cause lower tracking correlations and thus give lower stability values than is in fact the case. The use of simplex models is one way to take measurement error into account and estimate the ‘‘true’’ stability of TV time. The simplex model, and our unique design with four measurements, also made it possible to calculate the indirect effect of baseline TV time through the measurements in 2001 and 2007 on TV time in 2011.
There is very little research into what kinds of de-terminants regulate tracking of TV time. Our results show that the level of TV time tracking is related to age and gender. Sedentary TV time develops early in life (4,14) and remains relatively stable through young adulthood (18,26). Our findings highlight that young adults are particularly vulnerable to prolonged TV time also for a longer period. Therefore, it is important to emphasize that the reduction of TV time, especially in early life, may prevent high sedentary behavior carrying over into adulthood. Further studies are required to evaluate the change of TV over time, as well as to consider interventions to reduce TV time, alongside changes in physical activity, especially in adult populations. The strengths of this study include a long follow-up time of 25 yr, a representative population-based sample covering ages from 18 to 49 yr, three birth cohorts, and the use of four measurements, allowing us to use a simplex model to ana-lyze the stability of TV time in different phases of adulthood and long-term indirect effects. A limitation of our study is that self-reported TV time has been measured with a single item, and slightly different methods were used on the four occasions. It is difficult to harmonize the questions targeted at different life stages. Although TV has a slightly different meaning distinct from video viewing, the different effects of sedentary screen time are very similar. Despite this, both the tracking correlations and the stability coefficients from the simplex model were from 2007 to 2011, at least as high as the corresponding correlation and coefficients from 2001 to 2007. This means that the latent variable of TV time can be measured using a single question in a slightly different way. As the participants_ ages ranged from 18 to 49 yr, that is, from young adulthood to early middle age, the results may not be generalized to the older population (Q50 yr). In ad-dition, recent research suggests that self-reported TV time
EPIDEMIOL
measurements may result in over- or underestimation and that their reliability and validity, particularly in adolescents and young adults, are questionable (18).
In conclusion, this study has shown that the daily amount of TV time is stable during adulthood and that the stability of TV time is predominantly moderate or high throughout adulthood. The stability, however, varies somewhat by age and gender. Future studies may need to investigate how this changes, if at all, with the changing nature of TV provision and access and associated ubiquitous provision of screen-based media.
This study was financially supported by the Academy of Finland (grant nos. 77841, 210283, 121584, and 124282), the Social Insur-ance Institution of Finland, the Ministry of Education and Culture, the Turku University Foundation, the Special Federal Grants for Turku University Hospital, the Juho Vainio Foundation, the Finnish Foun-dation of Cardiovascular Research, the Finnish Medical FounFoun-dation, the Finnish Cultural Foundation, and the Yrjo¨ Jahnsson Foundation. The authors declare that they have no financial conflict of interests to disclose with any of the companies or manufacturers named in this article.
The results of the present study do not constitute endorsement of any product by the authors or the American College of Sports Medicine.
REFERENCES
1. Allender S, Hutchinson L, Foster C. Life-change events and par-ticipation in physical activity: a systematic review.Health Promot Int. 2008;23(2):160–72.
2. Alwin DF.Margins of Error: A Study of Reliability in Survey Mea-surements. Hoboken (NJ): John Wiley & Sons; 2007. pp. 104–110. 3. Basterra-Gortari FJ, Bes-Rastrollo M, Gea A, Nunez-Cordoba JM,
Toledo E, Martinez-Gonzalez MA. Television viewing, computer use, time driving and all-cause mortality: the SUN cohort.J Am Heart Assoc. 2014;3(3):e000864.
4. Biddle SJH, Pearson N, Ross GM, Braithwaite R. Tracking of sedentary behaviours of young people: a systematic review.Prev Med. 2010;51(5):345–51.
5. Burton NW, Haynes M, van Uffelen JGZ, Brown WJ, Turrell G. Mid-aged adults_sitting time in three contexts.Am J Prev Med. 2012;42(4):363–73.
6. Clark BK, Healy GN, Winkler EA, et al. Relationship of television time with accelerometer-derived sedentary time: NHANES.Med Sci Sports Exerc. 2011;43(5):822–8.
7. Clark BK, Sugiyama T, Healy GN, Salmon J, Dunstan DW, Owen N. Validity and reliability of measures of television viewing time and other non-occupational sedentary behaviour of adults: a re-view.Obes Rev. 2009;10(1):7–16.
8. Francis SL, Stancel MJ, Sernulka-George FD, Broffitt B, Levy SM, Janz KF. Tracking of TV and video gaming during childhood: Iowa Bone Development Study. Int J Behav Nutr Phys Act. 2011;8(1):100.
9. Friedman HS, Martin LR, Tucker JS, Criqui MH, Kern ML, Reynolds CA. Stability of physical activity across the lifespan.
J Health Psychol. 2008;13(8):1092–104.
10. Hancox RJ, Milne BJ, Poulton R. Association between child and adolescent television viewing and adult health: a longitudinal birth cohort study.Lancet. 2004;364(9430):257–62.
11. Helaja¨rvi H, Rosenstro¨m T, Pahkala K, et al. Exploring causality between TV viewing and weight change in young and middle-aged adults. The cardiovascular risk in young Finns Study.PLoS One. 2014;9(7):e101860.
12. Hox J, Stoel RD. Multilevel and SEM approaches to growth curve modeling. In: Everitt BS, Howell DC, editors. Encyclopedia of Statistics in Behavioral Science. Vol. 3. Chicester:John Wiley & Sons; 2005. pp. 1296–1305.
13. Hu L, Bentler PM. Cutoff criteria for fit indexes in covariance structure analysis: conventional criteria versus new alternatives.
Struct Equ Modeling. 1999;6(1):1–55.
14. Jones RA, Hinkley T, Okely AD, Salmon J. Tracking physical activity and sedentary behavior in childhood: a systematic review.
Am J Prev Med. 2013;44(6):651–8.
15. Jo¨reskog K, So¨rbom D.LISREL 8 User_s Reference Guide.Chicago:
Scientific Software International, Inc.; 1999.
16. Jo¨reskog K. Analysis of covariance structures. In: Nesselroade JR, Cattel RB, editors.Handbook of Multivariate Experimental Psychology.2nd ed.Plenum Press; 1988. pp. 207–28.
17. Landhuis EC, Poulton R, Welch D, Hancox RJ. Programming obesity and poor fitness: the long-term impact of childhood tele-vision.Obesity (Silver Spring). 2008;16(6):1457–9.
18. Mamun AA, Callaghan MJO, Williams G, Najman JM. Television watching from adolescence to adulthood and its association with BMI, waist circumference, waist-to-hip ratio and obesity: a longi-tudinal study.Public Health Nutr. 2012;16(1):54–64.
19. Muthe´n B, Muthe´n L.Mplus User_s Guide and Mplus (1998–2010). Available at: http://www.stamodel.com. 2010.
20. Pearson N, Salmon J, Campbell K, Crawford D, Timperio A. Tracking of children_s body-mass index, television viewing and dietary intake over five-years.Prev Med. 2011;53(4–5):268–70. 21. Raghunathan TE. What do we do with missing data? Some options
for analysis of incomplete data. Annu Rev Public Health. 2004;25:99–117.
22. Raitakari OT, Juonala M, Ro¨nnemaa T, et al. Cohort profile: the cardiovascular risk in Young Finns Study. Int J Epidemiol. 2008;37(6):1220–6.
23. De Rezende LFM, Rodrigues Lopes M, Rey-Lo´pez JP, Rodrigues Matsudo VK, Luiz ODC. Sedentary behavior and health outcomes: an overview of systematic reviews.PLoS One. 2014;9(8):e105620. 24. Sandell L. Television viewing in Finland 2014. Finnpanel: TV
year 2015 press event. www.finnpanel.fi 2015.
25. Sedentary Behaviour Research Network. Letter to the editor: standardized use of the terms ‘‘sedentary’’ and ‘‘sedentary behav-iours.’’Appl Physiol Nutr Metab. 2012;37:540–2.
26. Smith L, Gardner B, Hamer M. Childhood correlates of adult TV viewing time: a 32-year follow-up of the 1970 British Cohort Study.J Epidemiol Community Health. 2015;69(4):309–13. 27. Telama R, Leskinen E, Yang X. Stability of habitual physical
ac-tivity and sport participation: a longitudinal tracking study.Scand J Med Sci Sports. 1996;6(6):371–8.
28. Telama R, Yang X, Leskinen E, et al. Tracking of physical activity from early childhood through youth into adulthood. Med Sci Sports Exerc. 2014;46(5):955–62.
29. Veerman JL, Healy GN, Cobiac LJ, et al. Television viewing time and reduced life expectancy: a life table analysis.Br J Sports Med. 2011;46(13):927–30.
30. Yang X, Telama R, Leino M, Viikari J. Factors explaining the physical activity of young adults: the importance of early sociali-zation.Scand J Med Sci Sports. 1999;9(2):120–7.