Standard Model physics at ATLAS
E. Yu. Soldatov1,∗
on behalf of the ATLAS Collaboration∗∗
1National Research Nuclear University «Moscow Engineering Physics Institute», 115409, Kashirskoe
shosse, 31, Moscow, Russia
Abstract.The latest advances in Standard Model measurements performed by the ATLAS experiment at the LHC are discussed. Vector-boson scattering
pro-cesses have been observed in several final states (ZZ,WZ, same-signWW), and
evidence has been reached in theZγfinal state. The experimental precision of
QCD measurements has reached the same order as the theoretical uncertainties
on the NNLO calculations. Evidence for the tribosonWVVfinal state has been
achieved. The latest results onV+jets,Zγ,W+W−and direct photons
produc-tion are presented. New results on jet substructure and forward proton tagging program are also discussed.
1 Introduction
The Standard Model (SM) of particle physics has been successful at explaining and predicting all results obtained at collider experiments (and others) so far. Expectations of this theory have been confirmed many times with a high level of precision. SM measurements in collider experiments are used for its verification on the one hand and disproof or extension on the other hand.
To reach the first goal, we aim to validate the SM in a new energy regime and improve the precision of known SM parameters. To reach the second goal, we probe for beyond Standard Model (BSM) contributions (e.g. anomalous couplings, etc) and provide the information about the SM processes, which are backgrounds to direct BSM searches.
This article reports the SM results from the ATLAS Collaboration that are available less than a year after the end of LHC Run 2. At this moment, ATLAS has published almost 200 SM-related papers [2]. This overview will cover just a few recent ones on different topics. The covered topics are: Electroweak Physics (singleW andZbosons, Dibosons/Tribosons, vector-boson fusion/scattering production), Direct photons, Jet Physics, Soft QCD, Diffrac-tion and Forward Physics.
2 Data taking by ATLAS
Thanks to the excellent performance of the LHC during Run 1, the ATLAS detector collected 4.6 fb−1 of 7 TeV collision data and 20.3 fb−1 of 8 TeV collision data. During Run 2, the ATLAS detector collected 139 fb−1of 13 TeV collision data, which are ready to be analysed.
∗e-mail: [email protected]
The pile-up conditions in Run 2 were worse than in Run 1 and the average number of interactions in one bunch crossing exceeded 40 for 2017 and 2018 data taking. Also, some low pile-up runs were taken, for preciseZandWbosons measurements.
In Figure 1 (left), a schematic illustration of the ATLAS detector [1] and its components, is shown. Besides the well-known "central" parts, ATLAS also includes forward detectors used for important elastic proton scattering measurements (e.g. ALFA, shown on the right in Figure 1).
Figure 1.Left: ATLAS detector scheme. Right: scheme of upper and lower parts of the ALFA detector and their Roman Pots.
3 Electroweak measurements
3.1 Single boson production
Single electroweak boson production is a benchmark process for fixed-order calculations and predictions of MC simulations for perturbative QCD (pQCD). The high precision reached in these measurements can be used for the study of parton density functions (PDFs).
The measurement of inclusive single Z boson production, with the Z decaying to an electron-positron pair, has been performed using 19.9 fb−1of 8 TeV data [3]. The main back-grounds for this study come from the multijet andW+jet processes. The theoretical NNLO QCD predictions with different PDF sets, obtained using the NNLOJET [5] framework, are in good agreement with the measured cross sections, within uncertainties, as shown in Fig-ure 2. NLO predictions have worse agreement with the data. The dominant uncertainties for the measurement are from the signal modelling and the systematic uncertainties related to jet energy resolution and scale.
The pile-up conditions in Run 2 were worse than in Run 1 and the average number of interactions in one bunch crossing exceeded 40 for 2017 and 2018 data taking. Also, some low pile-up runs were taken, for preciseZandW bosons measurements.
In Figure 1 (left), a schematic illustration of the ATLAS detector [1] and its components, is shown. Besides the well-known "central" parts, ATLAS also includes forward detectors used for important elastic proton scattering measurements (e.g. ALFA, shown on the right in Figure 1).
Figure 1.Left: ATLAS detector scheme. Right: scheme of upper and lower parts of the ALFA detector and their Roman Pots.
3 Electroweak measurements
3.1 Single boson production
Single electroweak boson production is a benchmark process for fixed-order calculations and predictions of MC simulations for perturbative QCD (pQCD). The high precision reached in these measurements can be used for the study of parton density functions (PDFs).
The measurement of inclusive singleZ boson production, with the Z decaying to an electron-positron pair, has been performed using 19.9 fb−1of 8 TeV data [3]. The main back-grounds for this study come from the multijet andW+jet processes. The theoretical NNLO QCD predictions with different PDF sets, obtained using the NNLOJET [5] framework, are in good agreement with the measured cross sections, within uncertainties, as shown in Fig-ure 2. NLO predictions have worse agreement with the data. The dominant uncertainties for the measurement are from the signal modelling and the systematic uncertainties related to jet energy resolution and scale.
Other inclusive measurements ofW andZsingle production have been performed under special conditions with low pile-up and using 4 pb−1of data with a centre-of-mass collision energy of 2.76 TeV [4]. The main backgrounds come from electroweak (diboson, single boson andτdecays) and multijet processes. The theoretical NNLO predictions with differ-ent PDF sets are in good agreemdiffer-ent with the measured cross sections within uncertainties,
|
jet
|y
0 0.5 1 1.5 2 2.5 3
0.6 0.8 1 1.2
1.4 < 400 GeV T jet
300 GeV < p |yjet|
0 0.5 1 1.5 2 2.5 3
0.7 0.8
0.91
1.1 1.2
1.3 < 200 GeV T jet
100 GeV < p |yjet|
0 0.5 1 1.5 2 2.5 3
Theory/Data
0.7 0.8
0.91
1.1 1.2
1.3 < 50 GeV T jet 25 GeV < p
|
jet
|y
0 0.5 1 1.5 2 2.5 3
0.6 0.8 1 1.2
1.4 < 1050 GeV T jet
400 GeV < p |yjet|
0 0.5 1 1.5 2 2.5 3
0.7 0.8
0.91
1.1 1.2
1.3 < 300 GeV T jet
200 GeV < p |yjet|
0 0.5 1 1.5 2 2.5 3
Theory/Data
0.7 0.8
0.91
1.1 1.2
1.3 < 100 GeV T jet
50 GeV < p ATLAS
-1 =8 TeV, 19.9 fb s
=0.4
R
t anti-k
Data
NNLO QCD NP k × × kQED
CT14 NNPDF 3.1
Figure 2. Ratio of the measuredZ +jets production cross section and the NNLO QCD predictions,
obtained using NNLOJET, corrected for the non-perturbative and QED radiation effects as a function
of|yjet|andpjetT bins. The theoretical predictions are calculated using various PDF sets. The coloured
error bars represent the sum in quadrature of the effects of the PDF, scale, andαS uncertainties, and the
uncertainties from the non-perturbative and QED radiation corrections. The grey band shows the sum in quadrature of the statistical and systematic uncertainties in the measurement except for the luminosity uncertainty of 1.9% [3].
as shown in Figure 3. The dominant uncertainties for the measurement are from limited statistics, lepton reconstruction and identification efficiency simulation, and from imperfect knowledge of the multijet background. Using the cross-section ratios forW+/W−andW/Z,
different PDF sets have been tested, as shown in Figure 4. The main idea of this study relies upon the fact that some of the uncertainties will cancel out in ratios and the ratio will be more sensitive to the PDFs. A slight tension between the data and the prediction using the ABMP16 PDF set is observed.
1800 1900 2000 2100 2200 2300 2400
[pb]
W fid
σ
ATLAS
-1 = 2.76 TeV, 4.0 pb s
total uncertainty
±
Data
stat. uncertainty
±
Data ABMP16 CT14nnlo NNPDF3.1 MMHT14nnlo68CL ATLAS-epWZ12nnlo HERAPDF2.0nnlo (NNLO QCD, inner uncert.: PDF only)
170 180 190 200 210
[pb]
Z fid
σ
ATLAS
-1 = 2.76 TeV, 4.0 pb s
total uncertainty
±
Data
stat. uncertainty
±
Data ABMP16 CT14nnlo NNPDF3.1 MMHT14nnlo68CL ATLAS-epWZ12nnlo HERAPDF2.0nnlo (NNLO QCD, inner uncert.: PDF only)
9.6 9.8 10 10.2 10.4 10.6 10.8 11 11.2 11.4
Z fid
σ /
±
W fid
σ
ATLAS
-1
= 2.76 TeV, 4.0 pb s
total uncertainty
±
Data
stat. uncertainty
±
Data ABMP16 CT14nnlo NNPDF3.1 MMHT14nnlo68CL ATLAS-epWZ12nnlo HERAPDF2.0nnlo (NNLO QCD, inner uncert.: PDF only)
Z fid σ
/
± W fid σ
=
W/Z
R
1.5 1.55 1.6 1.65 1.7 1.75 1.8 1.85 1.9
-W fid
σ /
+ W fid
σ
ATLAS
-1
= 2.76 TeV, 4.0 pb s
total uncertainty
±
Data
stat. uncertainty
±
Data ABMP16 CT14nnlo NNPDF3.1 MMHT14nnlo68CL ATLAS-epWZ12nnlo HERAPDF2.0nnlo (NNLO QCD, inner uncert.: PDF only)
-W fid σ
/ +
W fid σ
=
-/W
+
W
R
Figure 4.The measured ratio of fiducial cross sections forWboson production toZboson production
(left),W+boson production toW−boson production (right). The measurements are compared with
theoretical predictions at NNLO in QCD based on a selection of different PDF sets. The inner shaded
band corresponds to the statistical uncertainty while the outer band shows statistical and systematic uncertainties added in quadrature. The theory predictions are given with the corresponding PDF (total) uncertainty shown by the inner (outer) error bar [4].
3.2 Vector-boson fusion/scattering production
Vector-boson fusion/scattering (VBF/VBS) processes are the rarest SM processes currently accessible to the LHC experiments. The cross sections of these processes are on the level of a few femtobarns or even lower. These processes are an extremely sensitive tool to test the SM predictions and search for anomalous boson couplings. Also, these processes represent the irreducible backgrounds for VBF Higgs production.
For these analyses, ATLAS is using several new common techniques:
• Due to difficult simulation of dominant backgrounds (especially its normalization), back-ground enriched control regions are used to constrain them;
• Extraction of the cross section is performed by simultaneous fit instead of simple counting;
• Machine learning techniques, like boosted decision trees (BDT), are used in order to sep-arate the electroweak (EWK) and strong (QCD) components (with QCD vertices in dia-grams) of the studied final states;
• The effective field theory approach is used to parametrize the anomalous couplings. First, the measurement of electroweak ZZ production using the full Run 2 dataset of 139 fb−1 [12] with √s = 13 TeV is discussed. The 4-lepton and the 2-lepton+2-neutrino modes were considered. The theoretical NLO SM prediction is in a good agreement with the measured integrated cross section of QCD+EWK components of theZZ production, as shown in Figure 5. To obtain the EWK cross section, the fitting of a BDT output distribution in the signal region (SR) was used. The measured cross section is equal to 0.82 fb, and the observed signal strength is about 1.35±0.34. The observed significance is 5.5σ, which constitutes the first observation of the EWKZZprocess. The dominant uncertainties for the measurement are from limited statistics, luminosity, and systematic uncertainties from the leptons and jets momentum scale and resolution.
9.6 9.8 10 10.2 10.4 10.6 10.8 11 11.2 11.4
Z fid
σ /
±
W fid
σ
ATLAS
-1
= 2.76 TeV, 4.0 pb s
total uncertainty
±
Data
stat. uncertainty
±
Data ABMP16 CT14nnlo NNPDF3.1 MMHT14nnlo68CL ATLAS-epWZ12nnlo HERAPDF2.0nnlo (NNLO QCD, inner uncert.: PDF only)
Z fid σ
/
± W fid σ
=
W/Z
R
1.5 1.55 1.6 1.65 1.7 1.75 1.8 1.85 1.9
-W fid
σ /
+ W fid
σ
ATLAS
-1
= 2.76 TeV, 4.0 pb s
total uncertainty
±
Data
stat. uncertainty
±
Data ABMP16 CT14nnlo NNPDF3.1 MMHT14nnlo68CL ATLAS-epWZ12nnlo HERAPDF2.0nnlo (NNLO QCD, inner uncert.: PDF only)
-W fid σ
/ +
W fid σ
=
-/W
+
W
R
Figure 4.The measured ratio of fiducial cross sections forWboson production toZboson production
(left),W+boson production toW−boson production (right). The measurements are compared with
theoretical predictions at NNLO in QCD based on a selection of different PDF sets. The inner shaded
band corresponds to the statistical uncertainty while the outer band shows statistical and systematic uncertainties added in quadrature. The theory predictions are given with the corresponding PDF (total) uncertainty shown by the inner (outer) error bar [4].
3.2 Vector-boson fusion/scattering production
Vector-boson fusion/scattering (VBF/VBS) processes are the rarest SM processes currently accessible to the LHC experiments. The cross sections of these processes are on the level of a few femtobarns or even lower. These processes are an extremely sensitive tool to test the SM predictions and search for anomalous boson couplings. Also, these processes represent the irreducible backgrounds for VBF Higgs production.
For these analyses, ATLAS is using several new common techniques:
• Due to difficult simulation of dominant backgrounds (especially its normalization), back-ground enriched control regions are used to constrain them;
• Extraction of the cross section is performed by simultaneous fit instead of simple counting;
• Machine learning techniques, like boosted decision trees (BDT), are used in order to sep-arate the electroweak (EWK) and strong (QCD) components (with QCD vertices in dia-grams) of the studied final states;
• The effective field theory approach is used to parametrize the anomalous couplings. First, the measurement of electroweak ZZ production using the full Run 2 dataset of 139 fb−1 [12] with √s = 13 TeV is discussed. The 4-lepton and the 2-lepton+2-neutrino modes were considered. The theoretical NLO SM prediction is in a good agreement with the measured integrated cross section of QCD+EWK components of theZZproduction, as shown in Figure 5. To obtain the EWK cross section, the fitting of a BDT output distribution in the signal region (SR) was used. The measured cross section is equal to 0.82 fb, and the observed signal strength is about 1.35±0.34. The observed significance is 5.5σ, which constitutes the first observation of the EWKZZ process. The dominant uncertainties for the measurement are from limited statistics, luminosity, and systematic uncertainties from the leptons and jets momentum scale and resolution.
The next measurement presented here is the electroweak Zγ production, based on 36.1 fb−1 of 13 TeV data [13]. Only electron and muon decays of theZ were considered. The theoretical SM prediction, obtained with the MG5_aMC@NLO [14] and Sherpa [15] MC generators, is in agreement with the measured integrated cross section of QCD+EWK components of theZγproduction:
500 1000 1500 2000 2500
[GeV] jj m 0
10 20 30 40 50 60
Events / 200 GeV ATLAS Preliminary
-1
= 13 TeV, 139 fb s
ℓ ℓ ℓ ℓjj
Signal Region
Data ZZ(EW) ZZ(QCD) ggZZ Others Uncertainty
500 1000 1500 2000 2500
[GeV] jj m 0
5 10 15 20 25 30 35 40
Events / 200 GeV ATLAS Preliminary-1
= 13 TeV, 139 fb s
ℓ ℓν νjj
Signal Region
Data ZZ(EW) Others ZZ(QCD) WZ NonRes ggZZ Uncertainty
Figure 5.Observed and expectedmjjdistributions in thej j(left) andννj j(right) signal regions.
The error bands include the expected experimental and theoretical uncertainties. The error bars on the data points show the statistical uncertainty on data. The contributions from the QCD and EWK
production ofZZ j jevents are scaled by 0.96 and 1.35, respectively, which correspond to the observed
normalization factors in the statistical fit to the combined channel. The last bins include the overflow events [12].
Measurement: σfid.
Zγj j=71±2 (stat.)+−97(exp.syst.)+−2117(mod.syst) fb;
Prediction: σZγfid.j jMadgraph+Sherpa=88.4±2.4 (stat.)±2.3 (PDF+αS)+−2919..41(scale) fb. Again, to obtain the EWK-only cross section, the fitting of the BDT output distribution in the SR was performed. The theoretical LO prediction is in good agreement with the measured signal cross section:
Measurement: σfid.
Zγj j=7.8+−11..54(stat.)+−10..90(syst.)+−10..08(mod.) fb;
Prediction: σfidZγ.Madgraphj j =7.75±0.03 (stat.)±0.20 (PDF+αS)±0.40 (scale) fb.
The observed significance is 4.1σ, which constitutes evidence from ATLAS of the EWK
Zγprocess. The dominant uncertainties for the measurement are from limited statistics, jet energy scale and from the heavy flavor tagging efficiency.
For the measurement of electroweak WZ production based on 36.1 fb−1 of 13 TeV data [16], only leptonic decay modes of the bosons were considered. The theoretical pre-diction obtained with Sherpa is in agreement with the measured integrated cross section of QCD+EWK components ofWZproduction:
Measurement: σfid.
W±Z j j =1.68±0.16 (stat.) ±0.12 (exp.syst.) ±0.13 (mod.syst.) ±0.44
(lumi.) fb;
Prediction: σfidW±.SherpaZ j j =2.15±0.01 (stat.)±0.05 (PDF)+−00..6544(scale) fb.
After the fitting of the BDT output distribution in the SR, the MC LO prediction, obtained with Sherpa, is in fair agreement with the measured signal EWK-only cross section:
Measurement: σfid.
W±Z j j = 0.57 +−00..1413 (stat.) −+00..0504 (exp.syst.) −+00..0504 (mod.syst.) +−00..0101
(lumi.) fb;
The observed significance is 5.3σ, which constitutes the first observation of the EWKWZ process. Differential cross sections of QCD+EWK components were measured as a function of several observables, one of them is shown in Figure 6. The dominant uncertainties for the measurement are from limited statistics, and systematic uncertainties from the jet energy scale and MC modelling.
500 1000 1500 2000 [fb/GeV]jj
m
∆
/
fid.
σ
∆ −3 10
2
−
10
Data Sherpa (scaled)
1.77 × WZjj-EW
0.56 × WZjj-QCD
ATLAS -1
= 13 TeV, 36.1 fb s
jj
ν
→
Zjj
±
W ℓ ′ ℓ ℓ
[fb]
fid
σ
∆
1
−
10 1
[GeV]
jj
m
500 1000 1500 2000
Ratio to Sherpa
0 0.5 1 1.5 2
1500
≥
0 1 2 3
[fb/rad]jj
φ
∆
/
fid.
σ
∆
1
−
10 1
Data Sherpa (scaled)
1.77 × WZjj-EW
0.56 × WZjj-QCD
ATLAS -1
= 13 TeV, 36.1 fb s
jj
ν
→
Zjj
±
W ℓ ′ ℓ ℓ
[rad]
jj
φ ∆
0 1 2 3
Ratio to Sherpa
0 0.5 1 1.5
Figure 6.The measuredW±Z j jdifferential cross section in the VBS fiducial phase space as a function
of the invariant mass of the tagged jetsmjj(left) and the azimuthal angle between the two tagged jets∆φjj
(right). The inner and outer error bars on the data points represent the statistical and total uncertainties,
respectively. The measurements are compared with the sum of the rescaledWZjj-QCD andWZjj-EWK
predictions from Sherpa (solid line). TheWZjj-EWK andWZjj-QCD contributions are also represented
by dashed and dashed-dotted lines, respectively. In (left), the righty-axis refers to the last cross-section point, separated from the others by a vertical dashed line, as this last bin is integrated up to the maximum value reached in the phase space. The lower panels show the ratios of the data to the predictions from Sherpa [16].
The measurement of the electroweak same-signWWproduction is also based on 36.1 fb−1 of 13 TeV data [17]. Only leptonic decay modes of theWboson were considered. To obtain the EWK cross section,mjjdistribution in the SR was fitted. The observed signal strength is 1.44±0.38, and the observed significance is 6.5σ, which constitutes an observation by AT-LAS of the EWK same-signWWprocess. The dominant uncertainties for the measurement are from limited statistics, and systematic uncertainties from MC modelling and the estima-tion of the background from misidentified leptons.
In summary, it should be noted that such rare processes are accessible for measurement only at the LHC experiments, and most of them have been observed within the last 5 years. At the time of writing, onlyZγandWγprocesses are yet to be observed.
3.3 Diboson and triboson production
The observed significance is 5.3σ, which constitutes the first observation of the EWKWZ
process. Differential cross sections of QCD+EWK components were measured as a function
of several observables, one of them is shown in Figure 6. The dominant uncertainties for the measurement are from limited statistics, and systematic uncertainties from the jet energy scale and MC modelling.
500 1000 1500 2000
[fb/GeV]jj m ∆ / fid. σ
∆ −3
10 2 − 10 Data Sherpa (scaled) 1.77 × WZjj-EW 0.56 × WZjj-QCD ATLAS -1
= 13 TeV, 36.1 fb s jj ν → Zjj ±
W ℓ ′ ℓ ℓ
[fb] fid σ ∆ 1 − 10 1 [GeV] jj m
500 1000 1500 2000
Ratio to Sherpa
0 0.5 1 1.5 2 1500 ≥
0 1 2 3
[fb/rad] jj φ ∆ / fid. σ ∆ 1 − 10 1 Data Sherpa (scaled) 1.77 × WZjj-EW 0.56 × WZjj-QCD ATLAS -1
= 13 TeV, 36.1 fb s jj ν → Zjj ±
W ℓ ′ ℓ ℓ
[rad] jj φ ∆
0 1 2 3
Ratio to Sherpa
0 0.5 1 1.5
Figure 6.The measuredW±Z j jdifferential cross section in the VBS fiducial phase space as a function
of the invariant mass of the tagged jetsmjj(left) and the azimuthal angle between the two tagged jets∆φjj
(right). The inner and outer error bars on the data points represent the statistical and total uncertainties, respectively. The measurements are compared with the sum of the rescaledWZjj-QCD andWZjj-EWK predictions from Sherpa (solid line). TheWZjj-EWK andWZjj-QCD contributions are also represented by dashed and dashed-dotted lines, respectively. In (left), the righty-axis refers to the last cross-section point, separated from the others by a vertical dashed line, as this last bin is integrated up to the maximum value reached in the phase space. The lower panels show the ratios of the data to the predictions from Sherpa [16].
The measurement of the electroweak same-signWWproduction is also based on 36.1 fb−1
of 13 TeV data [17]. Only leptonic decay modes of theWboson were considered. To obtain
the EWK cross section,mjjdistribution in the SR was fitted. The observed signal strength
is 1.44±0.38, and the observed significance is 6.5σ, which constitutes an observation by
AT-LAS of the EWK same-signWWprocess. The dominant uncertainties for the measurement
are from limited statistics, and systematic uncertainties from MC modelling and the estima-tion of the background from misidentified leptons.
In summary, it should be noted that such rare processes are accessible for measurement only at the LHC experiments, and most of them have been observed within the last 5 years.
At the time of writing, onlyZγandWγprocesses are yet to be observed.
3.3 Diboson and triboson production
Multiboson production is an important high precision test of the SM. In addition, diboson processes are the main backgrounds for VBS and Higgs measurements.
The measurement ofZγproduction based on the full Run 2 dataset has used only electron
and muon decays of theZboson [18]. The goal of this study is the measurement of differential
cross sections (as a function ofEγ
T,ηγ,mllγ andpllTγ). The MATRIX [19] NNLO theoretical predictions are in a good agreement with the data, as shown in Figure 7. The dominant uncertainties for the measurement are from limited statistics, and systematic uncertainties
related to theZ+jets background estimation and the photon efficiency.
0 2 4 6 8 10 12 3 − 10 2 − 10 1 − 10 1 10 2 10 ] -1 GeV ⋅
[fbγ T
dE σ d MATRIX NNLO MATRIX NLO Data MATRIX NNLO MATRIX NLO Data MATRIX NNLO MATRIX NLO Data ATLAS Preliminary 1 −
= 13 TeV, 139 fb s γ ll) → Z( [GeV] γ T E 0.8 1 Pred./Data
30 40 50 60 70 80 100 120 150 200 300 500 1200 30 40 50 60 70 80 100 120 150 200 300 500 1200 30 40 50 60 70 80 100 120 150 200 300 500 1200
0 1 2 3 4 5 6 7 8 9 2 − 10 1 − 10 1 10 ] -1 GeV ⋅
[fbγll T
dp σ d MATRIX NNLO MATRIX NLO Data MATRIX NNLO MATRIX NLO Data MATRIX NNLO MATRIX NLO Data ATLAS Preliminary 1 −
= 13 TeV, 139 fb s γ ll) → Z( [GeV] γ ll T p 0.4 0.6 0.8 1 1.2 Pred./Data
0 15 20 30 40 50 70 100 200 1500
0 15 20 30 40 50 70 100 200 1500
0 15 20 30 40 50 70 100 200 1500
Figure 7.Measured fiducial cross sections (black data points) for the observablesEγ
T(left) andpT(γ)
(right) for thepp→Z(→+−)γprocess. The measured cross sections are compared with SM
expec-tations obtained from the MATRIX parton-level generator, corrected to particle level. The error bars on the data points show the statistical uncertainty on the measured values. The grey shaded regions show the total uncertainty on the unfolded data, excluding the uncertainty on the integrated luminosity. The purple and green hatched regions show the total uncertainty on the MATRIX predictions. The lower section of each plot shows the ratio of the SM expectation to the measured cross section [18].
In this analysis, there is a possibility that aZand a photon are produced, originating from
different primary vertices, which leads to an additional pile-up background. This background
was found to contribute 5% to the total event yield.
AnotherZγproduction measurement with theZboson decaying into neutrinos was
per-formed with 36.1 fb−1of 13 TeV data [20]. The theoretical NNLO MCFM [21] predictions
are in good agreement with the measured integrated cross sections in inclusive and exclusive fiducial volumes:
Measurement (inclusive): σext.fid.
Z(νν)γ=83.7
+3.6
−3.5(stat.)−+66..92(syst.)+−12..70(lumi.) fb;
Prediction (inclusive): σext.fid.MCFM
Z(νν)γ =78.1±0.2 (stat.)±4.7 (syst.) fb.
The measurement of differential cross sections were performed as a function of pγT, jet
multiplicity andEmiss
T , which are in agreement with the NNLO MCFM predictions, as shown
in Figure 8.
Limits on anomalous neutral triple gauge couplings (ZZγandZγγ) were set, as shown in
Table 1. The obtained limits are the best ones on neutral aTGCs at the time of writing.
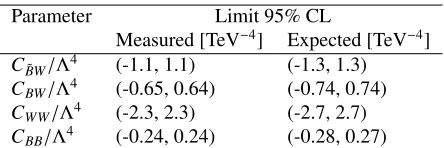
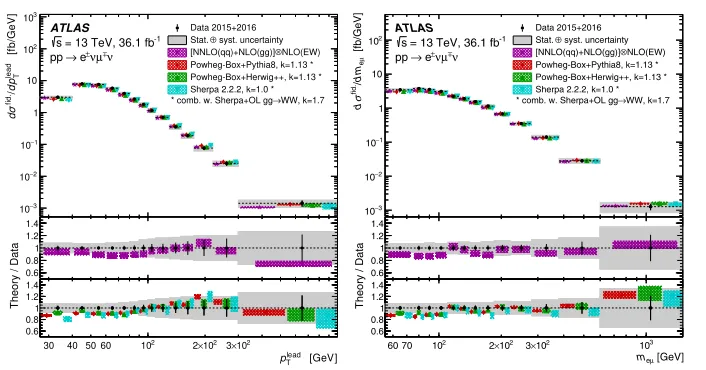
A further measurement is that of WW production at 13 TeV [22]. Integrated and
dif-ferential cross sections were measured, which are in agreement with the MATRIX NNLO prediction, as shown in Figure 9. Limits on the anomalous couplings were also set, as shown in Table 2.
Finally, the latest triboson analysis ofWVVproduction [25] is presented. The final states
[fb/GeV]
νν T
dp
]
γ
)
νν
Z(
→
[pp
σ
d
4
−
10 3
−
10 2
−
10 1
−
10 1 10
Data with full unc. Data stat. unc. Sherpa (NNPDF3.0) NNLO MCFM
-1
= 13 TeV, 36.1 fb s
0
≥
jets
N
ATLAS
[GeV]
ν ν
T
p
Data
Theory
0.5 1 1.5
150 200 250 350 450 600 1100
[fb]
jets
dN
]
γ
)
νν
Z(
→
[pp
σ
d
1
−
10 1 10 2 10
Data with full unc. Data stat. unc. Sherpa (NNPDF3.0) NNLO MCFM
-1
= 13 TeV, 36.1 fb s
ATLAS
jets
N
Data
Theory
0.5 1 1.5
0 1 2 >2
Figure 8.The measured (points with error bars) and predicted differential cross sections as a function
ofpνν
T (left) andNjets(right) for the pp→Z(νν)γprocess. The error bars on the data points show the
sum in quadrature of the statistical and systematic uncertainties. The MCFM NNLO predictions are shown with shaded bands that indicate the theoretical uncertainties. The lower plots show the ratios of the SM expectation to the measured values (shaded bands), with the error bars on the points showing the relative uncertainties in the experimental measurements [20].
Table 1.Observed and expected one-dimensional 95% CL limits on theCBW˜ /Λ4,CBW/Λ4,CWW/Λ4
andCBB/Λ4EFT parameters, assuming that any excess in data over the SM expectation is due solely to
a non-zero value of the parameterCBW˜ /Λ4,CBW/Λ4,CWW/Λ4orCBB/Λ4. For each row, all parameters
other than the one under study are set to 0 [20].
Parameter Limit 95% CL
Measured [TeV−4] Expected [TeV−4]
CBW˜ /Λ4 (-1.1, 1.1) (-1.3, 1.3)
CBW/Λ4 (-0.65, 0.64) (-0.74, 0.74)
CWW/Λ4 (-2.3, 2.3) (-2.7, 2.7)
CBB/Λ4 (-0.24, 0.24) (-0.28, 0.27)
Table 2.The expected and observed 95% CL intervals for the anomalous coupling parameters of the EFT model [22].
Parameter Limit 95% CL
Measured [TeV−2] Expected [TeV−2]
CWWW/Λ2 (-3.4, 3.3) (-3.0, 3.0)
CW/Λ2 (-7.4, 4.1) (-6.4, 5.1)
CB/Λ2 (-21, 18) (-18, 17)
CWWW˜ /Λ2 (-1.6, 1.6) (-1.5, 1.5)
CW˜/Λ2 (-76, 76) (-91, 91)
[fb/GeV] νν T dp ] γ ) νν Z( → [pp σ d 4 − 10 3 − 10 2 − 10 1 − 10 1 10
Data with full unc. Data stat. unc. Sherpa (NNPDF3.0) NNLO MCFM
-1
= 13 TeV, 36.1 fb s 0 ≥ jets N ATLAS [GeV] ν ν T p Data Theory 0.5 1 1.5
150 200 250 350 450 600 1100
[fb] jets dN ] γ ) νν Z( → [pp σ d 1 − 10 1 10 2 10
Data with full unc. Data stat. unc. Sherpa (NNPDF3.0) NNLO MCFM
-1
= 13 TeV, 36.1 fb s ATLAS jets N Data Theory 0.5 1 1.5
0 1 2 >2
Figure 8.The measured (points with error bars) and predicted differential cross sections as a function
ofpνν
T (left) andNjets(right) for the pp→Z(νν)γprocess. The error bars on the data points show the
sum in quadrature of the statistical and systematic uncertainties. The MCFM NNLO predictions are shown with shaded bands that indicate the theoretical uncertainties. The lower plots show the ratios of the SM expectation to the measured values (shaded bands), with the error bars on the points showing the relative uncertainties in the experimental measurements [20].
Table 1.Observed and expected one-dimensional 95% CL limits on theCBW˜ /Λ4,CBW/Λ4,CWW/Λ4
andCBB/Λ4EFT parameters, assuming that any excess in data over the SM expectation is due solely to
a non-zero value of the parameterCBW˜ /Λ4,CBW/Λ4,CWW/Λ4orCBB/Λ4. For each row, all parameters
other than the one under study are set to 0 [20].
Parameter Limit 95% CL
Measured [TeV−4] Expected [TeV−4]
CBW˜ /Λ4 (-1.1, 1.1) (-1.3, 1.3)
CBW/Λ4 (-0.65, 0.64) (-0.74, 0.74)
CWW/Λ4 (-2.3, 2.3) (-2.7, 2.7)
CBB/Λ4 (-0.24, 0.24) (-0.28, 0.27)
Table 2.The expected and observed 95% CL intervals for the anomalous coupling parameters of the EFT model [22].
Parameter Limit 95% CL
Measured [TeV−2] Expected [TeV−2]
CWWW/Λ2 (-3.4, 3.3) (-3.0, 3.0)
CW/Λ2 (-7.4, 4.1) (-6.4, 5.1)
CB/Λ2 (-21, 18) (-18, 17)
CWWW˜ /Λ2 (-1.6, 1.6) (-1.5, 1.5)
CW˜/Λ2 (-76, 76) (-91, 91)
WWZ→νν,WZZ→qq, (where=e/µ). The main backgrounds for this measure-ment come fromWZ+jets and processes containing non-prompt leptons. The measurement of the integrated cross section was performed for all the final states. The prediction is in agree-ment with the measured cross sections, as shown in Figure 10. The combination of studied final states gives an observed significance of 4.1σ, providing evidence for this process.
3 − 10 2 − 10 1 − 10 1 10 2 10 3 10 dσ fid./ dp le ad ℓ T [fb /G eV ] Data 2015+2016 syst. uncertainty ⊕ Stat. NLO(EW) ⊗ [NNLO(qq)+NLO(gg)] Powheg-Box+Pythia8, k=1.13 * Powheg-Box+Herwig++, k=1.13 * Sherpa 2.2.2, k=1.0 *
WW, k=1.7
→
* comb. w. Sherpa+OL gg
ATLAS
-1 = 13 TeV, 36.1 fb s ν ± µ ν ± e → pp 0.6 0.8 1 1.2 1.4
30 40 50 60 102 2×10² 3×10² pleadℓ
T [GeV] 0.6 0.8 1 1.2 1.4
Theory / Data
3 − 10 2 − 10 1 − 10 1 10 2 10 [fb/GeV]µ e m d/ fid. σ d Data 2015+2016 syst. uncertainty ⊕ Stat. NLO(EW) ⊗ [NNLO(qq)+NLO(gg)] Powheg-Box+Pythia8, k=1.13 * Powheg-Box+Herwig++, k=1.13 * Sherpa 2.2.2, k=1.0 *
WW, k=1.7
→
* comb. w. Sherpa+OL gg
ATLAS
-1 = 13 TeV, 36.1 fb s ν ± µ ν ± e → pp 0.6 0.8 1 1.2 1.4
60 70 102 2×10² 3×10² 103 [GeV] µ e m 0.6 0.8 1 1.2 1.4
Theory / Data
Figure 9.Measured fiducial cross sections ofWW→eµproductionplead
T (left) andmeµ(right). The
measured cross section values are shown as points with error bars giving the statistical uncertainty and solid bands indicating the size of the total uncertainty. The results are compared with the NNLO
prediction with extra NLO EWK corrections and NLO corrections forgg→WWproduction, and with
NLO+PS predictions from Powheg-Box+Pythia 8 [23], Powheg-Box+Herwig++[24] and Sherpa 2.2.2
forqq¯initial states, combined with Sherpa+Openloops (LO+PS) for thegginitial states. All threeqq¯
NLO+PS predictions are normalized to the NNLO theoretical prediction for the total cross section, with
theggLO+PS contribution normalized to NLO. The theoretical predictions are indicated as markers
with hatched bands denoting PDF+scale uncertainties [22].
4 Direct photon production
The study of direct photons is a test of perturbative QCD with a hard colourless probe. Also, it is a testground for different MC models of prompt-photon production.
The ATLAS Collaboration has performed measurements of differential cross-section ra-tios for direct photons at different collision energies [26]. The first ratio, Rγ
13/8, shown on the left of Figure 11, is the ratio of the photon cross section measured at √s = 13 TeV to that at 8 TeV. The second,Dγ/Z13/8, is shown on the right of Figure 11, and is the double ratio given byRγ
13/8divided by the analogous ratio forZboson production. The theoretical predic-tions are in agreement with the data in most of the bins. Since some systematic uncertainties cancel in the ratios, the photon energy scale error becomes comparable to other systematic contributions.
0 2 4 6 8
SM WVV
σ /
WVV
σ = µ best fit Combined
WVZ 4ℓ
WVZ 3ℓ
WWW 3ℓ
WWW 2ℓ µ = 2.13 +−0.620.57 0.39
+
0.38
−
= 0.47
µ +−0.540.47 0.49
+
0.44
−
= 0.42
µ +−0.980.92 0.49
+
0.47
−
= 2.44
µ +−0.920.83 0.83
+
0.75
−
= 1.40
µ +−0.390.37 0.25
+
0.24
−
ATLAS s = 13 TeV, 79.8 fb-1
tot.
stat. CombinedComb. stat.Comb. tot. tot stat
Figure 10. Extracted signal strengthsµfor the four analysis regions ofWVVproduction and for the combination [25].
5 Jet physics
Study of hadronic jets provides an advanced way to test QCD. Jet measurements are sensitive to the strong coupling and proton PDFs, and it is possible to explore the evolution of high energy quarks and gluons into hadrons. It can be also used to understand the origin of jets from the light quarks, gluons or hadronic decays of some heavy particles.
The first measurement discussed here is dedicated to studies of jet internal substruc-ture [29]. Using √s=13 TeV data, measurements of several jet substructure observables for trimmed and soft drop jets, were performed. The full list of variables and the details about each can be found in the published paper [29]. Differential cross sections were measured and compared to MC generator predictions. As shown in Figure 13, the data is best described by Madgraph5+Pythia8, though none of the generator predictions is able to completely model the data.
ATLAS has also produced a "Lund plane" measurement [30], which provides information on the internal structure and formation of jets. The main idea is that the jet may be approxi-mated as soft emissions around a hard core, which represents the originating quark or gluon. So the Lund plane is defined as: ln(1/z) versus ln(1/θ), wherezis the relative momentum of the emission with respect to the jet core andθis the opening angle of emission to the jet core. The measurement of the differential cross section of the Lund plane was performed, and is shown in Figure 14.
The Lund plane naturally factorizes perturbative and non-perturbative effects, the under-lying event, etc. One of the most important applications of the Lund plane is the possibility to use it in the machine-learning-based discriminants.
0 5 10 15
13/8
γ
R
ATLAS
-1 and 13 TeV, 3.2 fb -1
8 TeV, 20.2 fb Data
NLO QCD (JETPHOX): MMHT2014
| < 0.6
γ η
|
200 300 400 1000
[GeV]
γ T
E 0.6
0.8 1 1.2 1.4
Theory/Data
CT14 NNPDF3.0 HERAPDF2.0 ABMP16
125
0 2 4 6 8 10
13/8
/Z
γ
D
ATLAS
-1 and 13 TeV, 3.2 fb -1
8 TeV, 20.2 fb Data
(JETPHOX);
γ
NLO QCD for
NNLO QCD for Z (DYTURBO): MMHT2014nnlo
| < 0.6
γ η
|
200 300 400 1000
[GeV]
γ T
E 0.6
0.8 1 1.2 1.4
Theory/Data
CT14nnlo NNPDF3.0nnlo HERAPDF2.0nnlo
125
Figure 11.The measuredRγ
13/8(left) andD
γ/Z
13/8(right) as a function ofE
γ
Tin|ηγ|<0.6 region. The NLO
QCD predictions based on the MMHT2014 PDFs (black lines) are also shown. The inner (outer) error bars represent the statistical (total) uncertainties. The shaded band represents the theoretical uncertainty in the predictions. The lower part of the figures shows the ratio of the NLO QCD predictions based on
the MMHT2014 PDFs to the measuredRγ
13/8orD
γ/Z
13/8(black lines) [26].
6 Forward physics
As described in section 2, ATLAS has forward detectors such as ALFA. The latest mea-surement from the forward program is the meamea-surement of single diffractive dissociation at
√s
=8 TeV [31].
The study of soft QCD is well motivated. Since most of the diffraction kinematics is characterized by the soft scales, it can not be described by pQCD, and it is therefore an im-portant tool to probe the strong interaction in the non-perturbative regime. Phenomenological pomeron models are used to describe the interactions in the diffraction studies. The special LHC runs with highβ∗, which corresponds to the weaker focusing of the hadron beams, are performed for diffraction physics measurements.
The result of the study is the measurement of differential cross sections as a function of a number of variables that characterize diffractive dissociation: the squared four-momentum transfer of the proton (t); the momentum fraction of the proton carried by the pomeron (ξ); and the (pseudo)rapidity gap from the edge of the tracker (∆η).
The results are shown in Figure 15. For the rapidity gap (shown on the left), the MC models give a reasonable description of the shape, though do not describe the overall cross-section normalization. For the other observables, an exponential model was used and the slope measured, as shown on the right of Figure 15. The exponential slope parameter value, predicted by Pythia8 with the A2 tune to be 7.82 GeV−2, is compatible with the measurement,
200 300
1000
2000
[GeV]
γ
T
E
10 −
10
9 −
10
8 −
10
7 −
10
6 −
10
5 −
10
4 −
10
3 −
10
2 −
10
1 −
10
1
10
2
10
[pb/GeV]
γ T
/dE
σ
d
ATLAS
-1
= 13 TeV, 36.1 fb s
Data:
)
0
| < 0.6 (x10
γ
η |
NNLOJET
(NNLO QCD, NNPDF3.1)
unc. from NLO JETPHOX) s
α
(PDF and
SHERPA
(ME+PS@NLO QCD, NNPDF3.0) JETPHOX
(NLO QCD, MMHT2014) ATLAS
-1
= 13 TeV, 36.1 fb s
Data:
)
-1
| < 1.37 (x10
γ
η 0.6 < |
NNLOJET
(NNLO QCD, NNPDF3.1)
unc. from NLO JETPHOX) s
α
(PDF and
SHERPA
(ME+PS@NLO QCD, NNPDF3.0) JETPHOX
(NLO QCD, MMHT2014) ATLAS
-1
= 13 TeV, 36.1 fb s
Data:
)
-2
| < 1.81 (x10
γ
η 1.56 < |
NNLOJET
(NNLO QCD, NNPDF3.1)
unc. from NLO JETPHOX) s
α
(PDF and
SHERPA
(ME+PS@NLO QCD, NNPDF3.0) JETPHOX
(NLO QCD, MMHT2014) ATLAS
-1
= 13 TeV, 36.1 fb s
Data:
)
-3
| < 2.37 (x10
γ
η 1.81 < |
NNLOJET
(NNLO QCD, NNPDF3.1)
unc. from NLO JETPHOX) s
α
(PDF and
SHERPA
(ME+PS@NLO QCD, NNPDF3.0) JETPHOX
(NLO QCD, MMHT2014)
Figure 12. The measured differential cross section for isolated-photon production as a function of Eγ
T in|ηγ| < 0.6 (black dots), 0.6 < |ηγ| < 1.37 (open circles), 1.56 < |ηγ| < 1.81 (black squares)
and 1.81 < |ηγ| < 2.37 (open squares). The NLO pQCD prediction from JETPHOX [28], the
ME+PS@NLO QCD prediction from Sherpa 2.2.2 and the NNLO QCD prediction from NNLOJET are
also shown. The measurement and the predictions are normalised by the factors shown in parentheses to aid visibility. The error bars represent the data statistical uncertainties and systematic uncertainties added in quadrature. For most of the points, the error bars are smaller than the marker size and, thus, not visible. The bands represent the theoretical uncertainty associated with the predictions; in the case
of NNLOJET, the uncertainties due to the PDFs andαsare estimated at NLO with JETPHOX [27].
7 Conclusions
Tests of the Standard Model, using the ATLAS experiment at the LHC, include the measure-ment of cross sections over 14 orders of magnitude, as shown in Figure 16, ranging from inclusive proton-proton and jets cross sections, through to the rare triboson and VBS pro-cesses.
Early ATLAS full Run 2 analyses and precision Run 1 analyses provide very stringent tests of SM.
200 300
1000
2000
[GeV]
γ TE
10 −10
9 −10
8 −10
7 −10
6 −10
5 −10
4 −10
3 −10
2 −10
1 −10
1
10
210
[pb/GeV]
γ T/dE
σ
d
ATLAS -1 = 13 TeV, 36.1 fb sData:
)
0
| < 0.6 (x10 γ
η |
NNLOJET
(NNLO QCD, NNPDF3.1)
unc. from NLO JETPHOX)
s α
(PDF and
SHERPA
(ME+PS@NLO QCD, NNPDF3.0) JETPHOX
(NLO QCD, MMHT2014)
ATLAS
-1 = 13 TeV, 36.1 fb s
Data:
)
-1
| < 1.37 (x10 γ
η 0.6 < |
NNLOJET
(NNLO QCD, NNPDF3.1)
unc. from NLO JETPHOX)
s α
(PDF and
SHERPA
(ME+PS@NLO QCD, NNPDF3.0) JETPHOX
(NLO QCD, MMHT2014)
ATLAS
-1 = 13 TeV, 36.1 fb s
Data:
)
-2
| < 1.81 (x10 γ
η 1.56 < |
NNLOJET
(NNLO QCD, NNPDF3.1)
unc. from NLO JETPHOX)
s α
(PDF and
SHERPA
(ME+PS@NLO QCD, NNPDF3.0) JETPHOX
(NLO QCD, MMHT2014)
ATLAS
-1 = 13 TeV, 36.1 fb s
Data:
)
-3
| < 2.37 (x10 γ
η 1.81 < |
NNLOJET
(NNLO QCD, NNPDF3.1)
unc. from NLO JETPHOX)
s α
(PDF and
SHERPA
(ME+PS@NLO QCD, NNPDF3.0) JETPHOX
(NLO QCD, MMHT2014)
Figure 12. The measured differential cross section for isolated-photon production as a function of
Eγ
T in|ηγ| < 0.6 (black dots), 0.6 <|ηγ| < 1.37 (open circles), 1.56 < |ηγ| <1.81 (black squares)
and 1.81 < |ηγ| < 2.37 (open squares). The NLO pQCD prediction from JETPHOX [28], the ME+PS@NLO QCD prediction from Sherpa 2.2.2 and the NNLO QCD prediction from NNLOJET are
also shown. The measurement and the predictions are normalised by the factors shown in parentheses to aid visibility. The error bars represent the data statistical uncertainties and systematic uncertainties added in quadrature. For most of the points, the error bars are smaller than the marker size and, thus, not visible. The bands represent the theoretical uncertainty associated with the predictions; in the case of NNLOJET, the uncertainties due to the PDFs andαsare estimated at NLO with JETPHOX [27].
7 Conclusions
Tests of the Standard Model, using the ATLAS experiment at the LHC, include the measure-ment of cross sections over 14 orders of magnitude, as shown in Figure 16, ranging from inclusive proton-proton and jets cross sections, through to the rare triboson and VBS pro-cesses.
Early ATLAS full Run 2 analyses and precision Run 1 analyses provide very stringent tests of SM.
New SM measurements covering a variety of topics have been presented. Electroweak measurements give results which are consistent with the SM, and several rare SM processes have been observed. Photon measurements demonstrate good agreement with NNLO QCD predictions, and can be used to provide the input for improving MC photon production mod-els. Measurements of the jet shape observables and the Lund plane are promising for taggers.
Diffractive proton-proton cross sections have been measured for the first time, and are found
ATLAS √s = 13 TeV, 33 fb–1
Dijet selection Anti-ktR = 1.0, pT>450 GeV
Soft dropβ= 0 , zcut= 0.1
Data Pythia8 Herwig7 Sherpa (cluster) Sherpa (string) 0 0.1 0.2 0.3 0.4 0.5 0.6 0.7 0.8 0.9 1 1 σ d σ d(D 2 )
0 0.5 1 1.5 2 2.5 3 3.5 4 4.5
0.8 0.9 1 1.1 1.2 1.3 D2 M C/ Da ta ATLAS
√s = 13 TeV, 33 fb–1 W selection
Data Powheg+Pythia8 Powheg+Herwig7 MG5 aMC+Pythia8 Sherpa 0 0.2 0.4 0.6 0.8 1 1.2 1.4 1 σ d σ d(D 2 )
Anti-ktR = 1.0, pT>200 GeV Soft dropβ= 0 , zcut= 0.1
0 0.5 1 1.5 2 2.5
0.6 0.81 1.2 1.4 1.6 1.8 D2 M C/ Da ta
Figure 13. The distributions ofD2 compared with different MC predictions for soft-dropped
large-radius jets from dijet (left) andW(right) selections. For the dijet selection, Sherpa is tested with two different hadronisation models. Data are compared between the soft-dropped large-radius jets for the
selections mentioned above. The shaded bands represent the total uncertainty, while the error bars show the statistical uncertainty [29].
0 0.01 0.02 0.03 0.04 0.05 0.06 0.07 0.08 ) R ∆ / R
) d ln(z
d ln(1/ / emissions N 2 d jets 1/N
0 0.5 1 1.5 2 2.5 3 3.5 4 4.5 5
) R ∆ / R ln( 1 2 3 4 5 6 ) z ln(1/
ATLAS Preliminary s = 13 TeV, 139 fb-1
2 − 10 1 − 10 ) core T p + emission T p / ( emission T p = z 2 − 10 1 − 10 (emission, core) R ∆ = R ∆
Figure 14.The Lund jet plane as measured using jets in 13 TeVppcollision data, corrected to
Figure 15. Left: Hadron level differential cross section as a function of∆R, comparing the measured
data with Pythia8 and Herwig7 predictions. The error bars display the combination of statistical and
systematic uncertainties in quadrature. Right: The differential cross section as a function of|t|with
inner error bars representing statistical uncertainties and outer error bars displaying the statistical and systematic uncertainties added in quadrature [31].
pp total (2x)
inelastic
Jets dijets incl
γ pT>125 GeV
nj≥3 pT>25 GeV
nj≥1
nj≥2
pT>100 GeV
W nj≥2
nj≥3
nj≥5 nj≥1
nj≥6
nj≥7 nj≥4 nj≥0
Z nj≥0
nj≥7 nj≥6 nj≥4 nj≥3 nj≥2 nj≥1
nj≥5
t¯t total
nj≥6 nj≥5 nj≥4
nj≥7
nj≥8
t
tot. tZj
Wt t-chan
s-chan
VV
tot. WW
WZ
ZZ WW
WZ
ZZ WW
WZ
ZZ
γγ H VH
H→bb
total
ggF H→WW
H→ZZ→4 VBF H→WW
H→γγ
H→ττ
WV Vγ
Zγ Wγ
t¯tW
tot. t¯tZ
tot. t¯tH
tot.
t¯tγ γγγ Vjj EWK Zjj
Wjj
WW Excl.
tot.Zγγ
Wγγ
WWγ
Zγjj VVjj
EWK W±W±
WZ
10−3
10−2
10−1
1
101
102
103
104
105
106
1011
σ
[pb]
Status: July 2019
ATLAS Preliminary
Run 1,2√s= 5,7,8,13TeV
Theory
LHC pp√s= 5TeV
Data0.025fb−1
LHC pp√s= 7TeV
Data4.5−4.9fb−1
LHC pp√s= 8TeV
Data20.2−20.3fb−1
LHC pp√s= 13TeV
Data3.2−79.8fb−1
Standard Model Production Cross Section Measurements
Figure 16. Summary of several Standard Model total and fiducial production cross section measure-ments, corrected for branching fractions, compared to the corresponding theoretical expectations [2].
to be in agreement with the theoretical models. Deviations from SM expectations, such as anomalous couplings, have not been observed, and strong limits have been obtained.
Many different analyses based on the full Run 2 dataset are still in progress and the results of new, strong tests of the SM will become available soon.
8 Acknowledgements
The reported study was funded by RFBR according to the research project N 18-32-20160.
References
[1] ATLAS Collaboration, JINST3, S08003 (2008)
[2] https://twiki.cern.ch/twiki/bin/view/AtlasPublic/StandardModelPublicResults [3] ATLAS Collaboration, https://arxiv.org/abs/1907.06728
[4] ATLAS Collaboration, https://arxiv.org/abs/1907.03567 [5] R. Gauld et al., JHEP1711, 003 (2017)
[6] S. Dulat et al., Phys. Rev. D93, 033006 (2016)
[7] L. A. Harland-Lang et al., Eur. Phys. J. C75, 204 (2015) [8] R. D. Ball et al., Eur. Phys. J. C77, 663 (2017)
[9] ATLAS Collaboration, Phys. Rev. Lett.109, 012001 (2012) [10] S. Alekhin et al., Phys. Rev. D96, 014011 (2017)
[11] H1 and ZEUS Collaborations, Eur. Phys. J. C75, 580 (2015)
[12] ATLAS Collaboration, ATLAS-CONF-2019-033, http://cdsweb.cern.ch/record/2682845 [13] ATLAS Collaboration, https://arxiv.org/abs/1910.09503
[14] J. Alwall et al., JHEP1407, 158 (2014) [15] T. Gleisberg et al., JHEP0902, 007 (2009)
[16] ATLAS Collaboration, Phys. Lett. B793, 469 (2019) [17] ATLAS Collaboration, Phys. Rev. Lett.123, 161801 (2019)
[18] ATLAS Collaboration, ATLAS-CONF-2019-034, http://cdsweb.cern.ch/record/2682846 [19] M. Grazzini et al., Eur. Phys. J. C78, 537 (2018)
[20] ATLAS Collaboration, JHEP1812, 010 (2018) [21] J. M. Campbell et al., JHEP1107, 018 (2011)
[22] ATLAS Collaboration, https://arxiv.org/abs/1905.04242 [23] T. Sjöstrand et al., Comput. Phys. Commun.191, 159 (2015) [24] M. Bahr et al., Eur. Phys. J. C58, 639 (2008)
[25] ATLAS Collaboration, Phys. Lett. B798, 134913 (2019) [26] ATLAS Collaboration, JHEP1804, 093 (2019)
[27] ATLAS Collaboration, Phys. Lett. B780, 578 (2018) [28] S. Catani et al., JHEP0205, 028 (2002)
[29] ATLAS Collaboration, JHEP1908, 033 (2019)

![Figure 3.NNLO predictions for the fiducial cross sections σfidW (left) and σfidZ(right) for the sixPDFs: CT14nnlo [6], MMHT2014 [7], NNPDF3.1 [8], ATLASepWZ12 [9], ABMP16 [10] and HER-Apdf2.0 [11] compared with the measured fiducial cross section](https://thumb-us.123doks.com/thumbv2/123dok_us/7989784.1326051/3.482.79.406.458.565/figure-predictions-ducial-sections-atlasepwz-compared-measured-ducial.webp)


![Figure 10. Extracted signal strengths µ for the four analysis regions of WVV production and for thecombination [25].](https://thumb-us.123doks.com/thumbv2/123dok_us/7989784.1326051/10.482.98.387.65.293/figure-extracted-signal-strengths-analysis-regions-production-thecombination.webp)
![Figure 10. Extracted signal strengths µ for the four analysis regions of WVV production and for thecombination [25].](https://thumb-us.123doks.com/thumbv2/123dok_us/7989784.1326051/11.482.66.417.67.310/figure-extracted-signal-strengths-analysis-regions-production-thecombination.webp)
