ISSN: 2319-8753
I
nternational
J
ournal of
I
nnovative
R
esearch in
S
cience,
E
ngineering and
T
echnology
(An ISO 3297: 2007 Certified Organization)
Vol. 2, Issue 9, September 2013
Copyright to IJIRSET www.ijirset.com 4921
Measurement and Analysis of the Gaseous
Pollutants in the Surrounding Areas of an
Upcoming Airport
ARUN KUMAR MISHRA
1, PRABHAT SRIVASTAVA
2, R. S. Patil
3Assistant Professor, Department of Civil Engineering, .M.M.M. Govt. Engg. College Gorakhpur,.U.P.India1
Professor & Head , Department of Civil Engineering, S.P.College of Engg. Andheri, Bombay,,India 2
Professor, Emeritus, Department of CESE, IIT Bombay,Mumbai,, India 3
Abstract: Aviation affects the environment through the emission of pollutants from the aircrafts and other supporting airport infrastructure facilities, resulting on human health and the atmosphere. Emitted pollutants resulting from the aircrafts include green house gases and particulates matter that contribute to forcing of climate and gases and particulate matter that are harmful to human health. Aircraft engine emissions include CO, CO2, H20, SO2, NOX, HC and volatile and non volatile particulate matter (PM). Navi Mumbai in the state of Maharashtra, India has been chosen as the study area. NOX and SO2 concentration were monitored at 10 locations around the Navi Mumbai international airport and air quality
status were evaluated at all locations. The NOX and SO2 concentration were compared with the National Ambient Air
Quality Standards (NAAQS) . In this paper an attempt has been made to study the NOX and SO2 level concentrations in the
surrounding areas of an upcoming airport..
Key words : Airport, PM10, NOx, SO2, secondary particles.
I INTRODUCTION
India’s economy is growing much faster as compared to many other countries in the world resulting in the growth of
industries and infrastructure activities, leading to enhance emission of PM and acidic gases mainly SO2 and NOX. This
situation warrants a closer analysis of the impact of emission of acidic gases and PM and their interactions in atmosphere. Acidic gases are primary atmospheric pollutants contributing the formation of secondary particles (most of these are formed in fine mode) in the atmosphere leading to high health risk to population. For preparing air effective pollution control strategies, knowledge of formation of secondary particles and identifying their contribution to PM`10, and more importantly,
identifying the precursor gaseous pollutants responsible for formation of secondary particles are important. Control of the secondary particles will require control of identified primary precursor gaseous pollutants.
Air pollution is one of the major causes of concern for deterioration of environmental conditions, particularly in developing countries. Air borne particles in the atmosphere have serious environmental impacts on climate (Broecker,2000; Prospero et al., 2002) biogeochemical cycling in ecosystems (Nriagu, 1988) outside visibility and the health of living beings (Dockery et al., 1993). The problem of air pollution is a global concern in developing countries, like India and is growing due to continued population pressure and industrial growth( Pandey, 2005). It acquires a great concern worldwide and leads to numerous studies on the chemical composition of ambient aerosols and determination of pollution sources (Mouli et al., 2006). Air borne particulate is the sum of the all solid and liquid particles suspended in air. This complex includes both organic nand inorganic particles with varying size, composition and origins. Characterizing PM10 can also help to
ISSN: 2319-8753
I
nternational
J
ournal of
I
nnovative
R
esearch in
S
cience,
E
ngineering and
T
echnology
(An ISO 3297: 2007 Certified Organization)
Vol. 2, Issue 9, September 2013
Copyright to IJIRSET www.ijirset.com 4922
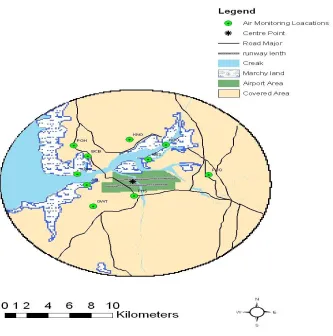
II DESCRIPTION OF THE STUDY AREA
The site of Navi Mumbai airport is selected near Panvel town in an area admeasuring 2347 acres of land which is situated about 45 km away from the CBD of Mumbai/Santacruz airport. The airport is planned with two runways of 3700 M with parallel taxiways designed to suit the new generation large aircraft. The other facilities include the domestic terminal, international terminal, cargo terminal, airfield lighting, city side facilities etc. The phase wise development approach has been adopted to suit the air travel demand
The study area shown in Figure 1 covers the area around the airport falling within the radius of 10 kms. The study area is further divided in two parts namely core area and fringe area. The core area covers the area within the radius of 10 km, in which all the scooped environmental parameters have been studied to understand the magnitude of impact. In the remaining area i.e. fringe area places of historical importance, aesthetics, cultural including environmentally sensitive have
been studied
.
ISSN: 2319-8753
I
nternational
J
ournal of
I
nnovative
R
esearch in
S
cience,
E
ngineering and
T
echnology
(An ISO 3297: 2007 Certified Organization)
Vol. 2, Issue 9, September 2013
Copyright to IJIRSET www.ijirset.com 4923
III SAMPLING AND ANALYSIS
Air quality of the project area was carried out by monitoring the pollutants at different locations (Fig.2). The pollutants which were monitored are;, Total Suspended Particulate Matter (TSPM), Respirable Particulate Matter (RSPM or PM10),
Oxides of Nitrogen (NOx), Sulphur dioxide (SO2), Carbon Monoxide (CO), and Hydrocarbons (HC). The selections of
stations were based on WHO (1981) guidelines. The monitoring was done during winter season at a frequency of twice a week at each station for 24 hours. Respirable Dust Sampler and High Volume Sampler were used for monitoring of RPM, TSPM and gaseous pollutants like SO2 and NOx. To monitor the traffic pollutant Carbon Monoxide, a portable multi gas
monitor with digital display was used. CO pollutant was monitor at all the 10 locations at a frequency of twice a week at each station for 24 hrs. Anemometer was used to note the wind speed and direction. Digital thermometer was used to record the existing temperature. Horizontal and vertical dispersion parameters were taken based on the atmospheric stability
class B and downwind distance.
ISSN: 2319-8753
I
nternational
J
ournal of
I
nnovative
R
esearch in
S
cience,
E
ngineering and
T
echnology
(An ISO 3297: 2007 Certified Organization)
Vol. 2, Issue 9, September 2013
Copyright to IJIRSET www.ijirset.com 4924
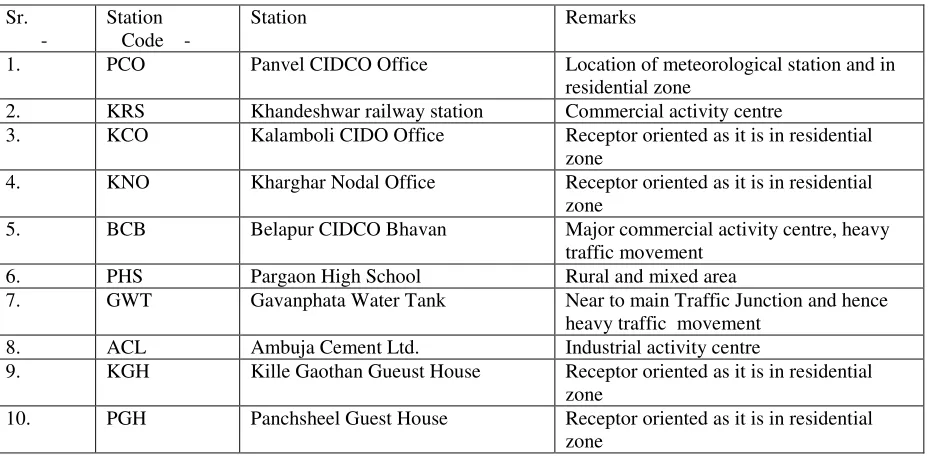
Table 1
:
Location of the Air Monitoring Stations in the Project Area
Table 2: Traffic growth rate for different links
Category Car, Taxi, Van 2/3 Wheelers Buses Trucks
Upto 2008 4.5 10.0 5.0 7.5
2009-2015 4.5 10.0 5.0 6.0
2015-2030 4.0 10.0 5.0 3.0
IV RESULTS AND DISCUSSION
In this study the mass concentration of PM10 and its associated chemicals constituents along with NO2 and SO2 analyzed.
Results obtained from the analysis were compared from the standards prescribed by CPCB and these results are given in following table 3
Sr. -
Station
Code -
Station Remarks
1. PCO Panvel CIDCO Office Location of meteorological station and in
residential zone
2. KRS Khandeshwar railway station Commercial activity centre
3. KCO Kalamboli CIDO Office Receptor oriented as it is in residential
zone
4. KNO Kharghar Nodal Office Receptor oriented as it is in residential
zone
5. BCB Belapur CIDCO Bhavan Major commercial activity centre, heavy
traffic movement
6. PHS Pargaon High School Rural and mixed area
7. GWT Gavanphata Water Tank Near to main Traffic Junction and hence
heavy traffic movement
8. ACL Ambuja Cement Ltd. Industrial activity centre
9. KGH Kille Gaothan Gueust House Receptor oriented as it is in residential
zone
10. PGH Panchsheel Guest House Receptor oriented as it is in residential
ISSN: 2319-8753
I
nternational
J
ournal of
I
nnovative
R
esearch in
S
cience,
E
ngineering and
T
echnology
(An ISO 3297: 2007 Certified Organization)
Vol. 2, Issue 9, September 2013
Copyright to IJIRSET www.ijirset.com 4925
Table 3: Average values of different air pollutants concentration at various stations of the study area during winter season
Station Code
PM10
µg/ m3
NOx
µg/m3
SO2
µg/ m3
CO
µg/ m3
HC
µg/ m3
KRS 202 21.0 4.0 0.6 2.18
BCB 269 32.0 3.4 0.8 2.30
ACL 168 29.0 3.5 0.6 2.01
GWT 411 27.0 4.7 0.6 2.11
PCO 222 24.0 3.4 0.8 2.28
KCO 259 25.5 4.2 0.7 2.16
KNO 176 27.3 4.0 0.7 2.22
PHS 170 20.4 4.5 0.6 2.04
KGH 210 26.6 3.9 0.7 2.04
PGH 199 25.6 3.7 0.7 2.44
V CONCLUSION
The average concentrations of PM10, NOx, SO2, NH3, CO and HC in the study area during winter season were in
the range of, 170-411 µg/ m3 , 20.4-32.0 µg/ m3 ,3.4-4.7 µg/ m3 , 27.0-37.6 µg/ m3 , 0.6-0.8 µg/ m3 , 2.01-2.30 µg/ m3 respectively.
Air monitoring results of the study period showed that PM10 were highest during winter season whereas concentration
of PM10 was observed to be decreased during pre monsoon, monsoon and post monsoon season. Winter season is the
worst time for air quality, since surface atmospheric temperature drops down with an inversion condition. Little mixing or dilution of pollutants takes place at this stability condition (low mixing height) of the atmosphere and hindered pollutant dispersion during winter months. Moreover, suspended particles in the study area are natural and not chemical in nature and may not have adverse effect on human health.
The concentrations of NOx and SO2 are well within prescribed limit of CPCB.
ACKNOWLEDGEMENT
The authors are thankful to Dr Omkar Dixit and Dr. Mukesh Sharma, Professors, Civil Engineering Department, I.I.T. Kanpur-208016 (U.P.), India for their valuable guidance and suggestions
.
REFERENCES
[1].Broecker, W.S. 2000. “Abrupt climate changes Casual constraints provided by the pale climate record”, Earth Sci.Rev,Vol,51, 2000, pp.137-154. [2].CPCB 2001. “Central laboratory test methods”,. Central Pollution Control Board, Delhi..
[3].Dockery, D., et al.. “An association between air pollution and mortality in 6 US cities”. New England J Med., 1993, Vol.329(24), pp. 1759.
[4].Duce R,A., G.L Hoffman and W.H. Zoller 1975. “Atmospheric trace metals at remote northern and southern hemisphere sites” : Polution or natural. Sci, 1975.,, Vol 18, pp:59-61
[5].Goodrzi, F and F.E. Huggins.. “Monitoring the species of arsenic, chromium and nickel in milled coal, bottom ash and flyash from a pulverized coal fire power plant in Western Canada”. J. Env. Mon,2001, Vol. 3, pp.:1-6
[6].HEI.”. Understanding the health effects of components of particulate matter mix: Progress and Next Steps”, HEI perspectives: Health Effects Institute.
[7] Lee D. S. Fahey D.W. and Faster P.M. “Aviation and global climate change in 21stcentury” ,Atmospheric environment, Voi. 43 (22-23),2009,