RESEARCH
Effect of extradural constriction on CSF flow
in rat spinal cord
Joel A. Berliner
1*, Thomas Woodcock
1,2, Elmira Najafi
1, Sarah J. Hemley
1, Magdalena Lam
1, Shaokoon Cheng
3,
Lynne E. Bilston
4,5and Marcus A. Stoodley
1Abstract
Background: Fluid homeostasis in the central nervous system (CNS) is essential for normal neurological function. Cerebrospinal fluid (CSF) in the subarachnoid space and interstitial fluid circulation in the CNS parenchyma clears metabolites and neurotransmitters and removes pathogens and excess proteins. A thorough understanding of the normal physiology is required in order to understand CNS fluid disorders, including post-traumatic syringomyelia. The aim of this project was to compare fluid transport, using quantitative imaging of tracers, in the spinal cord from animals with normal and obstructed spinal subarachnoid spaces.
Methods: A modified extradural constriction model was used to obstruct CSF flow in the subarachnoid space at the cervicothoracic junction (C7–T1) in Sprague–Dawley rats. Alexa-Fluor 647 Ovalbumin conjugate was injected into the cisterna magna at either 1 or 6 weeks post–surgery. Macroscopic and microscopic fluorescent imaging were performed in animals sacrificed at 10 or 20 min post–injection. Tracer fluorescence intensity was compared at cervical and thoracic spinal cord levels between control and constriction animals at each post-surgery and post-injection time point. The distribution of tracer around arterioles, venules and capillaries was also compared.
Results: Macroscopically, the fluorescence intensity of CSF tracer was significantly greater in spinal cords from animals with a constricted subarachnoid space compared to controls, except at 1 week post-surgery and 10 min post-injection. CSF tracer fluorescence intensity from microscopic images was significantly higher in the white matter of constriction animals 1 week post surgery and 10 min post-injection. At 6 weeks post–constriction surgery, fluores-cence intensity in both gray and white matter was significantly increased in animals sacrificed 10 min post-injection. At 20 min post-injection this difference was significant only in the white matter and was less prominent. CSF tracer was found predominantly in the perivascular spaces of arterioles and venules, as well as the basement membrane of capillaries, highlighting the importance of perivascular pathways in the transport of fluid and solutes in the spinal cord.
Conclusions: The presence of a subarachnoid space obstruction may lead to an increase in fluid flow within the spinal cord tissue, presenting as increased flow in the perivascular spaces of arterioles and venules, and the basement membranes of capillaries. Increased fluid retention in the spinal cord in the presence of an obstructed subarachnoid space may be a critical step in the development of post-traumatic syringomyelia.
Keywords: Cerebrospinal fluid, Spinal cord, Perivascular, Syringomyelia
© The Author(s) 2019. This article is distributed under the terms of the Creative Commons Attribution 4.0 International License (http://creat iveco mmons .org/licen ses/by/4.0/), which permits unrestricted use, distribution, and reproduction in any medium, provided you give appropriate credit to the original author(s) and the source, provide a link to the Creative Commons license, and indicate if changes were made. The Creative Commons Public Domain Dedication waiver (http://creat iveco mmons .org/ publi cdoma in/zero/1.0/) applies to the data made available in this article, unless otherwise stated.
Open Access
*Correspondence: joel.berliner@hdr.mq.edu.au
1 Faculty of Medicine and Health Sciences, Macquarie University,
Technology Place, Sydney, NSW 2109, Australia
Background
Cerebrospinal fluid (CSF) is a clear, colorless fluid that bathes the central nervous system (CNS). It has several critical functions, including maintenance of a homeo-static environment for neurons and glia, transport of neuroactive substances around the CNS, and acting as a drainage system for CNS interstitial fluid [1–6]. The clas-sical view of CSF circulation is that it is produced primar-ily in the ventricles by the choroid plexus, and flows into the subarachnoid space surrounding the brain and spinal cord, finally being reabsorbed through arachnoid granu-lations in the superior sagittal sinus, across the cribri-form plate, or via spinal arachnoid villi [3, 7, 8]. Efflux of subarachnoid CSF may also occur via cranial and spinal nerves [9]. In addition to this ‘macrocirculation’, there is an interchange of CSF and interstitial fluid (ISF), allowing for a ‘microcirculation’ of ISF through the CNS paren-chyma. This route of fluid flow potentially brings neu-roactive substances into contact with neuronal cells and facilitates the removal of waste products. The details of this interchange are still poorly understood [5, 6, 10].
Recent studies suggest that CSF enters the brain paren-chyma along periarterial spaces and exits around periv-enular spaces, and that this pathway could be important for the clearance of metabolites from the parenchyma [11, 12]. However, compelling evidence of a distinct bulk flow pathway for CSF/ISF exchange has not been pro-duced. Other studies have indicated different drainage pathways, where interstitial fluid and solutes of the brain flow outwards via capillary basal laminae and smooth muscle basement membranes of arterioles and arter-ies [13, 14]. This route has been described as ‘intramu-ral periarterial drainage’ [15]. Still, even less is known about the route of CSF flow and exchange in the spinal cord. In ovine and rodent models, spinal subarachnoid CSF flows rapidly into large perivascular spaces that fun-nel into small perivascular spaces of the central gray mat-ter toward the central canal. In the adjacent ECS, limited mixing of fluid tracers with ISF occurs [16, 17]. In rodent models of syringomyelia, there is also rapid flow from the spinal subarachnoid space into perivascular spaces [18, 19]. Computational models suggest that arterial pul-sations are a key factor in fluid flow in the perivascular spaces [20, 21], raising the possibility that alterations in pulse wave timing or amplitude could increase fluid inflow.
Syringomyelia is a condition in which high-pressure fluid-filled cysts (syrinxes) form in the spinal cord leading to weakness, pain, and paralysis [22, 23]. Little is known regarding the mechanisms of formation and enlargement of a syrinx, or indeed the source of the fluid. Post–trau-matic syringomyelia is typically associated with a nar-rowing or obstruction in the subarachnoid space after
spinal cord injury, but how this leads to formation of a fluid-filled cavity is unknown. Current surgical treat-ment is not always effective, and syrinx recurrence rate can be as high as 50% [24–30]. There is therefore a need to improve our understanding of fluid inflow and outflow pathways in the spinal cord. In this study, we tested the hypothesis that a subarachnoid obstruction changes the pattern of fluid flow into and through the spinal cord by increasing the inflow at the level of obstruction. This was investigated using a fluorescent tracer to examine fluid flow in the spinal cord of normal animals and in the pres-ence of an extradural constriction.
Materials and methods
This study was approved by the Animal Care and Eth-ics Committee of Macquarie University (ARA2013/047). A total of 47 male Sprague–Dawley rats weighing 300–400 g were divided into two groups: experimental animals and control animals. Of these, 28 animals under-went extradural constriction surgery to obstruct the sub-arachnoid space at the C7–T1 spinal cord level and 19 control animals underwent laminectomy only. At either 1 or 6 weeks post–surgery, the CSF tracer, Alexa–Fluor® 647 ovalbumin, was injected into the CSF circulation at the cisterna magna for 10 or 20 min before sacrifice. Macroscopic and microscopic imaging procedures were carried out on these animals. Post-surgery time points were chosen based on the expected structural changes to subarachnoid space and parenchyma with an acute (1 week) and a chronic (6 weeks) obstruction. The maxi-mum post-surgery time was chosen as 6 weeks to avoid cyst development, as cyst development was previously found between 8 and 13 weeks after extradural constric-tion [31]. Sacrifice time points of 10 or 20 min post-injection were chosen to observe CSF tracer inflow with minimal outflow. The obstruction was expected to alter inflow of CSF, so time points longer than 20 min would likely demonstrate a combination of inflow and outflow.
Extradural constriction surgery
of 300 µg/mL buprenorphine in 5% glucose solution was administered subcutaneously. Subsequent doses were given as needed. This surgery was modified from the spi-nal thecal sac constriction model created by Josephson and colleagues [31]. In the original model the constric-tion surgery was performed at T8 and the subarachnoid space was obstructed with a 3-0 silk suture.
The animals were allowed food and water ad libitum and monitored for any signs of excessive weight loss, limb weakness, urinary retention or excessive self-grooming.
CSF tracer injection
At the designated time point, 1 or 6 weeks post-surgery, animals were re-anesthetized. A midline incision was made in the cranio–cervical area to expose the atlanto-occipital membrane. The neck of the animal was flexed to ensure that the atlanto-occipital membrane was taut. Using a stereotactic micromanipulator frame, a 10 µL microsyringe with a bevelled 30G needle (SGE
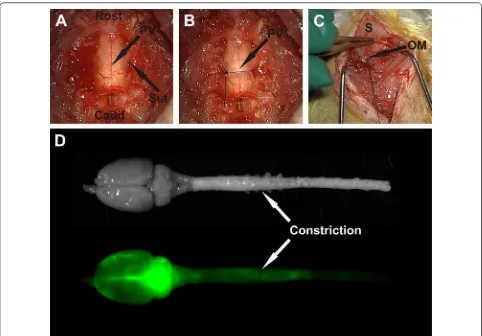
International Pty Ltd, VIC, Australia) was inserted into the cisterna magna and withdrawn slightly to tent-up the atlanto–occipital membrane. A 5 µL injection of the CSF tracer, ovalbumin Alexa–Fluor 647 conjugate (OA-647; Molecular weight 45 kDa; Life Technologies, Victo-ria, Australia) at a concentration of 20 µg/µL was slowly administered into the cisterna magna. The injection was performed over 1 min and the needle was then left in-place to prevent CSF leakage (Fig. 1C). At either 10 or 20 min after tracer injection the needle was removed, and the animals were positioned supine for perfusion and fixation.
The animals were perfused by intracardiac injection of 2000 IU Heparin in 400 mL ice-cold phosphate buff-ered saline, followed by 500 mL of 4% paraformaldehyde (Lancaster Synthesis, Pelham, New Hampshire) in 0.1 M phosphate buffered saline (PBS) pH 7.4 at a flow rate of 50 mL/min. The spinal cord was dissected out and post-fixed in 4% paraformaldehyde in 0.1 M PBS overnight.
Ex vivo macroscopic imaging of tracer
After post fixation, white-light and fluorescence images of the spinal cord were captured using a small animal optical imaging system (MS FX PRO Bruker, Billerica, MA). The intensity of the OA-647 signal was detected by the fluorescence camera, set at an excitation wavelength of 630 nm and emission wavelength of 700 nm. White– light images were captured to facilitate easy identification of spinal cord segments (Fig. 1D). Fluorescent images of whole spinal cord and brain were captured with an expo-sure time of 4 s (Fig. 1D).
Ex vivo microscopic imaging of tracer
The spinal cord segments from C3 to T3 were dissected, cryoprotected in 30% sucrose in 0.1 M PBS pH 7.4 for 48 h and embedded in OCT compound (ProSciTech Pty Ltd, QLD, Australia). Spinal cord sections were cut trans-versely at 10 µm on a cryostat (Leica CM 1950 Cryostat, Amtzell, Germany). Sections were thawed in a 37 °C oven for 10 min, then washed twice for 10 min in Tris phosphate buffered saline (TPBS = 0.05 M PBS + 0.01 M TRIS). The sections were then treated with 50% etha-nol/TPBS for 20 min, followed by three 10 min washes in TPBS. DAPI (1 µg/mL) was applied to each slide, incubated for 1 min to visualize the cell nuclei and then washed twice for 10 min. The sections were then cover-slipped with fluorescence mounting medium (DAKO, S3023, Carpinteria, CA, US). The sections were imaged with a Zeiss Axio Imager Z2 microscope (Carl Zeiss Microimaging GmbH, Germany). Images were acquired from C3 to T3 for quantitative image analysis. All images were taken at 20× magnification and exposure times were kept constant.
Ex vivo microscopic imaging of tracer co‑localized with blood vessels
In addition to the 10 µm transverse spinal cord sections collected from C3 to T3, 40 µm sections were also cryo-sectioned for immunostaining with blood vessel markers. Endothelial cells were identified using a mouse anti-endothelial cell monoclonal antibody (1:100; RECA-1, ab9774, Abcam, Australia); smooth muscle cells of arter-ies and arterioles were identified using a mouse mono-clonal anti-actin, α-smooth muscle-Cy3 antibody (1:400; SMA-Cy3, C6198, Sigma-Aldrich, USA). Immunofluo-rescence staining proceeded as follows. Sections were thawed in a 37 °C oven for 30 min, then washed twice for 10 min in TPBS. The sections were then treated with 50% ethanol/TPBS for 20 min followed by three 10 min washes in TPBS and incubated with 15% normal donkey serum (NDS) in TPBS pH 7.4 for 60 min. Spinal cord sec-tions were incubated with RECA-1 overnight at 4 °C. The
following day, sections were left for 2 h at room tempera-ture before two 10 min rinses with TPBS and incubated with anti-mouse IgG Alexa Fluor 488 (1:400, A–11034, Molecular Probes, Eugene, Oregon, USA) diluted in 4% NDS/TPBS for 60 min at room temperature. The sec-tions were rinsed with two 5 min washes in TPBS and incubated with SMA-Cy3 at 37 °C for 30 min, followed by two 10 min washes and cover slipped with fluorescence mounting medium (DAKO, Carpinteria, California, USA). The primary or secondary antibody was omitted in negative controls. Fluorescence images were taken with a digital camera (Zeiss Z1, Gottingen, Germany), and pro-cessed using Zeiss Axiovision software. All images were taken at 20× magnification and exposure times were kept constant. High magnification images of blood vessels were taken using a laser scanning confocal microscope (Zeiss LSM880, Gottingen, Germany), and processed using Zeiss Zen 2012 (black edition).
Image analysis
Images were analyzed with Image J [32]. Macroscopic images of the brain and spinal cord were analyzed by overlaying the fluorescence image and reflected white-light image to allow spinal nerve roots to be identified, then mean fluorescence intensity was measured in each spinal segment from C2 to T8. For microscopic images, mean fluorescence intensity was measured in sections taken from spinal cord segments C3–T3. At least five spinal cord sections were analyzed per spinal level and the results for each spinal level were averaged. A region of interest outside the spinal cord was used to subtract background. Measurements were then made of the whole white matter and the whole gray matter using the manual tracing and segmentation tool in Image J. The borders of the gray matter, white matter and meninges were iden-tified using the DAPI or RECA channel (see Additional file 1). Assessment of the distribution of CSF tracer rela-tive to blood vessels was performed on 28 animals using Zeiss Axiovision software. Three spinal cord sections were assessed for each spinal level C3, C5, C7, T1 and T3 per animal, with a minimum of three animals per experi-mental group (n = 3 for all groups except 6 weeks, 10 and 20 min constriction cohorts, where n = 5 for each group).
Classification of blood vessels
than 6.5 µm in diameter without a complete smooth muscle cell layer.
Statistical analysis
Mean fluorescence intensity in sections from control and constriction animals were compared using analysis of variance (ANOVA) and adjusted for multiple comparison using Bonferroni’s post hoc tests. A p value of less than 0.05 was considered significant. All values are expressed as mean ± standard error of the mean.
Results
Surgery and post‑operative observations
The extradural constriction surgery commonly caused neurological deficits, including hindlimb and forelimb weakness, urinary retention, and hematuria. In the immediate week post-surgery, bladders were manu-ally expressed and animals received analgesia daily until neurological symptoms had abated, usually 3–5 days post-surgery. Out of 28 animals that underwent constric-tion surgery, 1 animal died due to urinary tract infecconstric-tion and 2 animals were euthanized due to severe neurologi-cal deficits within the first 48 h. No complications were observed in the control animals.
Macroscopic imaging—CSF tracer distribution along the neuraxis
Detectable differences in the distribution and fluores-cence intensity of CSF tracer were observed in spinal cords of animals from different treatment groups, at both 1 and 6 weeks after the initial surgery (Fig. 2).
Generally, in control animals 10 min after tracer injec-tion, the highest intensity of CSF tracer was observed in the brain and intensity decreased gradually in the caudal direction. At 20 min, a similar pattern was observed, but in general the signal intensity was uniformly lower. In animals with a subarachnoid space obstruction the inten-sity of tracer fluorescence was notably increased through-out the neuraxis compared to control animals, but with a similar distribution pattern (see Additional file 2).
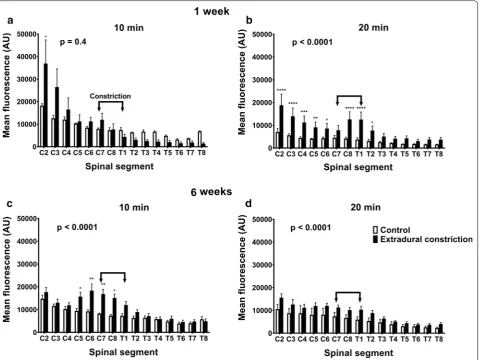
1 week post‑surgery
One week after the extradural constriction surgery, and 10 min after tracer injection, rostro–caudal spread of CSF tracer was not significantly different to the control. However, post hoc comparison at the most rostral spi-nal segment aspi-nalyzed, C2, showed significantly higher fluorescence intensity in animals with an extradural con-striction (p < 0.05, Fig. 2a). Twenty minutes after tracer injection, a significant increase in rostro-caudal CSF tracer spread was reported in extradural constriction animals compared to controls (p < 0.0001, Fig. 2b; see Additional file 2). Here, CSF tracer fluorescence intensity
in spinal segments C2–C6 and C8–T2 was significantly higher in constriction animals (p < 0.0001, p < 0.001, p < 0.01, p < 0.05).
6 weeks post‑surgery
At 6 weeks post-surgery, the fluorescence intensity was significantly higher in animals with extradural con-striction compared to control animals, both at 10 min (p < 0.0001) and 20 min (p < 0.0001) post–tracer injection (Fig. 2c, d; see Additional file 2). In most spinal segments, higher fluorescence intensity was reported in extradural constriction animals compared to controls, and this was significant at 10 min post-injection in spinal segments C5–C8 (p < 0.01, p < 0.05, Fig. 2c).
Microscopic imaging—CSF tracer distribution within the spinal cord
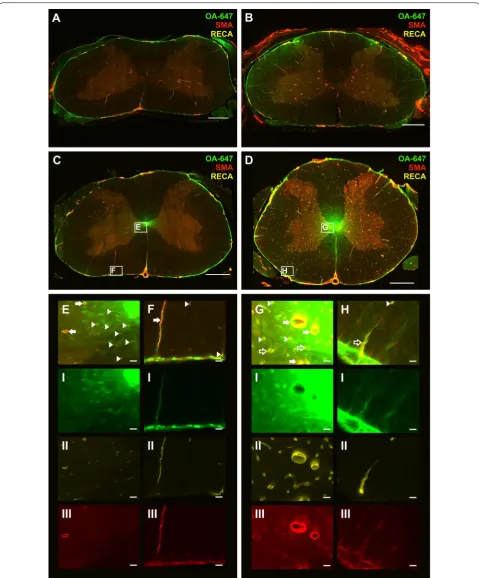
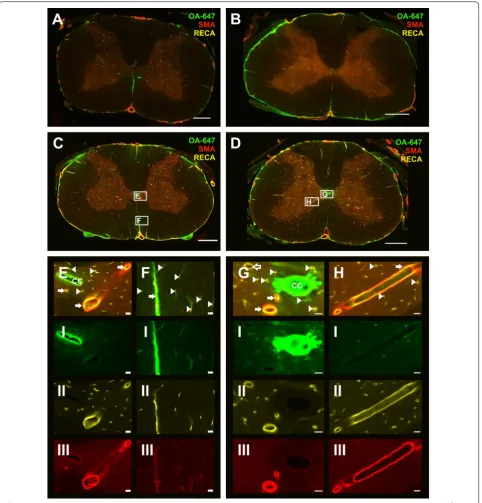
Within 1 and 6 weeks post-surgery groups, control and constriction cohorts showed varied tracer distribution in the spinal cord. In general, CSF tracer was predominantly concentrated around the periphery of the spinal cord, in the anterior median fissure, the posterior median sulcus, in perivascular spaces, and in the central canal at both 10 and 20 min post-injection in control animals (Figs. 3A, C and 4A, C). In animals with an extradural constriction, the tracer fluorescence intensity in the peripheral white matter of the spinal cord was generally more marked, whereas in the gray matter and central canal, the distri-bution of CSF tracer was similar to the corresponding controls (Figs. 3B, D and 4B, D). In both control and con-striction animals, tracer was observed in a diffuse pattern in the parenchyma. This was most evident surrounding the central canal (Fig. 3E, G) Accumulation of cells and focal edema was present in several animals with extra-dural constriction, but a well-defined, discrete syrinx was not found (see Additional file 3).
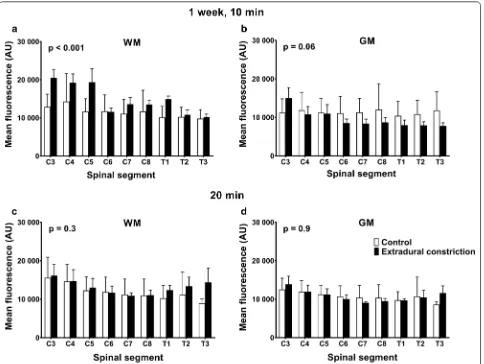
1 week post‑surgery
Fluorescence intensity in spinal cord white matter at 1 week, 10 min after tracer injection, was significantly higher (p < 0.001) in animals with an extradural constric-tion (Fig. 5a). The fluorescent intensity was higher in rostral segments, although this difference did not reach statistical significance. In the gray matter, there were no significant differences in tracer intensity between control and extradural constriction animals (Fig. 5b). No signifi-cant changes were observed in the white and gray matter 20 min post-tracer injection between control and con-striction animals (Fig. 5c, d).
lower cervical and thoracic spinal cord. Tracer was also distributed around a small number of venules.
In constriction animals 10 min post-injection, CSF tracer appeared to be present around more blood vessels at or above the site of CSF obstruction compared to the corresponding controls. By 20 min, tracer was observed mainly in the peripheral white matter around capillar-ies and arterioles, as well as around a small number of venules.
6 weeks post‑surgery
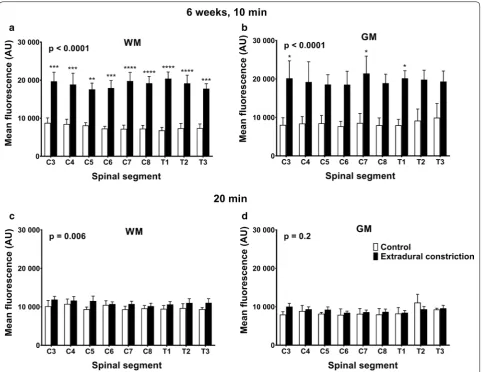
At 10 min post-injection, rostro-caudal fluorescence intensity was significantly higher in constriction ani-mals compared to controls in white and gray matter (p < 0.0001), and post hoc analysis reached significance
in the white matter of all spinal segments and in the gray matter of spinal segments C3, C7 and T1 (Fig. 6a, b). At 20 min, rostro-caudal fluorescence intensity was significantly higher in the white matter in constriction animals compared to controls (p = 0.006), although this difference was less pronounced (Fig. 6c). There was no significant difference in the gray matter at 20 min (Fig. 6d).
In control animals at 10 min post-injection, CSF tracer was mainly distributed around arterioles and capillaries (Fig. 3E, F). At 20 min post-injection, tracer was localized similarly around arterioles and capillaries (Fig. 4E, F). CSF tracer was also distributed around a small number of venules in control animals at both 10 and 20 min post-injection.
In constriction animals 10 min after injection (Fig. 3D), more capillaries, as well as arterioles and venules, were associated with tracer compared to the control group (Fig. 3C). This was particularly evident at or just above the site of constriction. At 20 min post-injection (Fig. 4D)
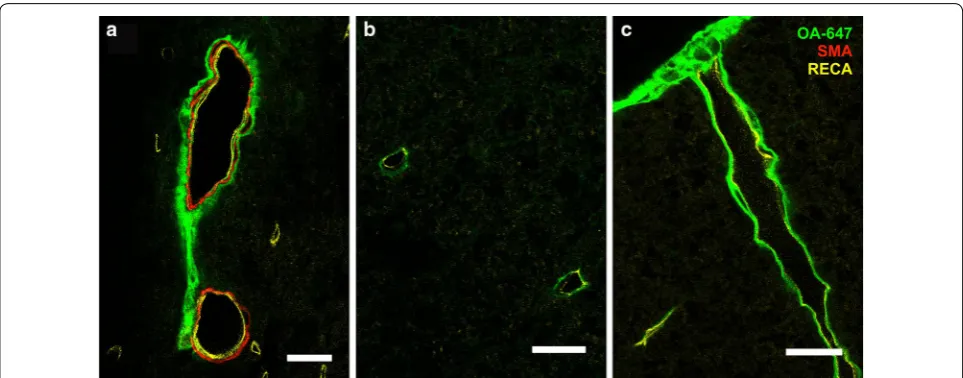
the tracer distribution around vessels was comparable to the 10 min constriction group (Fig. 3D). Tracer was pre-dominantly observed in the perivascular spaces of ven-ules and arterioles as well as, presumably, the basement membrane of capillaries (Fig. 7).
Discussion
The present study investigated the effect of a subarach-noid space obstruction on fluid flow in the rat spinal cord by studying the distribution of a fluorescent tracer injected into the CSF circulation. At the macroscopic level, increased fluorescence intensity was detected at all time points, in the constriction animals compared to controls, with the increase most apparent rostral to the constriction. In contrast, microscopic analysis did not find consistently increased tracer deposition within the spinal cord parenchyma until 6 weeks after constric-tion, at 10 min but not 20 min post-injection. These results suggest that there is a transient rostro-cau-dal increase in fluid in the spinal cord white and gray matter, due to an increased inflow, a reduced outflow,
or both, in the region of subarachnoid space obstruc-tion. Importantly, co-localization of tracer with all ves-sel types at 10 and 20 min time points, irrespective of subarachnoid space obstruction, is in opposition to the ‘glymphatic theory’.
The macroscopic analysis of CSF tracer distribu-tion 1 week post-surgery demonstrated a significant increase in the fluorescence intensity at 20 min post-tracer injection in animals with subarachnoid space constriction, however in the microscopic analysis, there was no significant difference in tracer deposition at this timepoint. This could be because the macroscopic imaging method is detecting changes in meningeal tracer deposition, whereas the microscopic analysis of tissue sections excluded anything external to the spinal
cord parenchyma, such as the meninges and the suba-rachnoid space.
Differences in the distribution of CSF tracer between 1 and 6 weeks post–surgery were also observed. The severe neurological deficits observed in animals up to 5 days post-constriction surgery suggest that the ini-tial constriction surgery caused swelling and inflam-mation of the spinal cord. At 1 week after constriction surgery, these changes may not have completely sub-sided, whereas by 6 weeks post-surgery, it is likely that the swelling and inflammation will have completely resolved. At this stage, the effect of constriction may not be as severe or complete as it was at 1 week and it is possible that the subarachnoid space is only partially obstructed.
Based on the microscopic analysis, CSF obstruction led to increased tracer fluorescence within the spinal cord 6 weeks post-surgery, most notably 10 min after injec-tion. These results suggest that in the presence of a suba-rachnoid obstruction it takes longer for the tracer to clear from the spinal cord parenchyma. Although significantly higher levels of fluorescence were observed in white mat-ter 20 min afmat-ter injection, this was not as pronounced, suggesting that clearance of CSF tracer has occurred. If we assume that at 1 week there is a complete obstruction of CSF flow in the subarachnoid space and at 6 weeks there is only a partial obstruction, it is possible that the greatest impact on CSF flow into the spinal cord is due to a restriction or delay in flow rather than complete obstruction driving more CSF into the spinal cord. This
is consistent with the findings of Brodbelt and colleagues [33]. The authors investigated CSF flow in an excitotoxic model of post-traumatic syringomyelia with insertion of a lumboperitoneal shunt to investigate the effect of re-establishing caudal subarachnoid space compliance as opposed to tethering or the obstructive effects of arach-noiditis. The authors found that local CSF flow into the spinal cord at the level of arachnoiditis was unchanged after shunt insertion. They suggested that localized changes in compliance, rather than total CSF obstruc-tion from arachnoiditis, affects CSF flow into the spinal cord [33]. Indeed, in a coupled modelling study of CSF and cardiovascular systems, pressure and flow of blood and CSF were greatly impacted by the vascular anatomy of the spinal cord and the spinal subarachnoid space [34]. Martin and colleagues projected that the variable, ros-tro-caudal compliance in the craniospinal subarachnoid space could also account for a large amount of perivascu-lar absorption of CSF compared with total CSF produced [34].
In 2010 Bilston and colleagues conducted a compu-tational modelling study and established that a partial obstruction to the spinal subarachnoid space is sufficient in delaying the CSF waveform [35]. According to their theory of pressure phase lag, an increase in resistance to CSF flow in the subarachnoid space causes the normal CSF pressure waveform to lag, which results in a higher CSF pressure in the subarachnoid space for 25% of the cardiac cycle after systole. It has been suggested that perivascular spaces of arterioles at diastole of the cardiac
cycle are at their widest and in systole they are at their narrowest, so these spaces are likely increasing in width after the systolic pulse wave has passed through. The delayed CSF pulse wave coupled with an unaffected arte-rial pulse wave could potentially drive more fluid along widening perivascular spaces and into the spinal cord [35]. This is also consistent with the modelling of poste-rior (partial) arachnoiditis reported by Cheng and col-leagues [36]. The authors concluded that the change in the timing of the CSF waveform with respect to the car-diac cycle caused a bidirectional flow in the subarachnoid space not seen in the circumferential arachnoiditis model [36]. Further modelling of a cervical subarachnoid space obstruction by Støverud and colleagues demonstrated a mistiming of bidirectional flow at the level of the obstruction and an overall increase in velocity and pres-sure gradients of CSF. Importantly, the phase lag between pressure and velocity decreased [37]. These findings add credence to the theory that changes of the relative tim-ing of the CSF pulse wave to the arterial pulse wave may drive more fluid into the spinal cord.
The microscopic analysis of tracer distribution in the current study demonstrated that the subarachnoid con-striction had a greater effect on CSF flow in the white matter, and this was most notable 10 min post tracer injection. This could be due to the fact that after the injection, the tracer is predominantly moving from the subarachnoid space into the white matter, either by tran-spial diffusion or via perivascular spaces. Subsequently, it flows into the gray matter, however, 10 min may not be
long enough for tracer to reach the gray matter. However, tracer in the spinal subarachnoid space can also enter the central gray matter ECS via the anterior median fissure, and the penetrating perivascular spaces then funnel into the central canal or traverse towards the peripheral white matter [16, 17]. It is possible that with an obstructed sub-arachnoid space due to the extradural constriction, this pathway of tracer flow is disturbed. Since the effect of the subarachnoid space obstruction was greatest at the ear-lier post-injection time, this suggests that the extradural constriction did alter the normal flow of CSF in the suba-rachnoid space, leading to a temporary increase in fluid within the spinal cord parenchyma. There appears to be a delayed compensatory pathway that allows clearance of excess fluid from the spinal cord. The maintenance of fluid homeostasis in the spinal cord relies on the balance between inflow and outflow, yet perhaps in the presence of an obstruction these outflow pathways become com-promised, leading to edema and subsequent syrinx for-mation. Previous investigations into the pathogenesis of syringomyelia proposed that a syrinx forms due to an accumulation of extracellular fluid that is unable to be removed [38]. It was suggested that the subarachnoid pressure exceeds the intramedullary pressure leading to a blockage of the perivascular spaces in the white matter. This in turn causes fluid to accumulate, producing edema and eventually syringomyelia below the level of subarach-noid scar/obstruction [38].
In the current study, syrinx cavities were not observed in animals with an extradural constriction. However, cel-lular accumulation accompanied by focal edema in the deep white matter and anterior horns of the gray matter was present at the level of constriction in a few animals (see Additional file 3). This indicates that in this model, a syrinx may take longer to develop than the 6 week time point investigated in this study. Josephson and colleagues indeed found fluid accumulation and syrinx formation at 8 weeks in a rat model of spinal thecal sac constriction [31]. Yet, lack of syrinx formation in the present study may suggest that syringomyelia is not simply caused by an obstruction to subarachnoid CSF flow. The patho-physiology appears far more complex. There is some evi-dence that molecular changes may be involved in fluid accumulation in the spinal cord [39, 40]. Nesic and col-leagues suggested that increased AQP4 expression in the spinal cord following injury may lead to edema and swell-ing and this may contribute, at least in part, to initial cyst formation [39]. Hemley and colleagues reported a signifi-cant increase in AQP4 expression at the level of syrinx in the post-traumatic syringomyelia model and suggested that there may be a relationship between AQP4 expres-sion levels and fluid accumulation in the spinal cord [41]. Concurrently, Najafi and colleagues demonstrated that in
astrocytes adjacent to post-traumatic syrinx cavities, the expression of inwardly rectifying potassium channel 4.1 was significantly decreased [42]. Altered expression or distribution of water and ion channels could represent a contributing factor to the observed alterations in fluid flow.
In the brain, it has been reported that CSF flow into and out of parenchyma occurs via bulk flow that is dependent on the presence of AQP4 at astrocytic end-feet lining peri-arterial and peri-venular spaces [12]. Bulk flow of ISF has previously been demonstrated in the brain under physiological and hyperosmolar conditions [43]. In contrast to the ‘glymphatic’ theory proposed by Iliff and colleagues [12], other studies have indicated that tracers injected into brain parenchyma are removed from the brain via diffusion in the ECS and then via a perivascular pathway, through arterial and capillary basement mem-branes [13]. More recent studies have shown that bulk flow in the brain may not be required for a glymphatic system of solute transport [44]. Asgari and colleagues used computational modelling of arterial pulsations to show that the fast solute transport along periarterial spaces in the brain could occur due to fluid dispersion, rather than bulk flow [44]. This dispersion of fluids and solutes involves periarterial mixing and diffusion into brain ECS. Further modelling of the brain ECS has sug-gested that diffusion, under normal physiological condi-tions, is the main determinant for solute transport [45,
46]. Through the authors’ modelling, an advective sol-ute transport in a glymphatic system was not supported. Indeed, an increasing body of evidence, inclusive of the present study, are in direct conflict with the glymphatic hypothesis [44–50]. These studies implicate a perivascu-lar system of fluid transport in the brain, a pathway where perivascular spaces of macrovessels permit convective or dispersive flow and the microvessel perivascular spaces and basement membranes in conjunction with sur-rounding neuropil, described as the neurovascular unit, allow the regulatory CSF/ISF exchange by diffusion. Liu and colleagues recently described movement of tracer injected into the spinal cord as dependent on the diffu-sivity of gray and white matter [51]. Perivascular spaces around microvessels were reported as major outflow con-duits [51]. Nevertheless, mechanisms of fluid flow in the spinal cord in normal and abnormal conditions remain poorly described.
CSF tracer between perivascular and subarachnoid space, and may not lead to significant net transport of CSF tracer into the parenchyma itself. The lack of individual vessel type differences in perivascular tracer localiza-tion between control and constriclocaliza-tion cohorts, irrespec-tive of post-surgery and post-injection time points, may indicate that these pathways remain constant regardless of a disturbed flow in the subarachnoid space. However, enlargement of these spaces, which has been associated with the pathology of post-traumatic syringomyelia [52], may permit a greater volume of tracer conveyed through the perivascular network. Coupled with reduced outflow due to the constriction, an increased inflow of tracer may explain why more arterioles, capillaries, and venules were found co-localized with tracer in the 6 week constric-tion animals compared to the corresponding controls. This increased inflow/reduced outflow theory could also explain why white matter in constriction animals showed significantly higher fluorescence at 10 min post-injection than controls, 1 and 6 weeks post-surgery. It is also likely, given the vast number of capillaries surrounded by tracer, in both control and constriction animals, that the base-ment membrane is acting as either an inflow or outflow pathway, or both. If this is the case, pericapillary flow is likely to be a major pathway for fluid exchange. This has been suggested previously in studies of rodent cortex [49,
50]. This pathway of fluid exchange would suggest that capillary basement membranes act as connecting con-duits between the larger, parent perivascular spaces of arterioles and venules. Indeed, a recent electron micro-scopic study of spinal cord perivascular spaces and their role in the transport of fluid suggested that there is a con-tinuity between subarachnoid space and central canal of the spinal cord, via perivascular spaces, the basement membranes including capillary basement membranes, and ECS of the white matter and the central gray matter [53].
It should be noted that CSF tracer was commonly observed in the central canal of animals in all experi-mental groups. This is consistent with several studies demonstrating fluid flow from the spinal subarachnoid space, through the parenchyma via perivascular spaces and on to the central canal in animal models [16, 17, 51]. The central canal has been proposed as a major clear-ance route for extracellular fluid. Described as a sink, it is suggested to protect spinal cord parenchyma by drain-ing neurotoxic substances [54]. It is possible that under conditions of flow obstruction within the subarachnoid space, the central canal clearance pathway may not be able to compensate for increased ISF volume. Cou-pled with volume changes in perivascular spaces, this unresolved ISF volume increase may precede syrinx formation.
The study of tracer distribution from subarachnoid space to spinal cord parenchyma is a valid and effec-tive method for assessing CSF flow patterns. However, assumptions are made about fluid pathways, based on deposition profiles, representing a snapshot in time. The extradural constriction model used in this study is a valu-able model of subarachnoid space obstruction. However, the ischemia, caused by the constriction of the vein and surrounding vessels by the suture, may have an unmeas-ured effect of disrupting fluid movement and changing flow pathways. Disruption to cervical lymphatic drain-age at spinal nerve root sheaths may also result from the extradural constriction. Finally, as maximum sample size across any experimental group was 6 animals with a minimum of 3, increasing experimental group cohorts in future studies may elicit more robust results.
Conclusions
This CSF tracer study demonstrated that a subarachnoid space obstruction significantly increases CSF tracer fluo-rescence intensity in rat spinal cord tissue. This provides evidence that a restriction of, or disruption to, CSF flow leads to an increased influx of fluid in the spinal cord, with possibly a concomitant disruption to efflux path-ways. The vast network of perivascular spaces of arte-rioles, venules and the connecting capillary basement membranes are likely contributors to this exchange pathway in both normal physiological conditions and when there is abnormal CSF circulation. The findings of this study suggest that even without a complete obstruc-tion, an imbalance between inflow and outflow volumes (of possible perivascular origin) may precede fluid accu-mulation. Further investigations are needed to clarify the mechanisms and physiological factors that result in fluid accumulation pathologies such as post-traumatic syringomyelia.
Additional files
Additional file 1. Manual segmentation and measurement of spinal cord gray and white matter. Transverse micrographs of spinal cord illustrate manual tracing and segmentation of gray and white matter for measure-ment in ImageJ software. The transverse spinal cord was manually traced to exclude meningeal fluorescence, and gray matter was outlined as a separate region of interest (A). White matter fluorescence was calculated by measuring total spinal cord fluorescence and subtracting the gray mat-ter fluorescence (B). Gray matmat-ter fluorescence was isolated as a region of interest and measured (C). Scale bars are 500 µm.
injection of a CSF tracer (OA–647). In general, fluorescence in spinal cords of constriction animals appears more intense than corresponding control animals.
Additional file 3. Cellular accumulation and focal edema identified in extradural constriction animals 1 and 6 weeks post-surgery. Representa-tive micrographs at the level of the extradural constriction (C7–T1) from animals 1 and 6 weeks post-surgery after injection of CSF tracer (OA-647). Low magnification micrographs demonstrate focal edema and the infiltration/accumulation of cells within the deep anterior white matter (A–C) and anterior horns of the gray matter (D, E). High magnification insets (a–e) illustrate hyperintensity of smooth muscle actin (SMA) and rat endothelial cell antigen (RECA) staining, especially evident in the anterior horns (d, e). Scale bars are 500 µm (A–E) and 50 µm (a–e).
Abbreviations
ANOVA: analysis of variance; AQP4: aquaporin-4; CNS: central nervous system; CSF: cerebrospinal fluid; ECS: extracellular space; HRP: horseradish peroxi-dase; ISF: interstitial fluid; MRI: magnetic resonance imaging; PBS: phosphate buffered saline; RECA: rat endothelial cell antigen; SEM: standard error of the mean; SMA: smooth muscle actin; TPBS: tris-phosphate buffered saline.
Authors’ contributions
TW, SH, LB, SC & MS conceived and designed the experiments; JB, EN, TW & ML were responsible for data acquisition and analysis; JB, EN, & SH interpreted the data and drafted the manuscript. All authors critically revised the final version of the manuscript. All authors read and approved the final manuscript.
Author details
1 Faculty of Medicine and Health Sciences, Macquarie University, Technology
Place, Sydney, NSW 2109, Australia. 2 Elsevier Inc, John F Kennedy Boulevard,
Philadelphia, PA 19103, USA. 3 Department of Engineering, Faculty of
Sci-ence and Engineering, Macquarie University, Sydney, NSW 2109, Australia.
4 Neuroscience Research Australia, Margarete Ainsworth Building, Barker
Street, Sydney, NSW 2031, Australia. 5 Prince of Wales Clinical School, University
of New South Wales, Sydney, NSW 2031, Australia.
Acknowledgements
The authors would like to acknowledge Pei Ting (Centre for Healthcare Resil-ience and Implementation ScResil-ience, Australian Institute of Health Innovation, Macquarie University) for consultation over statistical analysis.
Competing interests
The authors declare that they have no competing interests.
Availability of data and materials
The datasets supporting the conclusions of this article are available from the corresponding author on reasonable request.
Consent for publication
Not applicable.
Ethics approval and consent to participate
This study was carried out in compliance with the approval of the Animal Eth-ics Committee of Macquarie University (ARA2013/047).
Funding
This work was funded by a Column of Hope Research Grant, the National Health and Medical Research Council (NHMRC) of Australia (Project No. 604008); and the Brain Foundation of Australia. Mr Berliner and Dr Najafi were supported by scholarships from Macquarie University and Professor Bilston is supported by an NHMRC senior research fellowship. Portions of this work were presented at the Adelaide Centre for Spinal Research Symposium, Adelaide, Australia, 2012 and 2018, Syringomyelia 2013 Conference, Sydney, Australia, and Gordon Research Center Barriers of the CNS Conference 2018, New London NH, USA.
Publisher’s Note
Springer Nature remains neutral with regard to jurisdictional claims in pub-lished maps and institutional affiliations.
Received: 12 January 2019 Accepted: 12 March 2019
References
1. Borison HL, Borison R, McCarthy LE. Brain stem penetration by horserad-ish peroxidase from the cerebrospinal fluid spaces in the cat. Exp Neurol. 1980;69(2):271–89.
2. Miaki K, Matsui H, Nakano M, Tsuji H. Nutritional supply to the cauda equina in lumbar adhesive arachnoiditis in rats. Eur Spine J. 1999;8(4):310–6.
3. Brown PD, Davies SL, Speake T, Millar ID. Molecular mechanisms of cer-ebrospinal fluid production. Neuroscience. 2004;129(4):957–70. 4. Kimelberg HK. Water homeostasis in the brain: basic concepts.
Neurosci-ence. 2004;129(4):851–60.
5. Abbott NJ. Evidence for bulk flow of brain interstitial fluid: significance for physiology and pathology. Neurochem Int. 2004;45(4):545–52.
6. Abbott NJ, Pizzo ME, Preston JE, Janigro D, Thorne RG. The role of brain barriers in fluid movement in the CNS: is there a ‘glymphatic’ system? Acta Neuropathol. 2018;135(3):387–407.
7. Brodbelt A, Stoodley M. CSF pathways: a review. Br J Neurosurg. 2007;21(5):510–20.
8. Edsbagge M, Tisell M, Jacobsson L, Wikkelso C. Spinal CSF absorp-tion in healthy individuals. Am J Physiol Regul Integr Comp Physiol. 2004;287(6):R1450–5.
9. Koh L, Zakharov A, Johnston M. Integration of the subarachnoid space and lymphatics: is it time to embrace a new concept of cerebrospinal fluid absorption? Cerebrospinal Fluid Res. 2005;2:6.
10. Redzic ZB, Segal MB. The structure of the choroid plexus and the physiology of the choroid plexus epithelium. Adv Drug Deliv Rev. 2004;56(12):1695–716.
11. Iliff JJ, Lee H, Yu M, Feng T, Logan J, Nedergaard M, et al. Brain-wide pathway for waste clearance captured by contrast-enhanced MRI. J Clin Invest. 2013;123(3):1299–309.
12. Iliff JJ, Wang M, Liao Y, Plogg BA, Peng W, Gundersen GA, et al. A paravas-cular pathway facilitates CSF flow through the brain parenchyma and the clearance of interstitial solutes, including amyloid beta. Sci Transl Med. 2012;4(147):147ra11.
13. Carare RO, Bernardes-Silva M, Newman TA, Page AM, Nicoll JA, Perry VH, et al. Solutes, but not cells, drain from the brain parenchyma along basement membranes of capillaries and arteries: significance for cerebral amyloid angiopathy and neuroimmunology. Neuropathol Appl Neuro-biol. 2008;34(2):131–44.
14. Morris AW, Sharp MM, Albargothy NJ, Fernandes R, Hawkes CA, Verma A, et al. Vascular basement membranes as pathways for the passage of fluid into and out of the brain. Acta Neuropathol. 2016;131(5):725–36. 15. Diem AK, MacGregor Sharp M, Gatherer M, Bressloff NW, Carare RO,
Rich-ardson G. Arterial pulsations cannot drive intramural periarterial drainage: significance for abeta drainage. Front Neurosci. 2017;11:475.
16. Stoodley MA, Brown SA, Brown CJ, Jones NR. Arterial pulsation-depend-ent perivascular cerebrospinal fluid flow into the cpulsation-depend-entral canal in the sheep spinal cord. J Neurosurg. 1997;86(4):686–93.
17. Stoodley MA, Jones NR, Brown CJ. Evidence for rapid fluid flow from the subarachnoid space into the spinal cord central canal in the rat. Brain Res. 1996;707(2):155–64.
18. Stoodley MA, Gutschmidt B, Jones NR. Cerebrospinal fluid flow in an animal model of noncommunicating syringomyelia. Neurosurgery. 1999;44(5):1065–75.
19. Brodbelt AR, Stoodley MA, Watling AM, Tu J, Jones NR. Fluid flow in an animal model of post-traumatic syringomyelia. Eur Spine J. 2003;12(3):300–6.
•fast, convenient online submission •
thorough peer review by experienced researchers in your field • rapid publication on acceptance
• support for research data, including large and complex data types •
gold Open Access which fosters wider collaboration and increased citations maximum visibility for your research: over 100M website views per year •
At BMC, research is always in progress.
Learn more biomedcentral.com/submissions
Ready to submit your research? Choose BMC and benefit from:
21. Cheng S, Jacobson E, Bilston L. Models of the pulsatile hydrodynamics of cerebrospinal fluid flow in the normal and abnormal intracranial system. Comput Methods Biomech Biomed Eng. 2007;10(2):151–7.
22. Shannon N, Symon L, Logue V, Cull D, Kang J, Kendall B. Clinical features, investigation and treatment of post-traumatic syringomyelia. J Neurol Neurosurg Psychiatry. 1981;44(1):35–42.
23. Dworkin GE, Staas WE Jr. Posttraumatic syringomyelia. Arch Phys Med Rehabil. 1985;66(5):329–31.
24. Batzdorf U, Klekamp J, Johnson JP. A critical appraisal of syrinx cavity shunting procedures. J Neurosurg. 1998;89(3):382–8.
25. Bonfield CM, Levi AD, Arnold PM, Okonkwo DO. Surgical management of post-traumatic syringomyelia. Spine. 2010;35(21 Suppl):S245–58. 26. Cacciola F, Capozza M, Perrini P, Benedetto N, Di Lorenzo N.
Syringo-pleural shunt as a rescue procedure in patients with syringomyelia refractory to restoration of cerebrospinal fluid flow. Neurosurgery. 2009;65(3):471–6.
27. Ushewokunze SO, Gan YC, Phillips K, Thacker K, Flint G. Surgical treatment of post-traumatic syringomyelia. Spinal Cord. 2010;48(9):710–3. 28. Sgouros S, Williams B. Management and outcome of posttraumatic
syringomyelia. J Neurosurg. 1996;85(2):197–205.
29. Lee TT, Alameda GJ, Gromelski EB, Green BA. Outcome after surgical treatment of progressive posttraumatic cystic myelopathy. J Neurosurg. 2000;92(2 Suppl):149–54.
30. Aghakhani N, Baussart B, David P, Lacroix C, Benoudiba F, Tadie M, et al. Surgical treatment of posttraumatic syringomyelia. Neurosurgery. 2010;66(6):1120–7.
31. Josephson A, Greitz D, Klason T, Olson L, Spenger C. A spinal thecal sac constriction model supports the theory that induced pressure gradients in the cord cause edema and cyst formation. Neurosurgery. 2001;48(3):636–45.
32. Schneider CA, Rasband WS, Eliceiri KW. NIH Image to ImageJ: 25 years of image analysis. Nat Methods. 2012;9(7):671–5.
33. Brodbelt AR, Stoodley MA, Watling AM, Tu J, Burke S, Jones NR. Altered subarachnoid space compliance and fluid flow in an animal model of posttraumatic syringomyelia. Spine. 2003;28(20):E413–9.
34. Martin BA, Reymond P, Novy J, Baledent O, Stergiopulos N. A coupled hydrodynamic model of the cardiovascular and cerebrospinal fluid system. Am J Physiol Heart Circ Physiol. 2012;302(7):H1492–509. 35. Bilston LE, Stoodley MA, Fletcher DF. The influence of the relative timing
of arterial and subarachnoid space pulse waves on spinal perivascular cerebrospinal fluid flow as a possible factor in syrinx development. J Neurosurg. 2010;112(4):808–13.
36. Cheng S, Stoodley MA, Wong J, Hemley S, Fletcher DF, Bilston LE. The presence of arachnoiditis affects the characteristics of CSF flow in the spinal subarachnoid space: a modelling study. J Biomech. 2012;45(7):1186–91.
37. Stoverud KH, Langtangen HP, Haughton V, Mardal KA. CSF pressure and velocity in obstructions of the subarachnoid spaces. Neuroradiol J. 2013;26(2):218–26.
38. Klekamp J. The pathophysiology of syringomyelia—historical overview and current concept. Acta Neurochir. 2002;144(7):649–64.
39. Nesic O, Lee J, Ye Z, Unabia GC, Rafati D, Hulsebosch CE, et al. Acute and chronic changes in aquaporin 4 expression after spinal cord injury. Neuroscience. 2006;143(3):779–92.
40. Saadoun S, Bell BA, Verkman AS, Papadopoulos MC. Greatly improved neurological outcome after spinal cord compression injury in AQP4-deficient mice. Brain. 2008;131(Pt 4):1087–98.
41. Hemley SJ, Bilston LE, Cheng S, Chan JN, Stoodley MA. Aqua-porin-4 expression in post-traumatic syringomyelia. J Neurotrauma. 2013;30(16):1457–67.
42. Najafi E, Stoodley M, Bilston L, Hemley S. Inwardly rectifying potassium channel 4.1 expression in post-traumatic syringomyelia. Neuroscience. 2016;317:23–35.
43. Rosenberg GA, Kyner WT, Estrada E. Bulk flow of brain interstitial fluid under normal and hyperosmolar conditions. Am J Physiol. 1980;238(1):F42–9.
44. Asgari M, de Zelicourt D, Kurtcuoglu V. Glymphatic solute transport does not require bulk flow. Sci Rep. 2016;6:38635.
45. Holter KE, Kehlet B, Devor A, Sejnowski TJ, Dale AM, Omholt SW, et al. Interstitial solute transport in 3D reconstructed neuropil occurs by diffu-sion rather than bulk flow. Proc Natl Acad Sci U S A. 2017;114(37):9894–9. 46. Jin BJ, Smith AJ, Verkman AS. Spatial model of convective solute transport
in brain extracellular space does not support a “glymphatic” mechanism. J Gen Physiol. 2016;148(6):489–501.
47. Smith AJ, Yao X, Dix JA, Jin BJ, Verkman AS. Test of the ‘glymphatic’ hypothesis demonstrates diffusive and aquaporin-4-independent solute transport in rodent brain parenchyma. Elife. 2017;6:e27679.
48. Wolak DJ, Thorne RG. Diffusion of macromolecules in the brain: implica-tions for drug delivery. Mol Pharm. 2013;10(5):1492–504.
49. Pizzo ME, Wolak DJ, Kumar NN, Brunette E, Brunnquell CL, Hannocks MJ, et al. Intrathecal antibody distribution in the rat brain: surface diffusion, perivascular transport and osmotic enhancement of delivery. J Physiol. 2018;596(3):445–75.
50. Hannocks MJ, Pizzo ME, Huppert J, Deshpande T, Abbott NJ, Thorne RG, et al. Molecular characterization of perivascular drainage pathways in the murine brain. J Cereb Blood Flow Metab. 2018;38(4):669–86.
51. Liu S, Lam MA, Sial A, Hemley SJ, Bilston LE, Stoodley MA. Fluid outflow in the rat spinal cord: the role of perivascular and paravascular pathways. Fluids Barriers CNS. 2018;15(1):13.
52. Durward QJ, Rice GP, Ball MJ, Gilbert JJ, Kaufmann JC. Selective spinal cor-dectomy: clinicopathological correlation. J Neurosurg. 1982;56(3):359–67. 53. Lam MA, Hemley SJ, Najafi E, Vella NGF, Bilston LE, Stoodley MA. The
ultrastructure of spinal cord perivascular spaces: implications for the circulation of cerebrospinal fluid. Sci Rep. 2017;7(1):12924.