R E S E A R C H
Open Access
Improper hydration induces global
gene expression changes associated
with renal development in infant mice
Chong-Su Kim
1and Dong-Mi Shin
1,2*Abstract
Background:The kidney is a major organ in which fluid balance and waste excretion is regulated. For the kidney to achieve maturity with functions, normal renal developmental processes need to occur. Comprehensive genetic programs underlying renal development during the prenatal period have been widely studied. However, postnatal renal development, from infancy to the juvenile period, has not been studied yet. Here, we investigated whether structural and functional kidney development was still ongoing in early life by analyzing the renal transcriptional networks of infant (4 weeks old) and juvenile (7 weeks old) mice. We further examined the effects of dehydration on kidney development to unravel the mechanistic bases underlying deteriorative impact of pediatric dehydration on renal development.
Methods:3-week-old infant mice that just finished weaning period were provided limited access to a water for fifteen minutes per day for one week (RES 1W) and four weeks (RES 4W) to induce dehydration while control group
consumed water ad libitum with free access to the water bottle. Transcriptome analysis was conducted to understand physiological changes during postnatal renal development and dehydration.
Results:Kidneys in 4-week- and 7-week-old mice showed significantly distinctive functional gene networks. Gene sets related to cell cycle regulators, fetal kidney patterning molecules, and immature basement membrane integrity were upregulated in infantile kidneys while heightened expressions of genes associated with ion transport and drug
metabolism were observed in juvenile kidneys. Dehydration during infancy suppressed renal growth by interrupting the SHH signaling pathway, which targets cell cycle regulators. Importantly, it is likely that disruption of the developmental program ultimately led to a decline in gene expression associated with basement membrane integrity.
Conclusions:Altogether, we demonstrate transcriptional events during renal development in infancy and show that the impacts of inadequate water intake in the early postnatal state heavily rely on the impairment of normal renal
development. Here, we provide a meaningful perspective of renal development in infancy with a molecular and physiological explanation of why infants are more vulnerable to dehydration than adults. These results provide new insights into the molecular effects of dehydration on renal physiology and indicate that optimal nutritional interventions are necessary for pediatric renal development.
Keywords:Dehydration, Infancy, Kidney transcriptome, Renal development,
* Correspondence:[email protected]
1Department of Food and Nutrition, Seoul National University, Seoul 08826, South Korea
2Research Institute of Human Ecology, Seoul National University, Seoul 08826, South Korea
Background
The kidney is a major organ that plays crucial roles in homeostasis in the body. It filters the blood to excrete waste products from the body [17] and controls body fluid volume, solute, and acid balance within a tight range in cooperation with other endocrine organs [33]. The critical functions of the kidney in the fluid regulatory system are implicated in precise regulation of plasma osmolality. When the body senses changes in osmolality, osmorecep-tors at the hypothalamus stimulate arginine vasopressin (AVP) release, which promotes fluid reabsorption in the kidney and thirst by which water retention increases [30].
Kidney organogenesis comprises several common developmental steps: proliferation and differentiation of stem cells, epithelial-mesenchymal cell transition, branch-ing, and regional segmentation [13, 16, 46]. Complex gene regulatory networks mediate cell interactions underlying anatomical and functional modifications in kidney morphogenesis [23, 45]. Especially, dynamic reg-ulations underlying cell and tissue integrity are essential in kidney function and are highly associated with renal disorders [49]. A highly selective permeable glomerular barrier membrane establishes networks with podocyte foot processes and slit diaphragm, a modified form of adherens junction, to gain mature filtration functions [36]. Thus, retaining a stable cell and junction architec-ture is required for normal renal function [26, 36, 49].
Body water constitutes cells and tissues and functions as a carrier of nutrients and excretions [17, 29]. It also serves as both reactant and product in metabolisms [17]. Opti-mal hydration is necessary for a healthy life [9]. It is well documented that dehydration negatively impacts multiple physiological disorders [9, 17, 33]. Healthy adults regulate fluid balance to maintain homeostasis whereas infants have an immature fluid regulatory system [37] with a higher body water composition, reaching 75 % [9]. More-over, infants, right after weaning, are more prone to drink insufficient water since caregivers are likely to be unaware of their thirst [9]. In this respect, infants seem to be at higher risk for dehydration.
While recent studies have shown that further growth of the nephrons and elongation of tubular structures occur after birth [8], little is known about how genetic events are regulated in renal growth postnatally [2, 7, 24, 50]. Moreover, the molecular and physiological back-ground for why infants are more vulnerable to dehydra-tion has not been studied yet, and there are few studies on whether dehydration causes physiological changes in in-fants. We hypothesized that fundamental mechanisms of pediatric dehydration may underlie renal developmental processes. To confirm this assumption, we studied the effects of insufficient water intake in infant mice, with emphasis on physiological and transcriptional changes in the developing kidney.
In this study, we performed global gene expression pro-filing analysis and identified the functional networks of differentially expressed genes in the kidneys of infant and juvenile mice. We showed that kidneys undergo biological processes to achieve structural and functional maturation even after birth and dehydration altered gene networks associated with normal renal development and matur-ation. These results may provide evidence that sufficient water intake from infancy to juvenile period is necessary for normal renal physiology and system development.
Methods
Experimental animals
Right after weaning, 3-week-old male C57BL/6 mice were housed for 1 and 4 weeks and sacrificed at the age of 4 and 7 weeks old, corresponding to infant and juvenile. Animals were randomly assigned into control (CON) and water restriction group (RES). A total of four groups were used in comparison analysis: CON 1W (4 weeks old,n= 5), CON 4W (7 weeks old,n= 6), RES 1W (4 weeks old,n= 6), and RES 4W (7 weeks old,n= 8). Animals were maintained in a 12-h light/dark cycle and fed ad libitum with an AIN-93G diet. Animals from water restriction group were maintained dehydrated until they were sacrificed, 24 h after the last provision of water bottle. All experimental procedures were approved by the IACUC (Institutional Animal Care and Use Committee) of Seoul National Uni-versity and conducted according to the IACUC guidelines.
Water restriction
Animals in water restriction group were imposed limited access to water. A water bottle was given to animals for 15 min a day during the experimental period. Control mice consumed water ad libitum with free access to the water bottle.
Plasma biochemical analysis
Serum biochemical analysis for blood urea nitrogen (BUN) and serum creatinine (sCr) was conducted using a dry-chemistry blood analyzer, Spotchem SP-4410 (Arklay, Kyoto, Japan). Plasma osmolality was determined by Fiske 210 Micro-Sample Osmometer (Fiske, Norwood, MA, USA).
RNA isolation
Microarray hybridization
RNA samples were amplified for microarray analyses using Illumina TotalPrep RNA Amplification Kit (Ambion, Austin, TX). Five hundred nanograms of total RNA was used to prepare labelled complementary RNA (cRNA) with overnight incubation. Amplified cRNA was hybridized on Illumina MouseWG-6 Expression BeadChip arrays. The arrays were scanned with BeadArray Reader (BeadStation 500G Instrument, Illumina Inc.). Identification and quanti-fication of spot images were obtained by Genome Studio software v1.0.2 (Illumina Inc.).
Bioinformatic analysis of microarray data
The analysis was performed as described in [41]. Raw data was log-transformed and normalized by quantile normalization using Genome Studio software (Illumina Inc.). Differentially expressed genes among four groups were identified using an ANOVA (p< 0.05) by Partek® Genomics Suite software v6.6 (Partek, St Louis, MI) (http:// www.partek.com/partekgs). Average expression levels of genes were compared between groups, and calculated p
values were corrected for multiple comparisons using false discovery rate algorithm. Significant genes with fold change >1.5 and FDR <0.01 were used for further analysis.
Hierarchical clustering analysis was performed using the Pearson correlation distance matrix with average linkage algorithm in Genesis software v1.7.5 [43]. Func-tional categories of significant genes were determined by a right-tailed Fisher exact test. To examine the sig-nificance of functional categories which were classified based on Ingenuity Knowledge Base, Gene Set Enrichment Analysis was carried out (http://www.broadinstitute.org/ gsea/index.jsp). Mechanistic networks underlying signaling pathways and metabolic pathways were built based on the Ingenuity Knowledge Base. Upstream regulator analysis was carried out to predict upstream regulators in direct or indirect relationships with dataset using Ingenuity Pathway Analysis (IPA) [22]. Functional network map of gene sets was constructed by using CytoScape software v3.2.0 (http:// cytoscape.org) [40]. The microarray dataset is available at the Gene Expression Omnibus (www.ncbi.nlm.nih.gov/geo/ , accession number GSE75604).
Quantitative RT-PCR
DNase I treated total RNA was converted into cDNA by two-step procedure with MessageSensor RT kit (Ambion, Austin, TX), and messenger RNA (mRNA) levels were quantified by SYBR-GREEN qPCR method (Applied Biosystem, Carlsbad, CA). Relative mRNA expression level was calculated by ΔΔCT method.
Glyceraldehyde-3-phosphate dehydrogenase (GAPDH) was used as a housekeeping gene for normalization of mRNA expression of each sample. Primer sequences are as follows: Avp: forward 5′-CCAGGATGCTCAAC
ACTACG-3′, reverse 5′-CTCTTGGGCAGTTCTGGA
AG-3′; Ccnd1: forward 5′-CGTGGCCTCTAAGATGA
AGG-3′, reverse 5′-CTGGCATTTTGGAGAGGAAG-3′; Cdkn2b: forward 5′-AGATCCCAACGCCCTGAA
C-3′, reverse 5′-CGCAGTTGGGTTCTGCTC-3′; and
Gapdh: forward 5′-TGCACCACCAACTGCTTAG-3′,
reverse 5′-GATGCAGGGATGATGTTC-3′.
Western blot analysis
Proteins were extracted from the kidneys. Equal amounts of protein were subjected to SDS-PAGE and transferred to PVDF membranes. The membranes were incubated with SMO (1:10000, ab72130) and anti-GLIS1 (1:1000, ab105873) primary antibodies from Abcam (Abcam Inc., Cambridge, MA). Anti-α-tubulin (1:10000, T5168) from Sigma (Sigma Chemical Co., St. Louis, MO) was used as control. Horseradish peroxidase-conjugated goat anti-rabbit secondary antibody (1:5000, #7074S) from Cell Signaling Technology (Cell Signaling Technology Inc., Danvers, MA) and goat anti-mouse secondary antibody (1:10000, G21040) from Invitro-gen (InvitroInvitro-gen, Carlsbad, CA) were used for detection. Protein bands were visualized using ECL Western blot detection reagents (Amersham Pharmacia Biotech, Piscat-away, NJ).
Statistical analysis
Data are expressed as mean ± SEM. Statistical significance (p< 0.05) was evaluated by unpaired Student’s t test be-tween two groups. Statistical analyses were performed using GraphPad Prism 6 software (GraphPad Software Inc., La Jolla, CA).
Results
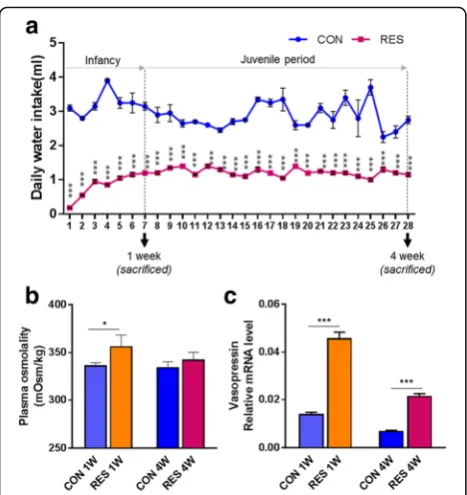
Time-limited access to water bottle induces mild dehydrating physiological conditions in infant mice
increases in vasopressin production in both RES 1W and RES 4W, compared to CON 1W and CON 4W, respect-ively (p< 0.001) (Fig. 1c).
Transcriptome profiling analysis of the kidneys in dehydrated mice
To examine the effect of dehydration in the developing mouse, the organ weight was measured. The weight of the kidneys increased with age from 0.22 g in CON 1W to 0.28 g in CON 4W (p< 0.001); however, dehydration caused a decrease of kidney weight in infant mice (RES 1W) by 22 % (p< 0.01) and juvenile mice (RES 4W) by 8 % (p= 0.23) compared to age-matched controls (Fig. 2a). To understand the molecular events underlying kidney growth and development from the age of infancy to the juvenile stage during the life cycle and to unveil the mechanism by which the kidneys’ weight were re-duced while developing mice were under dehydration status, we conducted gene expression profiling analysis of kidneys using a genome-scale microarray.
Principal component analysis (PCA) showed that the transcriptome profiles were readily distinguished by either
age (CON 1W and CON 4W) or a period of sustained water restriction (RES 1W and RES 4W) (Fig. 2b). Differen-tially expressed genes among the four groups were identi-fied by ANOVA analysis (p< 0.05). A total of 234 probes were differentially expressed depending on age in the normal control groups (CON 4W vs. CON 1W). Further-more, 977 probes were detected to distinctively mediate the transcriptional events in the infantile kidneys of the dehydration group (RES 1W vs. CON 1W), while 1926 differentially expressed probes were in the juvenile kidneys of the dehydration group (RES 4W vs. CON 4W) (Fig. 2c).
Normal infant and juvenile mice present distinct renal transcriptional profiles
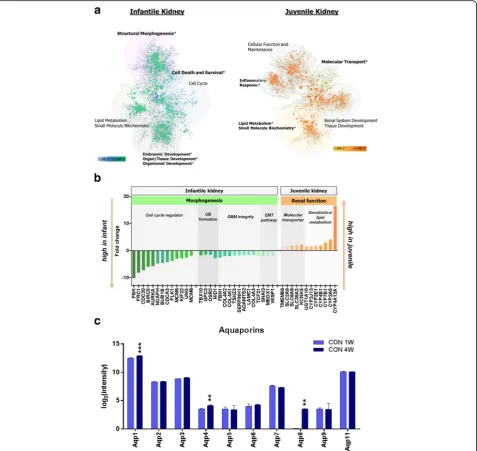
Hierarchical clustering analysis showed that postnatal kidneys at different time points (CON 1W and CON 4W) had distinguishable transcriptome profiles (Fig. 3a). Two hundred thirty-four probes were differentially expressed in a comparison of CON 1W and CON 4W, with 149 probes upregulated in the kidneys of infant mice (CON 1W) and 85 probes upregulated in juvenile mice (CON 4W): gene list is given in Additional file 1.
Fig. 2Transcriptome profiling analysis of the kidneys in dehydrated and control mice using genome-scale Illumina microarray.aThe weight of the kidney increased with age, but dehydration caused decreased weight in the kidneys of infant mice (RES 1W) by 22 % and in juvenile mice (RES 4W) by 8 %.bA 3D principal component analysis (PCA) plot of the renal transcriptome data represents significantly distinguishable profiles for each group: CON 1W (light blue), RES 1W (orange), CON 4W (blue), and RES 4W (red).Each dot indicates an individual kidney sample.cThe Venn diagram shows the number of probes that were detected with different signal intensity in each dataset. Data are expressed as mean ± SEM. Student’sttest; **p< 0.01, ***p< 0.001 versus control group
This finding implies that the kidneys of infant and juven-ile mice might undergo different biological processes.
To extend our knowledge about the biological process occurring in the infantile kidney, we established a func-tional network map of differentially expressed genes and assigned gene ontology (GO) terms. Enriched GO categor-ies from gene set enrichment analysis revealed that genes related to the cell cycle, tissue morphology, and develop-ment were significantly upregulated, whereas they were downregulated in CON 4W (Fig. 3a). Genes associated
with cell cycle, which was the most significant biological process in the infantile kidneys, including Aurka, Birc5,
Bub1b,Cdc20, Meox1, Pbk,Kif22, Mcm5, Mcm6,Ncaph,
Plk1,Ung, andCdca3 were overexpressed (Fig. 3b), indi-cating that developmental cellular processes were still abundant in the kidneys of CON 1W. Among those genes,
Aurka, Plk1, Mcm5, and Kif22have been found to func-tion in embryonic renal development by mediating cell division [21]. In addition,Birc5, which had about a sixfold increase in infant mice, has been reported to be expressed
only in the tubules and glomeruli of fetal kidney [39].
Meox, with a twofold increase in CON 1W compared to CON 4W, is one of the important factors in kidney forma-tion and has a role in epithelial-mesenchymal cell interac-tions [34]. Genes that are essential for DNA synthesis and cell division (Nasp, Rrm1, Rrm2, Prc1) were upregulated and then eventually downregulated with age in our dataset. Many of the predictive upstream regulators within gene sets of CON 1W were associated with cell cycle regulation, including Myc, Tp53, Foxm1, Ccnd1, and Smad3 (Add-itional file 2).Mycis highly expressed in the metanephros during renal organogenesis, and its disruption is associated with reduced cell proliferation [1]. These results imply that pathways mediating cell cycle progression were dominantly engaged in the development of infantile kidneys.
We also observed that the cluster of genes participating in basement membrane integrity was highly expressed in infant kidneys compared to juvenile kidneys. Genes encod-ing extracellular matrix (ECM) components are well known to change their expression levels during kidney tubulogen-esis and maturation [31]. Among them, collagen is a major component that provides structural integrity and its sub-types appear to have different expression levels during glomerular structural development in the kidney [31]. In our dataset, the members of the collagen IV family (Col4a1, Col4a2) showed two times higher expression in infant than juvenile kidneys (Fig. 3b). In concert with the overexpression of basement membrane composing protein, there was elevated expression of Adamts2,
Nid1, Serpinh1, and Wisp1 which participate in ECM synthesis [3, 25] (Fig. 3b). Genetic events regulating ECM deposition demonstrate that improvement of basement membrane integrity occurs in infants, which accounts for structural maturation after birth. In addition, genes that play roles in ureteric bud formation such as Tbx10, Gpc3, Osr2, and Nid1 had higher ex-pression in CON 1W than in CON 4W group. Snailis known to regulate mesenchymal to epithelial trans-formation [5]. Diminishing expression of Snail along with renal maturation in our dataset was coincident with previous work showing thatSnailbecomes inactive in the mature organ. Taken together, the results indicate that structural development of the kidney is not com-pleted before birth, rather postnatal kidneys continue to grow during infancy and they undergo the processes necessary for mature structural integrity.
Contrary to the observation that structural morphogen-esis was the most significant biological process in the tran-scriptome analysis of kidneys in CON 1W, upregulated genes in the CON 4W kidneys were associated with mo-lecular transport, renal system development and function, and cellular function and maintenance (Fig. 3a). This indi-cates that functional maturation of the kidney was on-going followed by morphological development. Genes
involved in molecular transport associated with the renal system (Kcnk5, Slc2a9, Slc6a9, Slc35a3) were highly expressed with 1.6- to two-fold changes (Fig. 3b). The cytochrome P450 family, involved in bile acid metabolism in extrahepatic tissues, xenobiotics metabolism (Cyp4b1,
Ugt1a10), and steroids and fatty acid metabolism (Cyp2e1,
Cyp4b1,Cyp7b1,Cyp4a12a), was also upregulated during the juvenile period (Fig. 3b). These results indicate that the kidneys of juveniles are in the process of de-veloping into functionally matured adult kidneys. We also checked whether aquaporin system that is critical for water transport in the kidney is in development and maturation. The increasing transcript levels of aquaporin family (Aqp1, Aqp4, and Aqp8; p< 0.01) with age support that functional maturation were tak-ing place in the kidneys of infant and juvenile mice although the difference was slight (Fig. 3c).
Dehydrated infant mice show altered Shh signaling pathway associated with impaired renal growth and development
Dehydration resulted in dramatic changes in kidney tran-scriptome profiles in infant mice. Each functional category of differentially expressed genes in the RES 1W group compared to CON 1W was tested for statistical signifi-cance. We found that the cell cycle, organ development, and renal system development were in the top seven significant categories (Fig. 4a). Gene set enrichment analysis (GSEA) confirmed that the cell cycle was the most enriched biological process regulated by hydration (Fig. 4b). These findings suggest that dehydration might have caused a deterioration in renal growth.
We further performed pathway analysis and found that one of the most crucial molecular pathways that were significantly regulated by dehydration during kid-ney organogenesis was the Sonic hedgehog (Shh) path-way. It is known to have a role in the expression of GLI transcription factors whose targets are cell cycle regula-tors [45]. Interestingly, a significant reduction in the
Shh signaling pathway was observed following insuffi-cient water intake. In concert with this, decreased expression of downstream target genes including cell cycle regulators (Cdk1, Cdc20, Ccnd1, Plk1, Bub1b,
Rrm2, Mcm5, Mcm6) and cell differentiation-related molecules (Id1, Id2, Rad9, Birc5) was detected in the RES 1W group (Fig. 4c). Immunoblotting assays were conducted to validate the microarray analysis results for Shh proteins. SHH signaling molecules such as SMO and GLIS1 had a tendency to be reduced in the RES 1W group compared to the control group (p= 0.35) at the protein level (Fig. 4d). Target molecules in the SHH signaling,
Dysregulation of transcriptional network associated with basement membrane integrity in juvenile mice by long-term effects of dehydration
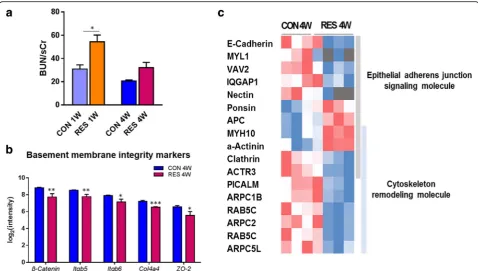
We observed a significant increase in blood urea nitrogen (BUN)/sCr in RES 1W (p< 0.05), and there was an increas-ing tendency in RES 4W (p= 0.08) in the age-matched comparison analysis after prolonged dehydration (Fig. 5a).
To further investigate these results, we conducted com-parison analysis of differentially expressed genes in the kid-neys of RES 4W versus CON 4W. There were significant changes in basement membrane integrity markers. Renal epithelial basement membrane component (Col4a4; 1.6-fold decrease), integrins (Itgb5 and Itgb6; 1.7-fold de-creases), and molecules of cell adhesion including cell tight
junctions or adherens junctions (β-catenin and ZO-2; two-fold decreases) were reduced at the transcription level (Fig. 5b). These results may suggest that prolonged dehy-dration ultimately gave rise to breakdown of basement membrane assembly in the kidneys of juvenile mice, which can be secondary cause to functional disorders and renal pathophysiology.
In order to understand the implicit mechanism under-lying the deterioration of membrane integrity, we con-firmed the top significant pathways by canonical pathway analysis. We found that transcriptional events related to renal structural integrity were intrinsically altered via dysregulation of the epithelial adherens junction and its remodeling pathway (Additional file 3). Cadherin (Cdh1 )-catenin (Ctnnb1) complex and nectin (Pvrl1) complex, which have roles in epithelial cell adhesion integrity and tissue homeostasis, were downregulated by sustained de-hydration. Downstream molecules such as Iqgap1, Actr3, and Vav2 were also decreased at the transcription level, indicating that alteration was observed in the network between cell-cell and cell-extracellular matrix contacts (Fig. 5c, Additional file 3).Iqgap1is a signaling molecule detected during the establishment of foot processes [27]. Especially, 3.4-fold increased expression of α-actinin-4, which is accompanied by foot progress effacement in
damaged podocytes [32], was observed in the RES 4W group. In concert with depressed junction structural sta-bility, many of the differentially regulated genes in the de-hydration group were related to adherens junction recycling. The downstream effect of junction structure re-modeling is implicated in clathrin-mediated endocytosis, which appeared to be suppressed in the dehydration group (Fig. 5c). Clathrin-mediated endocytosis is implicated in the cycling of cellular adhesion proteins [35]. Clathrin (Cltc), a mediator of vesicle formation during endocytosis of the cadherin complex, was decreased by 1.5-fold at the expression level in RES 4W. A gene encoding clathrin recruiting protein,Picalm, also showed decreased expres-sion levels (1.7-fold change).Rab5c, with roles in vesicle docking and trafficking, had reduced transcription levels (1.6-fold change) along with depressed fusion of endocytic vesicles (Fig. 5c). From these results, we demonstrate that the dynamics of cytoskeleton and adherens junction sig-naling, which account for the membrane integrity, were dysregulated at the transcriptional level as a consequence of prolonged dehydration.
Discussion
It was widely accepted that nephrogenesis completes during the embryonic period. However, recent studies unearthed
new facts showing that later genetic events occur in postna-tal renal growth. One study revealed that gene expression from E19.5 to P35 had a postnatal developmental pattern, showing a declining trend in cell differentiation and tissue development with aging in the mouse kidney [50]. In com-paring the kidneys of adults to newborns, molecular trans-porters were found to be dominant in the transcriptome profiles [42]. Concurring with previous results, we identi-fied that kidneys during infancy showed sequential pro-cesses indicating structural and functional maturation. Infantile kidneys, at 4 weeks old, were still differentiating and developed into functionally mature kidneys at 7 weeks old. This result provides critical evidence that postnatal care such as environmental and nutritional interventions is re-quired for normal organ development since early renal dys-function is implicated in various renal disorders in later life [13]. There is, however, a need for further studies to fully elucidate postnatal renal maturation using genetic perturb-ation animal models to elicit the importance of neonatal intervention for optimal growth.
Gene regulatory networks function in a coordinated fashion in kidney organogenesis to maintain kidney integrity [6]. It is, thus, emphasized that genetic devel-opmental processes during the early postnatal life might be in charge of governing kidney health in later life. Moreover, despite the importance of adequate hy-dration in the maintenance of a healthier life, few stud-ies have identified molecular mechanisms underlying the impacts of dehydration [17]. More than that, a fundamental methodological issue related to the experi-mental model of dehydration did not allow us to examine the true effects of dehydration. For instance, dehydration induced by acute water deprivation or heat and exercise stimulus could accompany or promote ad-verse physiological changes related to the dehydrating condition. Those also are incapable of generating con-sistent and controlled state of dehydration [28]. Here, we aimed to generate mild dehydration in animals, re-producing the condition of individuals that drink less water daily during the life cycle. With this approach, we were able to verify the molecular mechanisms under-lying sustained moderate dehydration by profiling renal transcriptomes and anticipated its utility for the under-standing of fundamental mechanisms underlying pediatric dehydration in the context of renal development.
We looked into the implications of dehydration throughout the early postnatal stage, from 4 to 7 weeks. Among corresponding mediators in kidney morphogen-esis, the Shh signaling pathway and downstream target genes involved in the cell cycle and cell differentiation were downregulated as a consequence of dehydration.
Shh is described as an important signaling molecule in renal patterning and the cell cycle during embryonic renal development [14]. Of its effectors, Glis1 has a
possible regulatory role in retaining normal morpho-logical integrity in the kidney [20, 47]. Since the tran-scription level of Glis1was reduced and its target genes were changed in their expressions in the dehydration group, it is possible that genetic events associated with cell proliferation, differentiation, and death were impli-cated under improper hydration conditions.
functional perturbation, leading to increased BUN/sCr ratio [10]. It is, therefore, conceivable that reduced membrane integrity impairs glomerular barrier function followed by improper tissue morphogenesis and homeo-stasis. However, it still needs histological and functional analysis to show direct evidence of physiological derange-ment or pathological changes of renal morphology in future studies.
Interestingly, prolonged dehydration during infancy resulted in reduced plasma creatinine levels. Based on present knowledge, reduction in the pool size or rate of creatinine metabolism, known as a “creatinine deficit,” may account for the reduction in plasma creatinine under pathophysiologic conditions [12, 19]. Otherwise, we assume that failure in toxic substance clearance by renal insufficiency resulted in hyper toxic loads, aug-menting systemic disorders in animals. While plasma creatinine is one of the most frequently used markers for kidney disease, it could blunt the early diagnosis of pediatric renal diseases in cases where the clinical marker is arbitrarily estimated. We, hereby, suggest that plasma creatinine might underestimate the significance of renal disorders in pediatric dehydration. Thus, it is noted that different clinical markers are required for pediatric renal disorders. Meanwhile, at the onset of dehydration, dehydrated mice exhibited reduced diet consumption during the first few days (Additional file 4). Despite catching up to normal diet intake after the first week of the dehydration experiment, insufficient energy intake could be a cause of developmental disor-ders in the situation of impaired renal development in pediatric dehydration. Notwithstanding, it is noted that animals have different patterns of eating behavior with reduced appetite under high osmolar stimulus while they are subjected to strict control of osmolality [15]. Given the complexity of the physiological response, therefore, we suggest that changes in eating behavior are a validated consequence of physiological adaptation to water deprivation [15].
In this research, we demonstrate transcriptional events during renal development in infancy and show that the impacts of inadequate water intake in the early postna-tal stage heavily rely on the impairment of normal renal maturation. This finding suggests that optimal nutri-tional intervention would be required for successful renal development.
Conclusions
Altogether, this study gives us better insights into the effects of dehydration on functionally immature kid-neys of infants and may provide possible markers for clinical applications in pediatric dehydration. In this respect, this study could be a cornerstone providing predictive biomarkers for future examination of known
renal diseases and a broadened perspective of pediatric renal defects during development.
Additional files
Additional file 1:Differentially expressed genes during normal renal development from infancy to juvenile period. Differentially expressed genes in a comparison analysis between CON 1W and CON 4W group, with statistical significant change (p< 0.05 and fold change >1.5). (XLSX 24 kb)
Additional file 2:Upstream regulators in infantile renal development. Upstream regulator analysis shows the top predicted regulators that connected to the downstream nodes. Activation z-score of each regulator is presented in brackets. Edges indicate predicted relationships, colored with yellow and blue when it led to activation and inhibition, respectively. (TIF 8929 kb)
Additional file 3:Dysregulation of transcriptional network associated with cell junction dynamics. (A) Top canonical pathways that were differentially regulated following dehydration in juvenile mice. (B) Suppression of adherens junction signaling accounts for altered cytoskeleton rearrangement, which caused alteration of glomerular barrier integrity. Genes in green and red color were down- and upregulated, respectively. (TIF 5873 kb)
Additional file 4:Diet intake during experimental period. Animals in the dehydration group exhibited reduced diet consumption during the first few days but caught up to normal diet intake after the first week of the dehydration experiment. Data are expressed as mean ± SEM. Student’st test; *p< 0.05 versus control group. (TIF 45 kb)
Abbreviations
Avp:Arginine vasopressin; BUN: Blood urea nitrogen; ECM: Extracellular matrix; GO: Gene ontology; GSEA: Gene set enrichment analysis; PCA: Principal component analysis; PKD: Polycystic kidney disease; sCr: Serum creatinine; SHH: Sonic hedgehog
Acknowledgements
This work was supported by the Coway Co., Ltd.
Availability of data and materials
Microarray dataset is available at the Gene Expression Omnibus (www.ncbi.nlm.nih.gov/geo/, accession number GSE75604).
Authors’contributions
DS designed and conceived the study and helped to draft the manuscript. CK carried out the experiments (animal care, biochemical and gene expression analysis, and Western blotting) and the statistical analysis and drafted the manuscript. Both authors read and approved the final manuscript.
Competing interests
The authors declare that they have no competing interests.
Ethics approval and consent to participate
All experimental procedures were approved by the IACUC (Institutional Animal Care and Use Committee) of Seoul National University and conducted according to the IACUC guidelines.
Received: 10 March 2016 Accepted: 3 October 2016
References
1. Bates CM, Kharzai S, Erwin T, Rossant J, Parada LF. Role of N-myc in the developing mouse kidney. Dev Biol. 2000;222:317–25.
2. Baxter J, Yoffey J. The post-natal development of renal tubules in the rat. J Anat. 1948;82:189.
4. Bonventre JV. Dedifferentiation and proliferation of surviving epithelial cells in acute renal failure. J Am Soc Nephrol. 2003;14:S55–61.
5. Boutet A, De Frutos CA, Maxwell PH, Mayol MJ, Romero J, Nieto MA. Snail activation disrupts tissue homeostasis and induces fibrosis in the adult kidney. EMBO J. 2006;25:5603–13.
6. Burrow CR. Regulatory molecules in kidney development. Pediatr Nephrol. 2000;14:240–53.
7. Clark SL. Cellular differentiation in the kidneys of newborn mice studied with the electron microscope. J Biophys Biochem Cytol. 1957;3:349–62. 8. ČukuranovićR, VlajkovićS. Age related anatomical and functional
characteristics of human kidney. Organ. 2005;7:14.
9. D'Anci KE, Constant F, Rosenberg IH. Hydration and cognitive function in children. Nutr Rev. 2006;64:457–64.
10. de Barros Sene L, Mesquita FF, de Moraes LN, Santos DC, Carvalho R, Gontijo JAR, Boer PA. Involvement of renal corpuscle microRNA expression on epithelial-to-mesenchymal transition in maternal low protein diet in adult programmed rats. PLoS One. 2013;8(8):e71310.
11. Denker BM, Sabath E. The biology of epithelial cell tight junctions in the kidney. J Am Soc Nephrol. 2011;22:622–5.
12. Doi K, Yuen PS, Eisner C, Hu X, Leelahavanichkul A, Schnermann J, Star RA. Reduced production of creatinine limits its use as marker of kidney injury in sepsis. J Am Soc Nephrol. 2009;20:1217–21.
13. Dressler GR. Advances in early kidney specification, development and patterning. Development. 2009;136:3863–74.
14. Gill PS, Rosenblum ND. Control of murine kidney development by sonic hedgehog and its GLI effectors. Cell Cycle. 2006;5:1426–30.
15. Greenwood MP, Mecawi AS, Hoe SZ, Mustafa MR, Johnson KR, Al-Mahmoud GA, Elias LL, Paton JF, Antunes-Rodrigues J, Gainer H. A comparison of physiological and transcriptome responses to water deprivation and salt loading in the rat supraoptic nucleus. Am J Phys Regul Integr Comp Phys. 2015;308:R559–68.
16. Humphreys BD. Kidney structures differentiated from stem cells. Nat Cell Biol. 2014;16:19–21.
17. Jéquier E, Constant F. Water as an essential nutrient: the physiological basis of hydration. Eur J Clin Nutr. 2010;64:115–23.
18. Johnson RJ, Alpers CE, Yoshimura A, Lombardi D, Pritzl P, Floege J, Schwartz SM. Renal injury from angiotensin II-mediated hypertension. Hypertension. 1992;19:464–74.
19. Jones JD, Burnett PC. Creatinine metabolism in humans with decreased renal function: creatinine deficit. Clin Chem. 1974;20:1204–12.
20. Kang HS, ZeRuth G, Lichti-Kaiser K, Vasanth S, Yin Z, Kim Y-S, Jetten AM. Gli-similar (Glis) Krüppel-like zinc finger proteins: insights into their physiological functions and critical roles in neonatal diabetes and cystic renal disease. Histol Histopathol. 2010;25:1481.
21. Kim T-M, Ramírez V, Barrera-Chimal J, Bobadilla NA, Park PJ, Vaidya VS. Gene expression analysis reveals the cell cycle and kinetochore genes
participating in ischemia reperfusion injury and early development in kidney. PLoS One. 2011;6:e25679.
22. Krämer A, Green J, Pollard J, Tugendreich S. Causal analysis approaches in ingenuity pathway analysis (IPA). Bioinformatics. 2013;29:btt703. 23. Kuure S, Vuolteenaho R, Vainio S. Kidney morphogenesis: cellular and
molecular regulation. Mech Dev. 2000;92:31–45.
24. Larsson L, Aperia A, Wilton P. Effect of normal development on compensatory renal growth. Kidney Int. 1980;18:29–35.
25. LeBleu VS, MacDonald B, Kalluri R. Structure and function of basement membranes. Exp Biol Med. 2007;232:1121–9.
26. Lee DB, Huang E, Ward HJ. Tight junction biology and kidney dysfunction. Am J Physiol Renal Physiol. 2006;290:F20–34.
27. Lehtonen S, Ryan JJ, Kudlicka K, Iino N, Zhou H, Farquhar MG. Cell junction-associated proteins IQGAP1, MAGI-2, CASK, spectrins, andα-actinin are components of the nephrin multiprotein complex. Proc Natl Acad Sci U S A. 2005;102:9814–9.
28. Lieberman HR. Hydration and cognition: a critical review and recommendations for future research. J Am Coll Nutr. 2007;26:555S–61.
29. Masento NA, Golightly M, Field DT, Butler LT, van Reekum CM. Effects of hydration status on cognitive performance and mood. Br J Nutr. 2014; 111:1841–52.
30. McKinley MJ, Johnson AK. The physiological regulation of thirst and fluid intake. Physiology. 2004;19:1–6.
31. Muller U, Brandli A. Cell adhesion molecules and extracellular-matrix constituents in kidney development and disease. J Cell Sci. 1999;112:3855–67.
32. Pavenstädt H, Kriz W, Kretzler M. Cell biology of the glomerular podocyte. Physiol Rev. 2003;83:253–307.
33. Popkin BM, D'Anci KE, Rosenberg IH. Water, hydration, and health. Nutr Rev. 2010;68:439–58.
34. Quinn L, Latham S, Kalionis B. The homeobox genes MSX2 and MOX2 are candidates for regulating epithelial–mesenchymal cell interactions in the human placenta. Placenta. 2000;21:S50–4.
35. Rappoport JZ, Simon SM. Real-time analysis of clathrin-mediated endocytosis during cell migration. J Cell Sci. 2003;116:847–55. 36. Reiser J, Kriz W, Kretzler M, Mundel P. The glomerular slit diaphragm is a
modified adherens junction. J Am Soc Nephrol. 2000;11:1–8.
37. Rodriguez-Soriano J, Vallo A, Castillo G, Oliveros R. Renal handling of water and sodium in infancy and childhood: a study using clearance methods during hypotonic saline diuresis. Kidney Int. 1981;20:700–4.
38. Schedl A. Renal abnormalities and their developmental origin. Nat Rev Genet. 2007;8:791–802.
39. Schwab K, Patterson LT, Aronow BJ, Luckas R, Liang H-C, Potter SS. A catalogue of gene expression in the developing kidney. Kidney Int. 2003;64:1588–604.
40. Shannon P, Markiel A, Ozier O, Baliga NS, Wang JT, Ramage D, Amin N, Schwikowski B, Ideker T. Cytoscape: a software environment for integrated models of biomolecular interaction networks. Genome Res. 2003;13:2498–504.
41. Shon W-J, Lee Y-K, Shin JH, Choi EY, Shin D-M. Severity of DSS-induced colitis is reduced in Ido1-deficient mice with down-regulation of TLR-MyD88-NF-kB transcriptional networks. Sci Rep. 2015;5:17305.
42. Stuart RO, Bush KT, Nigam SK. Changes in global gene expression patterns during development and maturation of the rat kidney. Proc Natl Acad Sci. 2001;98:5649–54.
43. Sturn A, Quackenbush J, Trajanoski Z. Genesis: cluster analysis of microarray data. Bioinformatics. 2002;18:207–8.
44. Thiagarajan RD, Georgas KM, Rumballe BA, Lesieur E, Chiu HS, Taylor D, Tang D, Grimmond SM, Little MH. Identification of anchor genes during kidney development defines ontological relationships, molecular subcompartments and regulatory pathways. PLoS One. 2011;6:e17286. 45. Uhlenhaut NH, Treier M. Transcriptional regulators in kidney disease:
gatekeepers of renal homeostasis. Trends Genet. 2008;24:361–71. 46. Vainio S, Lin Y. Coordinating early kidney development: lessons from gene
targeting. Nat Rev Genet. 2002;3:533–43.
47. Vasyutina E, Treier M. Molecular mechanisms in renal degenerative disease. Seminars in Cell & Developmental Biology. Acad Press. 2010;21:831–7. 48. Welham SJ, Wade A, Woolf AS. Protein restriction in pregnancy is associated
with increased apoptosis of mesenchymal cells at the start of rat metanephrogenesis. Kidney Int. 2002;61:1231–42.
49. Welsh GI, Saleem MA. The podocyte cytoskeleton—key to a functioning glomerulus in health and disease. Nat Rev Nephrol. 2012;8:14–21. 50. Wu B, Sahoo D, Brooks JD. Comprehensive gene expression changes
associated with mouse postnatal kidney development. J Urol. 2013;189: 2385–90.
• We accept pre-submission inquiries
• Our selector tool helps you to find the most relevant journal
• We provide round the clock customer support
• Convenient online submission
• Thorough peer review
• Inclusion in PubMed and all major indexing services
• Maximum visibility for your research
Submit your manuscript at www.biomedcentral.com/submit