R E S E A R C H
Open Access
Multiphysics model of a rat ventricular
myocyte: A voltage-clamp study
Abhilash Krishna
1, Miguel Valderrábano
2, Philip T Palade
3and John W Clark Jr
1**Correspondence: [email protected]
1Department of Electrical and
Computer Engineering, Rice University, 6100 Main Street, Houston, 77005, USA Full list of author information is available at the end of the article
Abstract
Background: The objective of this study is to develop a comprehensive model of the electromechanical behavior of the rat ventricular myocyte to investigate the various factors influencing its contractile response.
Methods: Here, we couple a model ofCa2+dynamics described in our previous work, with a well-known model of contractile mechanics developed by Rice, Wang, Bers and de Tombe to develop a composite multiphysics model of excitation-contraction coupling. This comprehensive cell model is studied under voltage clamp (VC) conditions, since it allows to focus our study on the elaborateCa2+signaling system that controls the contractile mechanism.
Results: We examine the role of various factors influencing cellular contractile response. In particular, direct factors such as the amount of activatorCa2+available to trigger contraction and the type of mechanical load applied (resulting in
isosarcometric, isometric or unloaded contraction) are investigated. We also study the impact of temperature (22 to 38°C) on myofilament contractile response. The critical role of myofilamentCa2+sensitivity in modulating developed force is likewise studied, as is the indirect coupling of intracellular contractile mechanism with the plasma membrane via theNa+/Ca2+exchanger (NCX). Finally, we demonstrate a key linear relationship between the rate of contraction and relaxation, which is shown here to be intrinsically coupled over the full range of physiological perturbations.
Conclusions: Extensive testing of the composite model elucidates the importance of various direct and indirect modulatory influences on cellular twitch response with wide agreement with measured data on all accounts. Thus, the model provides mechanistic insights into whole-cell responses to a wide variety of testing approaches used in studies of cardiac myofilament contractility that have appeared in the literature over the past several decades.
Background
Cardiac muscle contraction is a result of a transient increase in myoplasmicCa2+ con-centration [Ca2+]
myo. Sarcolemmal (SL) membrane depolarization triggersCa2+influx via dihydropyridine (DHP)-sensitive L-typeCa2+ channels. Following diffusion across a small sub-membrane dyadic space, this influx activates ryanodine receptors (RyRs) controlling ryanodine-sensitiveCa2+release channels in the junctional portion of the sar-coplasmic reticulum (jSR). Fabiato and Fabiato [1] named the process calcium-induced calcium release (CICR). Ca2+ subsequently diffuses from the dyadic space into the
myoplasm. Ultimately, myoplasmicCa2+ concentration [Ca2+]myo is returned to rest-ing levels by combination of: (a)Ca2+buffering in the dyadic space and myoplasm; (b) sequestration ofCa2+y by sarcoplasmic/endoplasmic reticulumCa2+-ATPase (SERCA)-type calcium pumps lining the longitudinal portion of the sarcoplasmic reticulum (LSR); and (c)Ca2+extrusion from the myoplasm byNa+/Ca2+exchangers andCa2+-ATPase pumps on the sarcolemmal membrane.
Ca2+is an extremely important and highly versatile second messenger in cardiac cells, which plays a crucial role not only in excitation-contraction (E-C) coupling but also in excitation-transcription coupling [2]. Various inter-connectedCa2+signalling pathways help preserve the integrity of the cellular Ca2+ system despite any disturbances (e.g., changes in stimulation frequency or inotropic state). A key role for the dyadic Ca2+
release system is the formation of an adequate myoplasmicCa2+transient that can serve as an input driving signal for the intracellular contractile machinery (the myofilaments). The resultant contractile response is conditioned by a number of additional factors that include the mechanical load; sarcomere equilibrium length; myofilamentCa2+sensitivity; and the temperature. Although it is well-known that the contractile response of a cell is a function of the stimulation frequency (its force-frequency response (FFR)), this study is limited to an investigation at 5 Hz (unless otherwise specified), a physiologically relevant heart rate for a rat ventricular myocyte.
Computational methods
All simulations and analysis were performed on a 2.8GHz Intel CoreTM2 Duo CPU-based computer using Microsoft Windows XP operating system. The sarcolemmal mem-brane charge balance equations, theCa2+material balance equations in the myoplasm and SR, and the force balance equations describing the model for myofilament con-traction constitute a set of 93 ordinary differential equations (ODEs). A fixed-step Merson-modified Runge-Kutta 4th-order numerical integration scheme [3] was used to solve this set of 1st-order differential equations (ODE) describing the dynamic model. The freeCa2+ concentration in the dyad is governed by the time courses of theCa2+ fluxes throughCa2+transport systems, as well as by the time course ofCa2+binding to
Ca2+buffers present in the junction [4]. Description of the spatio-temporal dynamics of calcium transients in the dyad triggered byCa2+stimulus (basis of CICR) requires calcu-lation of the partial differential equations (PDE) of the whole reaction-diffusion system. Formation and dissipation ofCa2+ gradients around an open channel (DHP-sensitive and Ry-sensitive channels in the dyad) is assumed instantaneous as was validated for microsecond timescale and nanoscopic space by Naraghi and Neher [5]. LocalCa2+ con-centration in the vicinity of open channels (located on opposing boundaries of the dyadic space) was calculated as the steady state gradient around a point source [6]. TheCa2+
Ca2+diffusion by solving the 2-D Laplacian equation (Krishna et al. [4], Appendix A3, Eq. 140) in the DCU without explicitly accounting for local potential fields. More specif-ically, an explicit finite difference scheme was used to solve these Laplacian equations describingCa2+-diffusion in the dyadic space analogous to the method detailed in Smith et al. [9]. Specifically, a radial symmetry is employed in solving the PDE in the dyadic vol-ume allowing the solution to be computed in a rectangular cross-section discretized into a 20 by 20 cartesian grid. The spatial step size used in the r and z-direction (Figure 1B, Krishna et al. [4]) was 10 nm and 0.76 nm respectively (Table two, Krishna et al. [4]). We use the method of lines (discretization in space) to solve the PDE. The full set of ODEs and finite difference equations are solved simultaneously to obtain the complete solution. Execution of a single cycle which translates to 200 ms at 5 Hz took 21 seconds with a time step of 1μs. Results were visualized using Matlab (Mathworks, Natick, MA) and Origin (OriginLab Corp., Northampton, MA).
Model development
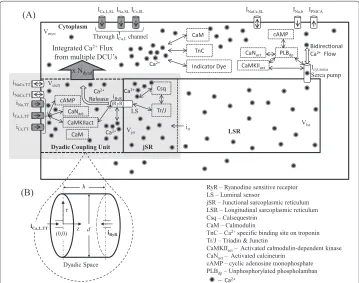
Our objective was to develop an integrated model of the rat ventricular cell under voltage clamp conditions, which includes the description of variousCa2+ signalling pathways in the dyadic space, the myoplasmic medium and the sarcoplasmic reticulum (Figure 1,
Figure 1 Cellular fluid compartments.(A) Model configuration showing dyadic space, jSR, LSR, myoplasm and SL; (B) Inset provides a more detailed description of the dyadic space showing the coupling of the two types ofCa2+channels (trigger andCa2+release channels) via the dyadic fluid medium. Only one
adopted from Krishna et al. [4]) as well as a comprehensive coupled mechanical system describing the contractile machinery responsible for force generation.
Electrochemical description ofCa2+sub-system
Our model for the electrochemical description of the cell consists of an electrical-equivalent model for the cell membrane and a fluid-compartment model describing the flux of ionic species between the extracellular and several intracellular compartments (cell cytosol, SR and the dyadic coupling unit (DCU), in which resides the mechanistic basis of CICR). The DCU is described as a controller-actuator mechanism, internally stabi-lized by negative feedback control of the unit’s two diametrically-opposedCa2+channels (trigger-channel and release-channel). It releasesCa2+flux into the cytoplasm and is in turn enclosed within a negative feedback loop involving the SERCA pump, regulating [Ca2+]myo. A detailed description of the membrane classification, channel and exchanger distribution as well as the various fluid compartments involved is given in Krishna et al. [4]. Our model for the electrochemical description of theCa2+sub-system is based on our previous work [4] with the following modifications: (a) the rate constants used to model L-typeCa2+current (ICa,L), maximumNa+/Ca2+exchanger current (INaCa), maximum plasma membraneCa2+-ATPase current (IPMCA) and the maximal uptake rate of the SERCA pump are Q10adjusted using the values given in Table 1 to model tempera-ture dependence; (b) The effect of cAMP-mediatedβ-adrenergic stimulation is modeled by allowing the relative regulatory activity of PKA to be a function of the available isoproterenol concentration (Appendix, Equations 5-7).
Mechanical description of myofilament contractile system
Our model for cardiac contractile mechanics (Figure 2) is based on the approximate model of cooperative activation and crossbridge cycling reported by Rice et al. [13] with the following modifications: (a) the first-order rate constants for the transformation of the troponin/tropomyosin regulatory complex (outside the single overlap region between the thick and thin filaments) from a crossbridge non-permitting state to a crossbridge permitting state and vice-versa are chosen as 500 s-1 and 50 s-1 respectively in order to reproduce results reported by Rice et al. [13]; (b) theβ-adrenergic agonist isopro-terenol (ISO) is known to cause a decrease in myofilamentCa2+sensitivity as a result of protein kinase A (PKA) mediated phosphorylation of troponin I [15,16] at Ser23/Ser24. Specifically, a two-state Markovian model is added to allow isoproterenol-dependent PKA-mediated interaction between troponin I (TnI) and theCa2+-binding regulatory site on troponin. As shown in Figure 2, state TnIu, which denotes the unphosphorylated form of TnI, modulates theCa2+affinity of the regulatory site on troponin. This is in agreement
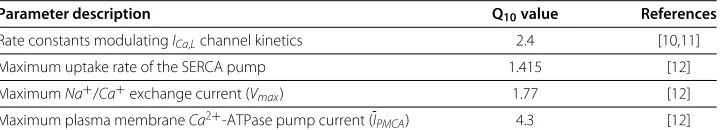
Table 1 Q10values used to model temperature variation
Parameter description Q10value References
Rate constants modulatingICa,Lchannel kinetics 2.4 [10,11]
Maximum uptake rate of the SERCA pump 1.415 [12]
MaximumNa+/Ca+exchange current (Vmax) 1.77 [12]
Maximum plasma membraneCa2+-ATPase pump current (IPMCA) 4.3 [12] Q10values in the electromechanical model were adopted from Rice et al. [13] with Qfapp, Qhf, Qhband Qgxbdecreased to 2.25 to
Sarcomere length (SL)
Single overlap fraction for Actin (SOF_A)
Non state variable State variable Single overlap
fraction for Myosin (SOF_M)
Apparent Ca bound to Troponin (Trop_app)
Cytosolic Ca2+
transient ([Ca2+]myo)
RCaT_H RCaT_L
Fraction of Ca2+bound
Troponin regulatory units (T_Reg) XB_PreR XB_PostR P_XB xXB_PreR xXB_PostR N_XB X X
Fraction of strongly-bound crossbridges (F_SBXB) Fraction of strongly-bound crossbridges (F_SBXB)
Active component of force (F_active)
Force components Passive component of
force (F_passive) Change from length at rest
Afterload component of force (F_afterload) Fixed length with internal contraction
Constant afterload for isometric contraction
Preload component of force (F_Preload)
If initial length (SL0)≠ length at rest (Slrest)
F_Preload = F_Passive (SL0)
Net integral force (Force)
RCaT_H - Fractional population of Ca2+bound high affinity regulatory site on Troponin
RCaT_L - Fractional population of Ca2+bound low affinity regulatory site on Troponin
N_NoXB - Non-permissive confirmation of the regulatory protein with no nearby crossbridges P_NoXB - Permissive confirmation of the regulatory protein with no nearby crossbridges N_XB - Non-permissive confirmation of the regulatory protein
P_XB - Permissive confirmation of the regulatory protein
XB_PreR - Fractional occupancy of the strongly bound pre-rotated state (before isomerization) XB_PostR - Fractional occupancy of the strongly bound post-rotated state (after isomerization) xXB_PreR - Mean distortion corresponding to state XB_PreR
xXB_PostR - Mean distortion corresponding to state XB_PostR
TnIu– Unphosphorylated troponin I
TnIp– Phosphorylated troponin I
N_NoXB P_NoXB
TnIu TnIp
TnIu TnIu
Figure 2 Model for cardiac electro-mechanics.Cooperative activation and crossbridge cycling. Model for cardiac electro-mechanics and force generation based on Rice et al. [13] shows states in non-permissive and permissive confirmations of the regulatory proteins. The permissive state transitions into a pre-rotated (XB_PreR) state having a strongly bound crossbridge with the head extended. The transition to the post-rotated (XB_PostR) force-generating state represents the isomerization to induce strain in the extensible neck region. Activation is triggered by the fraction ofCa2+bound troponin regulatory units (T_Reg) which sets the rate constant for transition between the non-permissive (N_XB) to permissive (P_XB) confirmation of the regulatory protein using a strong nonlinearity function to indicate cooperativity. The model assumes that troponin for regulation has affinity set by the thin filament overlap. The affinity for apparentCa2+binding (used to perturb [Ca2+]myo), not only depends on thin filament overlap but also increases as crossbridges
strongly bind to populate the pre-rotated and post-rotated states. The regulatory and apparentCa2+binding terms are calculated separately to avoid a global feedback from strongly-bound crossbridges toCa2+ binding causing nonphysiologicalCa2+sensitivity [13].
contractility, particularly in frequency dependent acceleration of relaxation), we refrain from modeling this effect as the molecular mechanisms involved remain unresolved.
Testing protocol
We employ our coupled multiphysics model describing the electrochemical as well as the mechanical subsystems to study cellular contraction emphasizing the various modulatory influences that are at play. We begin with a detailed analysis of different types of twitch response to better understand the influence of various factors such as sarcomere length, peak [Ca2+]
myo and the stiffness of the contractile element in cell shortening, followed by a comparative study of these twitch responses. The negative feedback of cellular con-traction on the myoplasmicCa2+-transient [19,20] is also investigated. We then perform an idealized virtual experiment similar to that carried out in an experimental study [21] to uncover the regulation of cell contraction byNa+/Ca2+exchange, and in the process identifying the role of the SERCA pump in facilitating this effect. We then model the effects of temperature [22] on cardiac contractile response. This is followed by a study identifying the role of myofilamentCa2+sensitivity as a key factor influencing the degree of cell shortening. In particular, the effect ofβ-adrenergic agonist isoproterenol, which is known to cause a decrease in myofilamentCa2+sensitivity [15], is investigated. Hence, we have developed an integrated multiphysics model of rat ventricular cell electrome-chanics and now seek to study its response to various tests prescribed by elements of the virtual protocol above. In doing so, we hope to identify and clarify the role played by key factors involved in modulation of the cell’s contractile response.
Results
From our modeling standpoint, the dyadic coupling unit (DCU) as defined by Krishna et al. [4] is a fundamental element involved in the mechanism of CICR. This previous study described the control features of this unit, as well as its interaction with the SERCA pump and free sarcolemmal pumps and exchangers to achieve a homeostatic regulation of myoplasmicCa2+concentration. We now extend our voltage clamp studies to address the subject of force generation following CICR, starting with the classical twitch responses below.
Twitch responses
clamp protocol used is a 50 ms step pulse to 10 mv from a holding potential of -40 mv. In this study, we report a normalized force with a maximum value of 1 possible under optimal conditions such as high [Ca2+]myo, isosarcometric loading (SL = 2.3μm) and low temperature allowing maximum overlap of thick and thin filaments.
Isosarcometric contraction
As mentioned above, in isosarcometric contraction, SL is maintained constant via exter-nal feedback control. We simulate this type of contraction under two distinct conditions: modulation of developed force by fixed changes in (A) SL, and (B) myoplasmicCa2+ con-centration. In case ‘A’ while SL is fixed at different values, the inputCa2+-transient is kept identical (elicited by the standard 50 ms voltage clamp pulse at 5 Hz). In case ‘B’ while the level of activatorCa2+is modulated, SL is kept fixed at 2.3μm.
(A) The steady state force-[Ca2+] (F-Ca) relationship shown in Figure 3A-i exhibits a leftward shift and an increase in developed maximum plateau force as SL is clamped at increasing lengths. This leftward shift results from an increase in myofilamentCa2+ sen-sitivity as SL is increased. Figure 3A-ii shows the temporal course of normalized force as SL is changed in steps from 1.8 to 2.3μm. The waveshape of standardCa2+-transient is overlaid in dotted lines in this figure. Although an increase in SL (traces marked + to∗) does not cause a large variation in the time to peak force (TTP), it does result in an increase in peak force magnitude and twitch duration as the result of an increase in myofilamentCa2+sensitivity. These characteristics show a strong correspondence with measured data from rat ventricular myocytes tested at similar (∼22.5°C) temperatures [14,24,26]. The correlation coefficient of the speed of contraction and relaxation has been experimentally observed [27] to be very close (>0.98). The inset in Figure 3A-ii is a plot of the rate of relaxation (reciprocal of time taken for 50% sarcomere relaxation (RT50)) ver-sus rate of contraction (reciprocal of time taken for peak sarcomere contraction (TTP)) for increasing SL. This linear relationship highlights contraction-relaxation coupling, and represents a key intrinsic property of the contractile myofilaments [27]. Figure 3A-iii shows the phase plots of self normalized force versus the instantaneousCa2+ concentra-tion in the cytosol for increasing SL (traces marked + to∗) overlayed with two steady state F-Ca relationships corresponding to SL = 1.8μm (+) and SL = 2.3μm (∗). The assessment of dynamic and steady-stateCa2+relationships allows better analysis of the phase-plane loops of force versus [Ca2+]. The active twitch curve is related to the steady-state val-ues to determine, at what isochrone the dynamic force-[Ca2+] value equals that obtained in the steady-state relationship. This point of intersection of the steady state F-Ca trace and the corresponding phase plot gives the contraction-relaxation coupling point (CRCP, marked as◦) from initiation of stimulation [16]. Time is implicit on the phase trajectory and at time instants prior to reaching the critical coupling point for a particular trajectory, [Ca2+]myoexceeds the value ofCa2+predicted by the steady state F-Ca relationship. This excess favors continued sarcomere contraction. At later time points beyond the CRCP, the developed force is greater than that predicted by the steady state curve, which favors myofilament relaxation.
0.1 0.2 0.3 0.4 0.5 0.6 0.7 0.8 0.9 1.5 µm 2.0 µm 2.25 µm Norm alized Force (unitless) SL Increasing myofilament calcium sensitivity 1.75 µm
100.2 100.3 0.1 0.2 0.3 0.4 0.5 0.6 0.7 0.8 0.9
[Ca2+]
myo 0.4 µM
0.5 µM 0.6 µM (i) Norm alized Force (unitless) 0.7 µM
(B)
(i)(A)
0 200 400 600 800 1000 0.1 0.2 0.3 0.4 0.5 0.6
0 200 400 600 800 1000 0.2 0.4 0.6 0.8 1
[Ca2+] myo
(ii) (ii)
0 0.2 0.4 0.6 0.8 1 0.1 0.2 0.3 0.4 0.5 0.6 Norm alized Force (unitless) * + SL + *
[Ca2+] myo (µM)
0 200 400 600 800 1000 0 0.1 0.2 0.3 0.4 0.5 0.6 Time (ms) •
[Ca2+] myo *
Sarcomere length (µm)
0 0.2 0.4 0.6 0.8 1 0 0.1 0.2 0.3 0.4 0.5 0.6 Norm
alized Force (unitless)
[Ca2+] myo (µM) •
[Ca2+] myo *
11 11.5 12 12.5 13 9 10 11 12 13 14 15
1/TtP (s-1)
1/ R T 50 ( s -1) + SL * Time (ms) [Ca 2+] my o (µM) (iii) (iii)
1/TTP (s-1)
1/ RT 50 (s -1) SL Norm alized Force (unitless)
0.6 0.8 1 128 130 132 134 136 138 TD 50 (m s)
Peak [Ca2+] myo (µM)
0.1 1.0 5.0
[Ca2+] myo (µM)
Norm
alized Force
(unitless)
Figure 3 Isosarcometric contraction.Twitch response - Isosarcometric contraction (A) Modulation of sarcomere length - (i) Steady state F-Ca relationships for increasing SL. (ii) Traces for normalized force with SL varied from 1.8 (+) to 2.3 (∗)μm in increments of 0.1μm. TheCa2+transient responsible for each of the traces is shown in the overlay. The inset shows the rate of relaxation versus rate of contraction for increasing sarcomere length (reciprocal of RT50, time taken for 50% sarcomere relaxation versus reciprocal of TTP, time
taken for peak sarcomere contraction). (iii) Phase plots of self normalized force versus instantaneous [Ca2+]myofor increasing SL overlayed with two steady state F-Ca relationships corresponding to SL = 1.8 (+) and 2.3μm (∗). (B) Modulation of Peak [Ca2+]myo- (i) Steady state F-SL relationships for increasing background [Ca2+]myo. (ii) Sarcomere length is held constant at 2.3μm while the peak [Ca2+]myotransient is scaled down by decreasing the voltage clamp pulse duration. The traces show the contractile response corresponding to myoplasmicCa2+transients with peak values 1.1(∗), 0.9, 0.8, 0.7, 0.6, 0.5 (•)μM. The inset shows the relationship between TD50(time taken from 50% activation to 50% relaxation) and activatorCa2+.
[Ca2+]myo transient by adjusting the voltage clamp pulse duration (an increase in pulse duration from 5 ms to 50 ms increased peak [Ca2+]myofrom 0.5 to 1.1μM respectively). This protocol allows for the peak of the transient to be changed without a significant change in the duration of the transient (Krishna et al. [4] ; Figure 4). The traces correspond to increasing peak values from 0.5 (•) to 1.1 (∗)μM. Although similar to case with increas-ing SL, increasincreas-ing activatorCa2+results in a relatively non-linear increase in peak force generated. As shown in Figure 3A-i, the steady state F-Ca relationship is characterized by a Hill function as experimentally observed [25]. The time-to-peak force (TTP) remains relatively unaffected by the amount of activatorCa2+causing the twitch response. Inset in Figure 3B-ii shows the dependence of TD50 (time taken from 50% activation to 50% relaxation) on peak [Ca2+]myoindicating an increase in twitch duration with increasing levels of activatorCa2+. Figure 3B-iii shows the phase plots of self normalized force ver-sus the instantaneousCa2+concentration in the myoplasm for increasing peak [Ca2+]
myo (traces marked•to∗) overlayed with a steady state F-Ca relationships corresponding to SL = 2.3μm (∗). The contraction-relaxation coupling point (◦) traverses along the F-Ca relationship to increasing values of [Ca2+] and force with increasing peak [Ca2+]myo.
Unloaded contraction
The protocol for the unloaded case is as follows. The cell is not stretched with pre-load so that the series elastic element is unattached and is therefore not in play. In the model of Rice et al. ([13]; Figure 1), the contractile element is shunted by elastic and viscous damping elements. In that figure, the nonlinear elastic element is characterized by a cubic force vs SL characteristic centered about an equilibrium point (SL0=1.9μm; F=0). In the unloaded case without stimulation, any stored energy in the system is dissipated and SL decays to the equilibrium point on the passive force vs SL characteristic. With electri-cal activation and subsequentCa2+release, active force is developed and SL shortening occurs against the aforementioned passive restoring forces. Providing the same sequence of voltage clamp pulses as in Figure 5, an identical sequence ofCa2+-transients is pro-duced to drive the active contractile mechanism. Figure 5A is a plot of total developed force (active and passive) as a function of peak [Ca2+]myo. This net instantaneous force can become negative when the magnitude of the passive forces exceeds that of the active component (Figure 5A). Thus, an increase in activatorCa2+causes an increase in peak force generated, which translates into enhanced shortening. Corresponding changes in sarcomeric length as shown in Figure 5B indicate that increasing levels of activatorCa2+
result in a decrease in time to peak (TTP declined from 156.0 ms (•) to 70.5 ms (∗)) and an increase in the rate of relaxation (RT50computed from time of peak decreased from 183.0 ms (•) to 157.5 ms (∗)).
Isometric contraction
0 200 400 600 800 1000 1.7
1.75 1.8 1.85 1.9
0 100 200 300 400 500 600 700 800 900 1000 -0.005
0 0.005 0.01 0.015 0.02 0.025 0.03
Time (ms)
•
*
•
Norm
alized F
orce
(unitless)
Sarcomere Length
(µm)
[Ca2+] myo
•
*
0 500 1000
0 0.2 0.4 0.6 0.8 1
SL
(self normalized)
*
•
Time (ms)
*
(A)
(B)
Figure 4 Unloaded contraction.Twitch response - Unloaded contraction. (A) The total muscle force is plotted corresponding toCa2+transients with peak values 1.1 (∗), 0.9, 0.8, 0.7, 0.6, 0.5 (•)μM as in Figure 3B. (B) Cell shortening twitches as a function ofCa2+activation. The cell is allowed to contract from its equilibrium length of 1.9μm against the passive elastic and viscous restoring forces in the model of Rice et al. ([13]; Figure 1). Increasing peak translating into increased amount of activatorCa2+causes a decrease in time to peak shortening. The inset shows self-normalized sarcomere length for peak values of 1.1 (∗) and 0.5 (•)μM. Model generated data corresponds to an idealized rat ventricular myocyte at 22.5°C.
(B) (A)
(D) (C)
Figure 5 Isometric contraction.Twitch response - Isometric contraction. The cell is held at a constant total length but the sarcomere is allowed to contract via a series elastic element. (A) Steady state F-Ca
relationships for increasing KSE values. (B) Traces for total muscle force during an isometric twitch with KSE values of 1(•), 1.4, 2, 3, 4, 5, 7, 10 and 50 (∗) where units of KSE are normalized force-per-micrometer extension. (C) phase plots of self normalized force versus [Ca2+]myofor increasing KSE values (corresponding
to panel B) overlayed with two steady state F-Ca relationships corresponding to KSE = 1.0 (•) and 50.0 (∗). (D) Sarcomere length traces showing internal shortening. Model generated data corresponds to an idealized rat ventricular myocyte at 22.5°C.
distortion of the strongly bound crossbridge states (xXB_PreR, xXB_PostR in Figure 2) which causes a decrease in the forward rotation rate of the crossbridges (Eqn. 22, Rice et al. [13]) and hence a faster force decline. Figure 6C shows the phase plots of self normal-ized force versus the instantaneousCa2+concentration in the myoplasm for increasing KSE values (traces marked•to∗) overlayed with two steady state F-Ca relationships cor-responding to KSE = 1.0 (•) and KSE = 50.0 (∗). The contraction-relaxation coupling point (◦) moves to increasing values of [Ca2+] and force with increasing KSE values with the relative change in [Ca2+] being smaller than force. Figure 6D shows the cor-responding traces for sarcomere length during the isometric twitch. As the KSE value is increased from 1 to 50 the decreasing compliance results in a decline in cell short-ening accompanied by a decrease in time to peak shortshort-ening from 122 ms to 92 ms (Figure 6D).
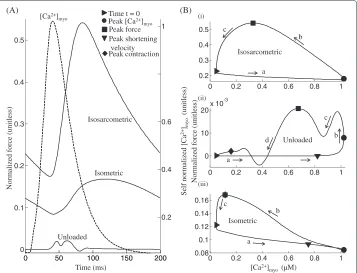
Figure 7 shows the three types of simulated twitch responses studied, compared in their force vs. time plots, as well as in their normalized force vs. [Ca2+]
Figure 6 Comparison of twitch responses.Twitch responses - A comparison between three types of steady state twitch responses from an isolated rat ventricular myocyte viz. isosarcometric, unloaded and isometric (KSE = 2). Fixed SL in the isosarcometric case and the initial pre-contraction SL in the isometric case are chosen as 2.2μm. Equilibrium SL in the unloaded case is 1.9μm. (A) Traces for normalized force in each of the three cases with an overlay of normalized [Ca2+]myotransient responsible for the twitch and (B) Phase plots of normalized force versus the instantaneousCa2+concentration in the cytosol in each of the three cases. Note the overlap ofandin panel iii. Model generated data corresponds to an idealized rat ventricular myocyte at 22.5°C.
case records the minimum force for identical sarcomere length and initial conditions. Figure 7B shows the phase plots of normalized force versus the instantaneous Ca2+
concentration in the cytosol constructed from model-generated data captured at steady state (the last in a train of stimuli comprising 100 cycles at 5 Hz stimulation) from a twitch caused by a [Ca2+]myotransient resulting from a voltage clamp pulse (amplitude -40 mv to 10 mv and a duration of 50 ms). The initial pre-contraction sarcomere length in the isometric case and the sarcomere length clamp in the isosarcometric case are both set to 2.2μm whereas the equilibrium length in the unloaded case is chosen as 1.9μm [13].
In the case of an isosarcometric contraction the net force comprises only the active component due to the tension generated by the sarcomere trying to contract. Phase ‘a’ in Figure 7B-i is indicative of the delay in the contractile response when compared to the [Ca2+]myotransient. However, soon after the [Ca2+]myoreaches its peak (•), the sarcom-ere begins to contract, resulting in a gradual increase in force, achieving a maximum () as seen in phase ‘b’ of Figure 7B-i. As active force increases, a decline in level of activator
Ca2+in the cytosol ultimately causes a recovery to the minimum contractile state (), as shown in phase ‘c’ of Figure 7B-i.
Figure 7 Feedback length effects.Feedback of internal shortening on myoplasmic [Ca2+]myotransient. The
protocol used comprises of 9 beats of isometric contraction followed by a 0.8 s rest interval and beat 10 (shown above) when the cell is allowed to internally shorten (•) or held at a fixed sarcomere length of 2.2μm (∗). (A) The sarcomere length in both the cases shows the degree of contraction when the cell is allowed to internally shorten via a series elastic element (KSE = 2). (B) Isosarcometric case shows enhanced force when compared to the isometric case. The inset shows corresponding steady state F-Ca relationships (C) As seen in experimental studies, the isosarcometric case shows a modest decrease in [Ca2+]myotransient. Model
generated data corresponds to an idealized rat ventricular myocyte at 22.5°C.
action of cycling crossbridges and the passive component attributed to titin and other cytoskeletal elements. Passive force generated has a negative contribution to the net force for SL values lower than the equilibrium length. Hence, the competition between the active and passive components of force gives the trace in Figure 7B-ii its characteristics. During phase ‘a’ in Figure 7B-ii, as theCa2+level in the cytosol increases towards its peak value (•), the sarcomere attains maximum contraction velocity (), which is followed by a steep increase in net force as shown in phase ‘b’ of Figure 7B-ii. However, decreasing sar-comere length increases the negative contribution from the passive component of force resulting in the first transient decline shown in phase ‘c’ of Figure 7B-ii. The increased
However, a subsequent decrease in cell shortening soon allows an increase in net force lasting for a short duration (while the SL reaches its minimum ()). The decliningCa2+
level in the cytosol, an outcome of SR uptake, then causes a gradual recovery to the resting state ().
As shown in Figure 7A, for the same activatorCa2+, although the total muscle force generated during isometric contraction exhibits a triphasic response similar to an isosar-cometric contraction, its own unique characteristics are a delayed time to peak (an increase from 84.5 ms to 119 ms) and relatively smaller magnitude. As shown in phase ‘a’ of Figure 7B-iii, the increase inCa2+concentration is not reflected in a fast mechan-ical response. After [Ca2+]myoreaches its peak (•), the tension in the sarcomere begins to build up (phase ‘b’ of Figure 7B-iii) although at a slower rate (compare isometric and isosarcometric traces in Figure 7A), causing a delayed time to peak (84 ms and 120 ms in isosarcometric and isometric cases, respectively) due to the presence of the series elastic element which facilitates slow internal shortening. The sarcomere achieves peak contrac-tion () when the total muscle force reaches its maximum (), following which the cell recovers back to the minimum contractile state () as shown in phase ‘c’, Figure 7B-iii. During isometric contraction (KSE = 2) the afterload (due to the series elastic element) tracks the active component of force generated due to the tension developed in the sar-comere while the passive component of force (attributed to titin and other cytoskeletal elements) is small in magnitude owing to a much smaller degree of sarcomere contraction achieved when compared to the unloaded case (compare trace marked∗in Figure 5B and the trace for KSE=2 in Figure 5D).
Effect of contraction on the [Ca2+]
myotransient
The myoplasmic [Ca2+]myo transient which follows SR release acts as the trigger for myofilament contraction. However, the contracting myofilament also has a feedback effect on the shape of the [Ca2+]myotransient as a result ofCa2+binding to the low affin-ity regulatory sites on troponin in the myofilament. TheCa2+affinity of this site depends on both the sarcomere length as well as the fraction of strongly-bound crossbridges (Eq. 37, Rice et al. [13]). The protocol used to test these effects is similar to that employed by Janssen and de Tombe [29], wherein the cell is stimulated at 5 Hz for 9 beats under con-ditions of isometric contraction (KSE=2) followed by a 0.8 s rest interval allowing decay to a zero force resting state. This is followed by the 10th beat for which a transient lasting 1 s is obtained. On the 10th beat, the cell is allowed to sarcometrically shorten as usual (•) or a sarcometric length clamp is imposed at a fixed sarcomere length of 2.2μm (∗). At the onset ofCa2+-activation of troponin on the 10th beat, initial conditions for the two differ-ent loading tests (isometric and isosarcometric) are iddiffer-entical. Sarcomere length changes under both loading conditions are shown in Figure 8A. As observed earlier in Figures 7B (i) and (iii) as well as in Figure 8B, isosarcometric conditions generate a larger force than isometric, due to enhanced myofilamentCa2+sensitivity reflected by a decrease in EC50 from 0.59μM (•) to 0.5μM (∗) (steady state F-Ca relationships shown in the inset in Figure 8B) and increasedCa2+-binding to troponin. This binding causes a small (<1%) decline in the magnitude of the [Ca2+]
myo transient (Figure 8C). Subsequently, as the
0 2 4 6 8 10 12 14 16 18 -1.2-1 -0.8 -0.6 -0.4 -0.2
0 2 4 6 8 10 12 14 16 18
5 8
0 2 4 6 8 10 12 14 16 18
91 94 97
0 2 4 6 8 10 12 14 16 18
0.5 1 1.5
0 2 4 6 8 10 12 14 16 18
2 2.05 2.1 S arcom ere Lengt h (µm) Relative role of Na +/Ca 2+ exchanger (%) Relative role of SERCA pump (%) INaCa (pA/pF) Time (s)
Δ= 0.0848 µm
Δ= 0.0977 µm
(A)
(B)
(D)
Δ= 0.0848 µm
Phase A Phase B Phase C
(C)
Partial Inhibition of
Na+/Ca2+Exchanger
[Ca 2+] my o (µM) SERCA pump NCX
Δm=0.0217
µm
Figure 8 Regulation of contraction via NCX.Regulation of isometric cell contraction byNa+/Ca2+ exchange. The protocol used for the isometric contraction is stimulation at 5 Hz comprising of 30 beats when the cell undergoes unperturbed contraction (phase A) followed by 30 beats (phase B) when theNa+/Ca2+ exchanger function is partially inhibited after which the inhibition is relieved allowing the cell to recover to a steady state control during the following 30 beats (phase C). (A) TheNa+/Ca2+exchanger current (INaCa) showed a rapid transition between the control and inhibited phase and vice versa. (B) Relative role of the Na+/Ca2+exchanger and the SERCA pump. (C) MyoplasmicCa2+concentration. (D) Sarcomere length in response toINaCainhibition. Model generated data corresponds to an idealized rat ventricular myocyte at
22.5°C.
slowly and its curve crosses over the isometricCa2+-transient. Although Janssen et al. [29] reported an increase inCa2+transient due to uncontrolled shortening, the crossover was not observed as the noise level was too large. However, the crossover effect has been reported in other studies on rat ventricular trabeculae [19,20] using long and short sar-comere length twitches producing larger changes in developed force and hence the shape of the [Ca2+]myotransient (>5% change in peak value).
Regulation of isometric cell shortening byNa+/Ca2+exchange
superfusion with normal bathing solution completely removes the inhibitor, thus restor-ing exchanger activity to initial levels. It is well known that a decrease in NCX activity (Phase B, Figure 9A) results in an increase in SRCa2+content as a result of the excess
Ca2+in the cytosol being resequestered into the SR via the SERCA pump. Figure 9B elu-cidates the relative contribution of theNa+/Ca2+exchanger and the SERCA pump in
Ca2+extrusion from the cytosol, showing an increase in the relative role of SERCA pump as a result of inhibition in NCX activity. As observed experimentally [21] this enhance-ment in SRCa2+content results in an increased availability of activatorCa2+following release (Figure 9C) which in turn enables improved cell shortening as seen by an enhance-ment in peak to peak amplitude of contraction in Figure 9D (increases from 0.0848μm to 0.0977μm) and is accompanied by a decrease in mean sarcomere length (m= 0.0217 μm). A similar study (not shown here) involving a sudden increase in NCX activity instead
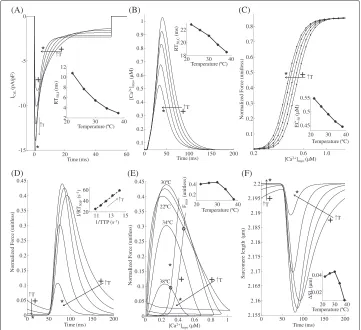
Figure 9 Temperature dependence of twitch response.Isometric twitch response (KSE = 10.0) for temperatures ranging from 22°C to 38°C at 5 Hz stimulation. (A) Traces for L-typeCa2+current (ICa,L) showing increasing peak and rate of decline with increase in temperature. The inset shows the temperature dependence of RT50,I, time required for 50%ICa,Linactivation. (B) Traces for [Ca2+]myotransient for increasing
temperatures show a decline in peak. The inset shows the temperature dependence of RT50,C, time required
for 50% decline in [Ca2+]myofrom its peak value. (C) Steady state F-Ca relationships for increasing temperature. The inset shows the temperature dependence of half maximal effective concentration (EC50).
of a decrease resulted in an opposite (a decrease in SRCa2+content causing diminished release and hence a decrease in degree of contraction) symmetric response of similar mag-nitude indicating strong homeostatic control. MyoplasmicNa+concentration (17 mM) remains relatively constant throughout and hence is not involved in this indirect control of myofilament contractility. Our virtual experiment only approximates the actual exper-iment in that we assume the ability to make very rapid changes in the composition of the bathing medium relative to the time constants involved in the response. However, the model generated responses in steady state can be compared with measured steady state response in the presence/absence of NCX inhibition using selective blocking agents that allow complete post-washout recovery [30].
Effect of temperature on contractile performance
Temperature is known to have a strong effect on the L-typeCa2+current (ICa,L), the
Ca2+-transient and the contractile mechanics. One very significant effect of temperature on whole-cellICa,Lis the pronounced increase in its rate of decline with an increase in temperature [31,32]. Thus, with an increase from room to body temperature, peak inward trigger current increases but the waveform becomes much narrower. Figure 10A shows model-generatedICa,Lwaveforms at temperatures between 22°C (+) and 38°C (∗) in steps of 4°C, where one can observe the increase in peak current but also the increased rate of decline in the trigger current waveform with an increase in temperature. Specifically, peak
ICa,Lat 22°C was 8.31 pA/pF compared with 15.05 pA/pF at 38°C, whereas time taken for 50%ICa,Linactivation (RT50,I) decreased from 10.75 ms at 22°C to 2.95 ms at 38°C (inset in Figure 10A). These indices are in general agreement with measured voltage clamp data [32,33] obtained from rat ventricular trabeculae.
Although skinned rat ventricular preparations have been used extensively in studies of the cardiac contractile process, data from such preparations violates the assumptions of our whole cell electromechanical model. The integrity of the plasma membrane compo-nents and intricateCa2+-regulatory system are compromised to some degree, regardless of the skinning technique used. Therefore, we have chosen to consider only data from rat ventricular myocytes or ultra-thin rat ventricular trabeculae to help validate the model.
The decrease in integrated ICa,L and faster SR uptake with increasing temperature together cause a decline in peak and duration of the Ca2+-transient as shown in Figure 10B. This agrees with the experimental findings by Janssen et al. ([14]; Figure 1) on thin rat ventricular trabeculae. RT50,C corresponding to theCa2+-transient (time taken for 50% decline in [Ca2+]myo) decreased from 22.8 ms at 22°C to 18.5 ms at 38°C (inset in Figure 10B). MyofilamentCa2+sensitivity increases with an increase in temperature as a result of a temperature dependent enhancement in crossbridge cycling rate [34-36]. Traces for the steady state F-Ca relationship in Figure 10C show a temperature dependent increase in myofilamentCa2+sensitivity with no significant change in maximum plateau force. An increase in temperature from 22°C (+) to 38°C (∗) results in a decrease in EC50 from 0.55μM to 0.44μM (inset in Figure 10C).
Figure 10 Role of myofilamentCa2+sensitivity.Dependence of isometric contraction on myofilament
Ca2+sensitivity (MCS). (A) The steady state normalized force versus [Ca2+]myorelationship shows a rightward
shift with decreasing myofilamentCa2+sensitivity. (B) Traces for normalized force recorded at steady state with an overlay of the [Ca2+]myotransient. The inset shows MCS dependent changes in TD50(time taken
from 50% activation to 50% relaxation). (C) Phase plots of normalized force versus the instantaneousCa2+ concentration in the cytosol. (D) Traces for sarcomere length indicating increased shortening with temperature. (E) Degree of sarcomere shortening and peak shortening velocity as a function of MCS. Model generated data corresponds to an idealized rat ventricular myocyte at 22.5°C driven by standard 50 ms voltage pulses at a repetition frequency of 5 Hz.
to 38°C, further decreases in peak [Ca2+]myocause strong decreases in peak developed force. Figure 10D shows that an increase in temperature was accompanied by a decrease in both time to peak (TTP) as well as RT50,F (time taken for 50% decline in force). The inset in Figure 10D shows the linear relationship [27,37] between rate of relaxation ver-sus rate of contraction for increasing temperature (reciprocal of RT50,Fversus reciprocal of TTP).
Figure 10E shows phase plots of normalized force versus instantaneousCa2+ concen-tration in the myoplasm for increasing temperatures (22°C (+) to 38°C (∗) in steps of 4°C) overlayed with two steady state F-Ca relationships corresponding to 22°C (+) and 38°C (∗). The contraction-relaxation coupling point (◦) moves to decreasing values of [Ca2+] and force with increasing temperature. Phase-plane analysis of normalized force versus instantaneousCa2+concentration in the myoplasm reveals that, as the tempera-ture is increased from 22°C to 38°C, the relaxation phase moves to the right towards the corresponding steady-state F-Ca relationship. This suggests that, with increase in tem-perature there is a departure from cross-bridge kinetics being the rate-limiting step in cardiac relaxation to a moreCa2+-driven mechanism. As evident from Figure 10D, the inset in Figure 10E shows the temperature dependence of peak force developed indicating a moderate increase at low (<30°C) temperatures with a strong decline at temperatures above 30°C. Traces for SL shortening in Figure 10F corresponding to [Ca2+]myo tran-sients in panel B, indicate an overall decrease in sarcomere shortening with increasing temperature which agrees with the trend in developed force in panel D. Comparison of insets in Figure 10E and F shows the correlation between peak force developed and the corresponding delta change in SL. The effect of change in temperature on myofilament contractility is a two-stage response with feedback. Firstly, the [Ca2+]myotransient is tem-perature sensitive owing largely to the temtem-perature dependence of the trigger current
ICa,L. Secondly, the cellular contractile machinery is highly temperature sensitive due the strong temperature dependence of rate kinetics involved in the formation of crossbridges. In addition, the process of crossbridge formation is known to have a small feedback effect on the [Ca2+]myotransient as seen in Figure 8. As the temperature is increased from 22°C to 30°C, the temperature sensitivity of crossbridge kinetics predominates the temperature dependence of [Ca2+]myotransient in determining the contractile response. However, for temperatures from 30°C to 38°C the opposite holds true.
Role of myofilamentCa2+sensitivity
Among various factors influencing the degree of cell shortening achieved in response to myoplasmic [Ca2+]myotransient, theCa2+affinity of troponin C regulatory site is known to be particularly important. Here, we studied the dependence of isometric force response on myofilamentCa2+sensitivity (MCS). An increase in Ca2+ affinity is modeled by a 30% increase inkonT (traces markedin Figure 11), the rate constant forCa2+-binding to troponin regulatory site. Similarly, a decrease in MCS is modeled by a correspond-ing decrease inkonT (traces markedin Figure 11). The steady state F-Ca relationships in Figure 11A show the gradual rightward shift in response to decreasing MCS as seen experimentally in right ventricular trabeculae from rat in the presence of bupivacaine [38]. A positive/negative change in MCS results in the average [Ca2+]
0 50 100 150 200 250 300 350 1
2 3
[Ca
2+]
m
yo
(µM)
(A)
3 mM [Ca2+]o 1 µM Iso
0 20 40 60 80 100 120 140 160 180 200 1
2 3
0.01 0.09 0.17
Normaliz
ed For
ce (unitless)
1 µM Iso Control 3 mM [Ca2+]
o
Force [Ca2+]
myo
*
[Ca
2+]
my
o
(µM)
Time (s)
(B)
1 2 3
0.01 0.09 0.17
Normaliz
ed For
ce (unitless)
[Ca2+] myo (µM)
Decrease in MCS (1 µM Iso)
3 mM [Ca2+] o
* control 1 µM Iso
* *
Time (ms)
(C)
* *
* Control
Figure 11 Effect of isoproterenol and increase in [Ca2+]o.Role of isoproterenol and [Ca2+]o. (A) Time record of [Ca2+]myotransient in the control case as well as with 3 mM [Ca2+]oand 1μM ISO. (B) Traces for normalized force recorded at steady state with an overlay of [Ca2+]myotransient. (C) Phase plots of normalized force versus the instantaneousCa2+concentration in the cytosol with an overlay of traces showing normalized steady state force versus [Ca2+]myorelationship. Model generated data corresponds to an idealized rat ventricular myocyte at 22.5°C.
μM and 0.89μM respectively. However, the Hill coefficient was constant (4.0) showing no change in response to modulation in MCS.
binding to troponin. This delay in recovery manifests in an increase in time to peak from 119.5 ms (•) in the control case to 124 ms (). Similarly, a decrease in MCS produces an opposite effect resulting in a decrease in time to peak (112 ms ()). The two distinct slopes during the upstroke in force response in Figure 11B are a result of an initial con-tribution of the strongly bound pre-rotated state (XB_PreR in Figure 2) followed by the effect of increase in strongly bound post-rotated state (XB_PostR in Figure 2). As shown in the inset in Figure 11B, an increase in MCS causes an increase in TD50 (time taken from 50% activation to 50% relaxation).
Phase plots of normalized force versus the instantaneousCa2+ concentration in the cytosol are shown in Figure 11C. As observed experimentally [39], a decrease in myofil-ament Ca2+ sensitivity causes the gradient (units of Normalized force/μM) of the trajectory during the relaxation phase of the twitch contraction (marked by thick arrows in Figure 11C) to decrease from 12.4 in the control case to 7.0. A similar but oppo-site effect was observed in the rate of relaxation with a corresponding increase in MCS. A delayed onset of the upstroke in force response as a result of a decrease in MCS (Figure 11B) causes a distinct loop at high Ca2+ concentrations (trace marked in Figure 11C). The traces for sarcomere length in Figure 11D reflect the changes in force developed, showing an increased degree of shortening with an enhancement in MCS. Peak shortening velocity also increases with an increase in myofilamentCa2+sensitivity as shown in Figure 11E.
Effect of Isoproterenol:Theβ-adrenergic agonist isoproterenol (ISO) is known to cause a decrease in myofilamentCa2+sensitivity as a result of PKA-mediated phosphorylation of troponin I at Ser23/Ser24 [15,17]. However, the increase in amplitude of myoplas-micCa2+transient more than compensates for the decrease inCa2+sensitivity in order to facilitate the inotropic effect of β-adrenergic stimulation. Here, we adopt a 1 Hz stimulation protocol used by Roof et al. ([40]; Figure 1) to study the effect of 1μM isopro-terenol on isometric contraction and compare it with the effect of increasing extracellular
Ca2+ concentration ([Ca2+]o) from 1 mM (control) to 3 mM. As shown in Figure 4A, administration of 1μM isoproterenol or an increase in [Ca2+]o to 3 mM causes a sub-stantial (3-fold) enhancement in peak myoplasmic [Ca2+]myoas observed experimentally ([40]; Figure 1). The isoproterenol-dependent effect is a result of PKA mediated dose-dependent increase (23%) in peak ICa,L current together with an increase (17%) in the maximal uptake rate of the SERCA pump when compared to the control case (Appendix, Eqns. 5-7). In the presence of isoproterenol, the significant increase in peak [Ca2+]
developed occurs despite a decrease in myofilamentCa2+sensitivity (Figure 4C) which manifests as an increase (0.65μM to 0.85μM) in EC50, the average [Ca2+]myoat 50% of maximal developed force.
Discussion
Myofilament dynamics have been captured by various representations ranging from the highly simplified models to complex empirical [41,42] and biophysical models [13]. While simplified models tend to use an explicit parabolic tension profile [43], the empirical mod-els use predefined expressions to specify the average force developed by the cross bridges, based on experimental observations of isolated muscle contraction under different load-ing conditions. On the contrary, biophysical models of cardiac myofilament dynamics include descriptions of cross-bridge cycling and their elastic properties. An extensive review of various myofilament models in the literature is given by Trayanova and Rice [44]. We have developed a composite multiphysics model of excitation-contraction cou-pling in the rat ventricular myocyte based on a mechanistic electrochemical model of calcium-induced calcium-release (CICR) [4] and a detailed mechanochemical model of cooperative activation and crossbridge cycling [13]. After integrating these component models, the resultant multiphysics model of cardiac electromechanics is used to exam-ine the mechanisms regulating myofilament contractility in an isolated rat ventricular myocyte under a voltage clamp protocol.
In particular, we have studied the role of different modulatory factors in influencing the various types of twitch response (isosarcometric, unloaded and isometric) elicited by an isolated rat ventricular myocyte. The dependence of isosarcometric contraction on the amount of activatorCa2+available in the myoplasm to trigger contraction and the sar-comere length which modulates myofilamentCa2+sensitivity is demonstrated (Figure 3). Unloaded cell contraction is investigated to understand the influence of [Ca2+]myo tran-sient on the degree of sarcomere contraction achieved by an unrestrained cell highlighting the enhanced shortening velocity and rate of recovery with increasing peak [Ca2+]myo (shorter time to peak and faster rate of relaxation in the inset in Figure 11B). In agree-ment with Rice et al. [13] we demonstrate that in isometric contraction (Figure 6), there can be significant internal shortening of the sarcomere as the result of compliant end connections (low KSE values).
Ca2+released as a result of CICR is known to act as an actuator, triggering myofilament contraction by binding to the low affinity regulatory sites on troponin C which act as the sensor, theCa2+affinity of which is a function of dynamically changing sarcomere length as well as the fraction of strongly bound crossbridges. This hence facilitates not only a feedforward but also a moderate feedback interaction between the [Ca2+]
myo transient and the myofilament contractile mechanism. This feedback effect is seen in Figure 8C where the presence of isometric contraction results in a small decrease in peakCa2+
transient, a result of theCa2+buffering action of troponin.
post-release activatorCa2+in the cytosol, thus translating into greater degree of contrac-tion (Figure 9). This completes a control loop that allows modulacontrac-tion of NCX activity to force a readjustment in myofilament contractility.
Experimental conditions such as temperature strongly influence cardiac myofilament contractility. An increase in temperature results in an increase in sensitivity of the myofil-aments to myoplasmicCa2+ [22]. As the temperature is increased from 22°C to 30°C, increasing myofilamentCa2+sensitivity (Figure 10C) causes a moderate increase in peak force despite a decline in peak [Ca2+]myo. However, a further increase to body temper-ature results in a steep decline in force developed (Figure 10D). Hence, an increase in temperature from 22°C to 38°C which results in a decline in peak [Ca2+]myo[14], causes an overall decrease in force developed. This translates into an overall decrease in the degree of cell shortening with increasing temperature (Figure 10F). This temperature dependent behavior is not captured by the model proposed by Rice et al. [13] where an increase in temperature causes an increase in peak force developed as a result of the large Q10 values used (Qfapp, Qhf, Qhband Qgxb, Table 1, [13]).
Modulation of myofilamentCa2+sensitivity (MCS) as a result of a change in Troponin I (TnI) phosphorylation by PKA has been implicated in heart failure [45]. Here we study the role of MCS in modulating myofilament contractile response (Figure 11) an aspect overlooked in recent modeling studies including Rice et al. [13]. In particular, we model the effect of isoproterenol, aβ-adrenergic agonist, which is known to cause a decline in myofilamentCa2+sensitivity as a result of protein kinase A (PKA) mediated phos-phorylation of troponin I at Ser23/Ser24 [15,16]. Such a decline inCa2+sensitivity aids myofilament relaxation in the presence of increased levels of activatorCa2+. Figure 4 shows that an increase in amplitude of the myoplasmic Ca2+ transient (a cumulative effect of enhancement in trigger current and increase in uptake rate of the SERCA pump) is more than adequate to compensate for the decrease inCa2+sensitivity, thus facilitat-ing the desired effect ofβ-adrenergic stimulation, namely an increase in contractile force generated.
Model limitations
more clearly the important role ofCa2+signalling pathways and feedback control systems in maintaining whole cell homeostasis over a prolonged period of time. 2. The cooperative activation of the thin filament and the strain-dependent
transitions of the crossbridge cycle have been approximately modeled as
non-spatial, state-variables. However, this simplification is valid as these transitions are inherently local phenomena and the model reproduces a wide range of steady state and dynamic responses in cardiac muscle [13]. Although a CaM-dependent pathway is reported [18] to be responsible in modulation of myofibrillar
contractility implying a possible CaM mediated role for Ca-dependent kinases or phosphatases in regulating myofilament contractility (particularly in frequency dependent acceleration of relaxation), further studies are required to clarify the molecular mechanisms involved.
3. The temperature dependence of passive force attributed to titin and other cytoskeletal elements is not modeled in this study and the assumption of constant stiffness for the series elastic element (KSE) does not account for temperature dependent effects. This is an area where the model can be expanded but additional measured data on the temperature sensitivity of these elements is necessary. Regardless, our model provides reasonable approximations to the temperature dependence of developed force in intact thin rat ventricular trabeculae [14].
Conclusion
We have developed a composite mathematical model for cardiac electromechanics which includes a detailed description ofCa2+dynamics under voltage clamp conditions in the rat ventricular myocyte, based on experimental data [4,13]. We have investigated the role of different factors including the myoplasmic [Ca2+]myo transient and the sarcomeric length in influencing various types of twitch responses obtained under different loading conditions (including isosarcometric, isometric and unloaded conditions). Various con-trol loops influencing cell shortening have been explored. In particular, the bidirectional interaction of theCa2+transient with the myofilament contractile mechanism and the importance of indirect SR mediated interaction of the sarcolemma with the contractile machinery is highlighted by showing the regulation of isometric contraction by the degree of NCX activity. The effect of temperature on cell shortening is investigated identify-ing the differential sensitivity of the [Ca2+]myotransient and the myofilament contractile mechanism. The important role of myofilamentCa2+sensitivity in force generation is studied with particular emphasis on the effect of β-adrenergic stimulation on cardiac contractile response. In agreement with Janssen [37], we also demonstrate a key linear relationship between the rate of contraction and relaxation, which is shown here to be intrinsically coupled over the full range of physiological perturbations (including temper-ature, sarcomeric length, activatorCa2+, and isoproterenol; e.g. see insets in Figures 10D, 3A-ii).
into whole-cell responses to a wide variety of testing approaches used in studies of cardiac myofilament contractility that have appeared in the literature over the past two decades (Figures 3,4,5,6,7,8,9,10 and 11). Thus, the model serves as a platform for the predictive modeling of VC investigations of cardiac electromechanics pertaining to the rat ven-tricular myocyte in a number of areas. These are fundamental issues that would benefit from a better mechanistic understanding of the cardiac contractile mechanism in the rat ventricluar myocyte. This study is aimed at providing an initial step towards this goal.
Appendix
Equations governing electro-mechanics modified (from Rice et al. [13]) in the model Regulatory Ca2+-binding to troponin
dCaTropH
dt =konTTnIu[Ca
2+]
myo(1−CaTropH)
−koffHTCaTropH
(1)
dCaTropL
dt =konTTnIu[Ca
2+]myo(1−CaTrop L)
−koffLTCaTropL
(2)
konT= 22.22μM−1s−1; koffHT= 17.36 s−1; koffLT= 173.61 s−1; (Rice et al. [13]).
dTnIp
dt =konTIPKATnIu−offTITnIp (3)
konTI= 698.69 s−1; koffTI= 80.0 s−1; (estimated from Roof et al. [40]).
TnIu=1−TnIp (4)
PKA=
0.3×[ISO]
[ISO]+12.1 (5)
[ISO] - concentration of isoproterenol inμM.
PKAact =0.1+PKA (6)
PKAact- Relative regulatory activity of PKA (unitless).
PCa=10.0×PKAactPCaold (7)
PCaold= 4.5408μL s−1(Krishna et al. [4]).
Abbreviations
[Ca2+]: calcium ion concentration; [Ca2+]myo: myoplasmicCa2+concentration; [Ca2+]o: extracellularCa2+ concentration; CaM: calmodulin; CICR: calcium-induced calcium-release; CRCP: contraction-relaxation coupling point; DCU: dyadic coupling unit; DHP: dihydropyridine; E-C: excitation contraction; EC50: half maximal effective concentration;
F-Ca: force versusCa2+; FFR: force frequency response; FRCRSFa: Phe-Arg-Cys-Arg-Ser-Phe-CONH2; F-SL: force versus sarcomere length;ICa,L: L-typeCa2+current;INaCa: sodium calcium exchanger current;IPMCA: plasma membraneCa2+ ATPase pump current; ISO: Isoproterenol; jSR: junctional portion of the sarcoplasmic reticulum; KSE: stiffness coefficient of the non-contractile series elastic element; LSR: longitudinal portion of the sarcoplasmic reticulum; L-type: long lasting type; MCS: myofilamentCa2+sensitivity;μm: micro meter;μM: micro molar; mM: milli molar; mV: milli volt; NCX: Na+/Ca2+exchanger; ODE: ordinary differential equation; pA/pF: pico amps per pico farad; PKA: protein kinase A; RT50:
time required for 50% sarcomere relaxation; RT50,C: time required for 50% decline inCa2+-transient; RT50,F: time required for 50% decline in force response; RT50,I: time required for 50%ICa,Linactivation; RyR: ryanodine receptor; SERCA: sarcoplasmic reticulumCa2+ATPase; SL: sarcomere length; SR: sarcoplasmic reticulum; TD
50: time taken from 50%
activation to 50% relaxation; TnC: Troponin C; TnI: Troponin I; TnIu: fraction of unphosphorylated Troponin I; TTP: time required to attain peak value; VC:voltage clamp; XIP: Exchanger inhibitory peptide.
Competing interests


![Figure 7 Feedback length effects. Feedback of internal shortening on myoplasmic [Ca2+]myo transient](https://thumb-us.123doks.com/thumbv2/123dok_us/312938.1523777/13.595.119.477.85.437/figure-feedback-effects-feedback-internal-shortening-myoplasmic-transient.webp)