S H O R T R E P O R T
Open Access
Probabilistic hazard modelling of
rain-triggered lahars
Stuart R. Mead
1,2,3*and Christina R. Magill
1Abstract
Probabilistic quantification of lahar hazard is an important component of lahar risk assessment and mitigation. Here we propose a new approach to probabilistic lahar hazard assessment through coupling a lahar susceptibility model with a shallow-layer lahar flow model. Initial lahar volumes and their probabilities are quantified using the lahar susceptibility model which establishes a relationship between the volume of mobilised sediment and exceedance probabilities from rainfall intensity-frequency-duration curves. Rainfall-triggered lahar hazard zones can then be delineated probabilistically by using the mobilised volumes as an input into lahar flow models. While the applicability of this model is limited to rain-triggered lahars, this approach is able to reduce the reliance on historic and empirical estimates of lahar hazard and creates an opportunity for the generation of purely quantitative probabilistic lahar hazard maps. The new approach is demonstrated through the generation of probabilistic hazard maps for lahars originating from the Mangatoetoenui Glacier, Ruapehu volcano, New Zealand.
Keywords:Probabilistic lahar hazard, Susceptibility, Rain-triggered lahar, Numerical modelling
Lahars are among the most hazardous volcanic processes and are responsible for a large proportion of volcanic fatalities (Auker et al. 2013). Reliable information on the likelihood of lahar occurrence and the resulting inunda-tion area is critical for the mitigainunda-tion of risks posed by lahars (Pierson et al. 2014). Lahar hazard assessments typ-ically provide this information in the form of hazard maps quantifying the probability and extent of potential lahars to varying degrees (Calder et al. 2015). In these assess-ments, models that approximate lahar behaviour and/or run-out are frequently used (e.g. Aguilera et al. 2004; Carranza and Castro 2006; Darnell et al. 2013; Thouret et al. 2013; Pistolesi et al. 2014; Córdoba et al. 2015). Com-monly used models include Laharz (Iverson et al. 1998; Schilling 2014), an empirical model relating lahar volume to cross-sectional and planimetric inundation area; the two-phase shallow layer model of Pitman and Le (2005) implemented in the Titan2D toolkit (Pitman et al. 2003; Patra et al. 2005); and single phase rheology approaches such as Flo-2D and Delft3D, used in Caballero et al.
(2006) and Carrivick et al. (2009, 2010). Regardless of methodology, the accuracy and output of these methods is dependent on the value and accuracy of model inputs. The initial lahar volume or volumetric flux is one such in-put that determines initial lahar size and gravitational po-tential energy. Since lahar size and energy transfer are important factors controlling lahar behaviour and runout (Lube et al. 2012), an accurate estimate of initial volume is therefore crucial for accurate and reliable hazard footprint estimates. Commonly, initial lahar volumes are estimated from volumes of previous lahar events or rely on expert judgement. However, historic data is often incomplete or can be irrelevant under different environmental conditions which limits probabilistic lahar hazard estimates.
Recently, Mead et al. (2016) presented a physically based model for determining initial volumes of rain-triggered lahars. Lahar susceptibility, defined as the probability of an initial lahar volume at a specific location, was deter-mined through assigning annual probabilities to lahar volumes using rainfall intensity-frequency-duration (IFD) curves. The potential of coupling lahar susceptibility model outputs to lahar flow model inputs in order to quantify lahar hazard probabilistically was discussed, but not demonstrated. Here, the work of Mead et al. (2016) is extended by coupling lahar susceptibility outputs to the
* Correspondence:[email protected] 1
Risk Frontiers, Department of Environmental Science, Macquarie University, Sydney, Australia
2
Commonwealth Scientific and Industrial Research Organisation, Melbourne, Australia
Full list of author information is available at the end of the article
two-phase shallow layer model of Pitman and Le (2005). Outputs of the combined model in the form of probabilis-tic hazard maps are demonstrated for lahar scenarios originating from Mangatoetoenui Glacier, Mt. Ruapehu, New Zealand. This work is intended to demonstrate an approach for probabilistic estimates of lahar hazard and highlight areas of research needed to enhance the reliabi-lity of these hazard estimates.
Methods
The probabilistic lahar hazard approach proposed here relies on the combination of two modelling methods. Lahars are simulated as a two-phase flow using Titan2D with initial volumes determined using the lahar suscepti-bility model of Mead et al. (2016). Details of each method are summarised below; for full details readers are referred to Patra et al. (2005) and Pitman and Le (2005) for the Titan2D toolkit and Mead et al. (2016) for the rain-triggered lahar susceptibility model.
Rain-triggered lahar susceptibility
In the rain-triggered lahar susceptibility approach de-scribed in Mead et al. (2016), lahar volumes are estimated from deposit properties, rainfall intensity and rainfall dur-ation using a combined shallow landslide and overland erosion model. The total initial volume of the lahar is cal-culated in the combined model as the sum of the material mobilised through overland erosion and shallow landsli-ding for a given rainfall intensity and duration. In the overland erosion model, the height and motion of infiltra-tion excess rainfall (i.e. net rainfall after infiltrainfiltra-tion into the deposit) is simulated using a depth averaged shallow water (SW) approximation. The entrainment of volcanic sediment is calculated from the height and velocity of the overland flow using the Meyer-Peter and Müller (MPM) bedload transport model (see Castro Díaz et al. (2009)), and the total volume of mobilised volcanic sediment is calculated at the end of the rainfall duration. The volume of volcanic material mobilised through shallow landsliding is calculated using the approach developed by Iverson (2000) where shallow slope failures are assumed to occur when gravitational forces are greater or equal to the ting Coulomb stresses. In the Iverson (2000) model, resis-ting stresses are reduced in proportion to the rainfall infiltration rate (i.e. deposit permeability) and hydraulic diffusivity, which controls the transmission of pore pres-sure through the deposit. The depth, and consequently volume, of the shallow failure is calculated at the end of the rainfall duration. The probability of specific lahar volumes can be estimated using this method through the use of rainfall intensity-frequency-duration (IFD) tables. These tables express the probability of rainfall intensities occurring over a given duration and can be used to esti-mate the occurrence probability of specific lahar volumes
being triggered by rainfall. These lahar volumes, when used as an input in Titan2D, can then be used to express lahar inundation in a probabilistic manner. Here, the mobilised volume estimates and recurrence intervals cal-culated in Mead et al. (2016) are used as the probabilistic input for the lahar flow model.
Lahar flow modelling
The choice of lahar flow model can have a large effect on the quality and reliability of probabilistic hazard estimates and therefore needs to be considered in conjunction with the needs of the hazard assessment. The prediction of lahar flow is difficult due to complex physical processes such as entrainment and deposition of sediment, changing solid concentrations and flow transformations (e.g. Doyle et al. 2009). While empirical models such as Laharz can be used to estimate lahar inundation areas (Schilling 2014), numerical models are able to provide more infor-mation (e.g. velocities and pressures) useful for estimating the intensity of the hazard (McDougall 2016). A range of numerical models have been used or proposed (e.g. Pudasaini 2012) for lahar flow modelling; however, the selection of numerical models and their parameters is complicated by the lack of universal constitutive laws governing lahar flow behaviour (McDougall 2016).
While input parameters for simple models that rely on bulk measures of the lahar (e.g. internal and basal friction, solid concentration) can be calibrated to previous lahar flows, in practice, the complexity of lahar events mean the calibration can only be optimised on one characteristic of the lahar to the detriment of others. For example, a reduc-tion of fricreduc-tion values to match long runout lahars will re-sult in excessively mobile lahars with high momentum in proximal (near source) zones. Recent, more advanced models of two-phase flow (e.g. Pudasaini 2012; Iverson and George 2014; Iverson and George 2016; Mergili et al. 2017) may improve predictions of lahar flow. However, these models rely on a large array of input parameters that are often not known or measurable a priori and, as yet, do not demonstrate the ability to model transformations in flow behaviour.
elevation model (DEM), initial height and area of the mixture (pile height) and basal and internal friction values. The Pitman and Le (2005) model has previously been applied to simulate lahars (e.g. Williams et al. 2008; Procter et al. 2010; Córdoba et al. 2015). Crucially, this model does not consider the effects of erosion, depos-ition or transformation of the lahar and therefore will not reproduce all features of a lahar. Consequently, sim-ulations using this method will not exactly match the outcomes of actual lahars, but will provide a probabilis-tic guide to the lahar hazard. In order to couple the susceptibility model material volumes to the inputs in the Titan2D toolkit, the Titan2D code was modified to add support for user defined pile heights in the form of a geographical information system (GIS) raster file. The modified source code is provided in the Zenodo reposi-tory https://doi.org/10.5281/zenodo.153993.
Study area and simulation inputs
The process outlined in the previous section is demon-strated through the generation of probabilistic hazard maps for lahars originating from the Mangatoetoenui Glacier, Ruapehu volcano, New Zealand. The Mangatoe-toenui Glacier and Stream are located on the north-eastern flank of Ruapehu volcano, draining eastwards into Tongariro River (Fig. 1). A hydro-electric dam, trout fisher-ies and several towns located along Tongariro River are at risk from lahars originating on the north-eastern flanks of the volcano (Cronin et al. 1997). In this study, deposit char-acteristics are chosen to create a scenario with similar con-ditions to those in Mangatoetoenui Stream prior to the October 28, 1995 lahar described in Hodgson and Manville
(1999) and used in lahar susceptibility estimations by Mead et al. (2016). The initial conditions in this study only con-sider a limited range of initial volumes and solid volume fractions, with all other inputs fixed, which means the gen-erated hazard maps only represent a subset of the possible parameter space. A complete hazard assessment would consider the range of other inputs (such as basal and internal friction), their uncertainty and model suitability (Calder et al. 2015).
Lahar simulations for were run for 30 min of simula-tion time using a 25 m resolusimula-tion digital elevasimula-tion model (DEM) sourced from Landcare Research NZ (2010). The DEM spanned the region from Mangatoetoenui Glacier (see Fig. 1) in the west to the confluence of Mangatoe-toenui Stream and Tongariro River in the east, and was chosen because it best represented hydrological features of the terrain, despite the lower resolution compared to the contour-derived Land Information New Zealand DEM (Stevens et al. 2003).
Mobilised material volumes in the source study area were calculated for rainfall durations of 30 min, 2 h, 6 h, 12 h and 24 h at annual exceedance probabilities (AEP) of 0.5 (2 years annual recurrence interval (ARI)), 0.1 (10 years ARI), 0.02 (50 years ARI) and 0.01 (100 years ARI), using the susceptibility simula-tions first presented in Mead et al. (2016). We as-sumed most material is mobilised in a single event to match the observations of Hodgson and Manville (1999). GIS raster files of mobilised material depths from the susceptibility simulations were used as the pile height input in Titan2D. The internal friction angle of the material was given as 32°, which is
between the minimum and maximum material angles of repose (Procter et al. 2010), basal friction was set to 20° to represent a reasonably fluid granular material.
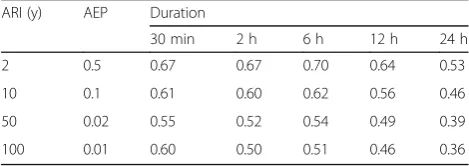
In our simulations, the solids volume fraction of each modelled lahar was computed from the volumes of mobi-lised material and rainfall. The solid volume fraction was estimated as the volume fraction of solids in the total vol-ume of mobilised material and water. Volvol-ume fractions, shown for each scenario in Table 1, decrease as ARI increases since higher rainfall intensities result in propor-tionally greater volumes of rainfall relative to the amount of mobilised material.
Generation of probabilistic lahar hazard maps Lahar hazard maps derived from overall annual exceed-ance probabilities are shown in Fig. 2 for lahar height thresholds of 0.5 and 0.1 m. While lahar properties such as velocity and sediment concentration are also import-ant to consider when evaluating overall lahar hazard, height is used here to express the hazard due to its ease in interpretation and use in delineation of hazard zones. Overall exceedance probabilities were calculated from simulated maximum lahar height at each grid cell using the complementary function
1−pðh≯xÞ ð1Þ
where p(h≯x) is the probability of observing no lahar heights (h) greater than the threshold height x, defined using the formula of Tonini et al. (2016) as
pðh≯xÞ¼
Y
i 1−piðh>xÞ
ð2Þ
where pi (h > x) is the probability of lahar heights exceeding the threshold for each AEP value i (in this instancei =0.5, 0.1, 0.02, 0.01)
piðh>xÞ ¼i⋅p hð >xÞ ð3Þ
andp(h > x)is determined from the cumulative distribu-tion of simulated lahar heights for each AEP.
Discussion and limitations
The deposit characteristics for this demonstration were chosen to create a scenario similar to the tephra deposit in the Mangatoetoenui Catchment prior to the October 28, 1995 lahars. A rainfall event (23 mm total in 24 h, 9 mm in one 6-h interval) triggered lahars in multiple catchments of Ruapehu (Manville et al. 2000), including the Mangatoetoenui catchment. The Mangatoetoenui lahar, described in Hodgson and Manville (1999), trav-elled downstream as a debris flow for the first 5 km (the proximal zone) and then progressively transformed into a hyperconcentrated flow between 5 and 9 km from the source due to the entrainment of streamflow and deposition of sediment. The lahar continued to dilute downstream, eventually reaching the Tongariro River. The lahar was confined to the Mangatoetoenui catch-ment, although a small deposit was observed in a dis-tributary valley of the Whangaehu catchment (Hodgson and Manville 1999).
The similarities in initial conditions between the October 28 lahar and simulations mean that the hazard maps in Fig. 2 should show a reasonable degree of similar-ity between the hazard outlines and observations of the lahar. However; these hazard maps indicate that a large pro-portion of the lahar source material enters the Whangaehu catchment (shown in Fig. 2). Lahar heights also appear to fall below 0.1 m downstream of the walking track encircling Ruapehu (~8 km from source, purple line in Fig. 2). This dif-fers from the extent of lahar deposits identified in Hodgson and Manville (1999), but is close to the distance (9 km) where flow fully transformed from a debris flow to hyper-concentrated flow. Differences in the DEM representation and initial deposit characteristics contribute to these observed errors, but the main source of error is the lack of representation of dilution, entrainment and flow transform-ation processes in current numerical models. The friction parameters used here provide a runout prediction near to the transition to hyperconcentrated flow, but also represent a highly mobile initial mass of material that causes a large proportion of the lahar volume to enter the Whangaehu catchment. This highlights the current state of lahar models as a key limitation of the proposed methodology and shows that operational hazard maps generated using this approach would still require expert guidance.
While differences in AEPs are visible in the vicinity of the walking track, there is little difference in lahar extent be-tween AEPs in upstream portions of the Mangatoetoenui catchment (Fig. 2). This lack of difference can be attributed to the deeply incised channel walls present in upper reaches of Mangatoetoenui stream, but can also be caused by simi-lar initial volumes of material being mobilised for all rainfall ARIs (see Mead et al. (2016) for explanation). However, the level of detail is limited in this demonstration as only 5 Table 1Solid volume fractions of mobilised material for each
scenario at Mangatoetoenui Stream
ARI (y) AEP Duration
30 min 2 h 6 h 12 h 24 h
2 0.5 0.67 0.67 0.70 0.64 0.53
10 0.1 0.61 0.60 0.62 0.56 0.46
50 0.02 0.55 0.52 0.54 0.49 0.39
rainfall duration scenarios are simulated for each rainfall ARI, affecting the validity and resolution of the cumulative distribution used to determine event AEP. A complete hazard mapping exercise would need to sample the entire spectrum of rainfall durations in order to increase the resolution of the cumulative distribution.
Conclusion
The probabilistic lahar hazard maps generated here by combining numerical modelling with initial vol-umes determined through the susceptibility approach of Mead et al. (2016) have demonstrated a potential methodology for probabilistic hazard mapping of lahars. However, through this demonstration, some
range and uncertainty of all inputs into the model (e.g. basal and internal frictions) in addition to simu-lating a larger number of rainfall durations. However, simulations spanning the entire range of input param-eters increases the computational requirements of this approach, which could impact on the feasibility of the method for lahar hazard assessment.
Acknowledgements
Stuart Mead is supported by an Australian Postgraduate Award (APA). Computational resources for this study were provided by the Commonwealth Scientific and Industrial Research Organisation (CSIRO). Digital elevation data is reproduced with the permission of Landcare Research New Zealand Limited.
Availability of data and materials
The modified Titan2D source code used in this article is available in the Zenodo repository https://doi.org/10.5281/zenodo.153993. Any future versions and updates will be released at https://github.com/stuartmead/ titan2d.
Authors’contribution
SM modified Titan2D code, analysed simulation results and wrote the manuscript. CM assisted in development of probabilistic hazard maps, reviewed and edited the manuscript. All authors read and approved the final manuscript.
Competing interests
The authors declare that they have no competing interests.
Author details 1
Risk Frontiers, Department of Environmental Science, Macquarie University, Sydney, Australia.2Commonwealth Scientific and Industrial Research Organisation, Melbourne, Australia.3Volcanic Risk Solutions, Institute of Agriculture and Environment, Massey University, Palmerston North, New Zealand.
Received: 13 September 2016 Accepted: 18 May 2017
References
Aguilera E, Pareschi MT, Rosi M, Zanchetta G. Risk from Lahars in the Northern Valleys of Cotopaxi Volcano (Ecuador). Nat Hazards. 2004;33(2):161–89. doi:10. 1023/B:NHAZ.0000037037.03155.23.
Auker M, Sparks R, Siebert L, Crosweller H, Ewert J. A statistical analysis of the global historical volcanic fatalities record. J Appl Volcanol. 2013;2(1):1–24. doi: 10.1186/2191-5040-2-2.
Caballero L, Macías JL, García-Palomo A, Saucedo GR, Borselli L, Sarocchi D, et al. The September 8–9, 1998 Rain-Triggered Flood Events at Motozintla, Chiapas, Mexico. Nat Hazards. 2006;39(1):103–26. doi:10.1007/s11069-005-4987-7.
Calder E, Wagner K, Ogburn SE. Volcanic hazard maps. In: Loughlin SC, Sparks RSJ, Brown SK, Jenkins SF, Vye-Brown C, editors. Global Volcanic Hazards and Risk: Cambridge University Press; 2015. doi:10.1017/CBO9781316276273.022. Carranza E, Castro O. Predicting Lahar-Inundation Zones: Case Study in West
Mount Pinatubo, Philippines. Nat Hazards. 2006;37(3):331–72. doi:10.1007/ s11069-005-6141-y.
Carrivick JL, Manville V, Cronin SJ. A fluid dynamics approach to modelling the 18th March 2007 lahar at Mt. Ruapehu, New Zealand. Bull Volcanol. 2009; 71(2):153–69. doi:10.1007/s00445-008-0213-2.
Carrivick JL, Manville V, Graettinger A, Cronin SJ. Coupled fluid dynamics-sediment transport modelling of a Crater Lake break-out lahar: Mt. Ruapehu, New Zealand. J Hydrol. 2010;388(3–4):399–413. doi:10.1016/j.jhydrol.2010.05.023. Castro Díaz MJ, Fernández-Nieto ED, Ferreiro AM, Parés C. Two-dimensional
sediment transport models in shallow water equations. A second order finite volume approach on unstructured meshes. Comput Methods Appl Mech Eng. 2009;198(33–36):2520–38. doi:10.1016/j.cma.2009.03.001.
Córdoba G, Villarosa G, Sheridan MF, Viramonte JG, Beigt D, Salmuni G. Secondary lahar hazard assessment for Villa la Angostura, Argentina, using
Two-Phase-Titan modelling code during 2011 Cordón Caulle eruption. Nat Hazards Earth Syst Sci. 2015;15(4):757–66. doi:10.5194/nhess-15-757-2015. Cronin SJ, Neall VE, Palmer AS. Lahar history and hazard of the Tongariro River,
northeastern Tongariro Volcanic Centre, New Zealand. N Z J Geol Geophys. 1997;40(3):383–93. doi:10.1080/00288306.1997.9514769.
Darnell AR, Phillips JC, Barclay J, Herd RA, Lovett AA, Cole PD. Developing a simplified geographical information system approach to dilute lahar modelling for rapid hazard assessment. Bull Volcanol. 2013;75(4):1–16. doi:10.1007/s00445-013-0713-6.
Doyle E, Cronin S, Cole S, Thouret J The challenges of incorporating temporal and spatial changes into numerical models of lahars. In: Proceedings of the 18th world international congress on modelling and simulation, modelling and simulation society of Australia and New Zealand, Cairns, 2009. pp 13–17. Hodgson KA, Manville VR. Sedimentology and flow behavior of a rain-triggered
lahar, Mangatoetoenui Stream, Ruapehu volcano, New Zealand. Geol Soc Am Bull. 1999;111(5):743–54. doi:10.1130/0016-7606(1999)111.
Iverson RM. Landslide triggering by rain infiltration. Water Resour Res. 2000;36(7): 1897–910. doi:10.1029/2000WR900090.
Iverson RM, George DL (2014) A depth-averaged debris-flow model that includes the effects of evolving dilatancy. I. Physical basis, vol 470. vol 2170. doi:10.1098/rspa.2013.0819.
Iverson RM, George DL. Modelling landslide liquefaction, mobility bifurcation and the dynamics of the 2014 Oso disaster. Géotechnique. 2016;66(3):175–87. doi: 10.1680/jgeot.15.LM.004.
Iverson RM, Schilling SP, Vallance JW. Objective delineation of lahar-inundation hazard zones. Geol Soc Am Bull. 1998;110(8):972–84.
doi:10.1130/0016-7606(1998)110<0972:odolih>2.3.co;2.
Landcare Research NZL. NZDEM North Island 25 metre: Landcare Research NZ Ltd.; 2010.
Lube G, Cronin SJ, Manville V, Procter JN, Cole SE, Freundt A. Energy growth in laharic mass flows. Geology. 2012;40(5):475–8. doi:10.1130/g32818.1. Manville V, Hodgson KA, Houghton BF, Keys JR, White JDL. Tephra, snow and
water: complex sedimentary responses at an active snow-capped stratovolcano, Ruapehu, New Zealand. Bull Volcanol. 2000;62(4–5):278–93. doi:10.1007/s004450000096.
McDougall S. Landslide Runout Analysis - Current Practice and Challenges. Can Geotech J. 2016; doi:10.1139/cgj-2016-0104.
Mead S, Magill C, Hilton J. Rain-triggered lahar susceptibility using a shallow landslide and surface erosion model. Geomorphology. 2016;273:168–77. doi:10.1016/j.geomorph.2016.08.022.
Mergili M, Fischer JT, Krenn J, Pudasaini SP. r.avaflow v1, an advanced open-source computational framework for the propagation and interaction of two-phase mass flows. Geosci Model Dev. 2017;10(2):553–69. doi:10.5194/gmd-10-553-2017.
Patra AK, Bauer AC, Nichita CC, Pitman EB, Sheridan MF, Bursik M, et al. Parallel adaptive numerical simulation of dry avalanches over natural terrain. Journal of Volcanology and Geothermal Research. 2005;139(1–2):1–21. doi:10.1016/j. jvolgeores.2004.06.014.
Pierson TC, Wood N, Driedger C. Reducing risk from lahar hazards: concepts, case studies, and roles for scientists. J Appl Volcanol. 2014;3(1):16.
Pistolesi M, Cioni R, Rosi M, Aguilera E (2014) Lahar hazard assessment in the southern drainage system of Cotopaxi volcano, Ecuador: Results from multiscale lahar simulations. Geomorphology 207 (0):51-63. doi:10.1016/j. geomorph.2013.10.026.
Pitman EB, Le L (2005) A two-fluid model for avalanche and debris flows, vol 363. vol 1832. doi:10.1098/rsta.2005.1596.
Pitman EB, Nichita CC, Patra A, Bauer A, Sheridan M, Bursik M. Computing granular avalanches and landslides. Phys Fluids. 2003;15(12):3638–46. doi:10.1063/1.1614253.
Procter JN, Cronin SJ, Fuller IC, Sheridan M, Neall VE, Keys H (2010) Lahar hazard assessment using Titan2D for an alluvial fan with rapidly changing geomorphology: Whangaehu River, Mt Ruapehu Geomorphology 116 (1–2): 162-174. doi:10.1016/j.geomorph.2009.10.016.
Pudasaini SP (2012) A general two-phase debris flow model. Journal of Geophysical Research: Earth Surface 117 (F3):n/a-n/a. doi:10.1029/ 2011JF002186
Pudasaini SP, Krautblatter M. A two-phase mechanical model for rock-ice avalanches. Journal of Geophysical Research: Earth Surface. 2014;119(10): 2272–90. doi:10.1002/2014JF003183.
Stevens NF, Manville V, Heron DW. The sensitivity of a volcanic flow model to digital elevation model accuracy: experiments with digitised map contours and interferometric SAR at Ruapehu and Taranaki volcanoes, New Zealand. J Volcanol Geotherm Res. 2003;119(1–4):89–105. doi:10.1016/S0377-0273(02)00307-4.
Thouret J-C, Enjolras G, Martelli K, Santoni O, Luque J, Nagata M, et al. Combining criteria for delineating lahar-and flash-flood-prone hazard and risk zones for the city of Arequipa, Peru. Nat Hazards Earth Syst Sci. 2013;13:339–60. doi:10.5194/nhess-13-339-2013.
Tonini R, Sandri L, Rouwet D, Caudron C, Marzocchi W, Suparjan (2016) A new Bayesian Event Tree tool to track and quantify volcanic unrest and its application to Kawah Ijen volcano. Geochem Geophys Geosyst 17 (7):2539-2555. doi:10.1002/2016GC006327.