RESEARCH ARTICLE
Protein expression profiles
and clinicopathologic characteristics associate
with gastric cancer survival
Wei Li
1,2, Yan Chen
1, Xuan Sun
1, Jupeng Yang
1, David Y. Zhang
3, Daguang Wang
1*and Jian Suo
1,2*Abstract
Background: Prognosis remains one of most crucial determinants of gastric cancer (GC) treatment, but current methods do not predict prognosis accurately. Identification of additional biomarkers is urgently required to identify patients at risk of poor prognoses.
Methods: Tissue microarrays were used to measure expression of nine GC-associated proteins in GC tissue and nor-mal gastric tissue samples. Hierarchical cluster analysis of microarray data and feature selection for factors associated with survival were performed. Based on these data, prognostic scoring models were established to predict clinical outcomes. Finally, ingenuity pathway analysis (IPA) was used to identify a biological GC network.
Results: Eight proteins were upregulated in GC tissues versus normal gastric tissues. Hierarchical cluster analysis and feature selection showed that overall survival was worse in cyclin dependent kinase (CDK)2, Akt1, X-linked inhibitor of apoptosis protein (XIAP), Notch4, and phosphorylated (p)-protein kinase C (PKC) α/β2 immunopositive patients than in patients that were immunonegative for these proteins. Risk score models based on these five proteins and clinico-pathological characteristics were established to determine prognoses of GC patients. These proteins were found to be involved in cancer related-signaling pathways and upstream regulators were identified.
Conclusion: This study identified proteins that can be used as clinical biomarkers and established a risk score model based on these proteins and clinicopathological characteristics to assess GC prognosis.
Keywords: Gastric cancer, Protein expression profiling, Tissue microarray, Immunohistochemistry, Pathway
© The Author(s) 2019. This article is distributed under the terms of the Creative Commons Attribution 4.0 International License (http://creat iveco mmons .org/licen ses/by/4.0/), which permits unrestricted use, distribution, and reproduction in any medium, provided you give appropriate credit to the original author(s) and the source, provide a link to the Creative Commons license, and indicate if changes were made. The Creative Commons Public Domain Dedication waiver (http://creativecommons.org/ publicdomain/zero/1.0/) applies to the data made available in this article, unless otherwise stated.
Background
Gastric cancer (GC), an epithelial malignancy, is the third leading cause of cancer deaths globally, accounting for 7% of cancer cases and 9% of cancer deaths globally [1]. According to China’s Cancer Statistics, GC is the sec-ond most common malignancy in China [2]. It is difficult to cure unless it is detected at an early stage. However, because early GC patients present with few symptoms, the cancer is usually at an advanced stage when diag-nosed [3]. Presently, GC treatments include surgical resection, chemotherapy, and/or radiation therapy [4,
5]. Surgery together with chemotherapy or other ther-apy methods has been shown to be much more effective than surgery alone [6]. Nevertheless, the prognosis of GC is poor due to metastasis. The 5-year survival rate for advanced GC is less than 10% [7, 8]; therefore early diag-nosis is vital for successful treatment.
Despite advances in biotechnology and endoscopy screening, more than 80% of patients with GC are diag-nosed at an advanced stage or experience tumor recur-rence after surgery [9], which significantly affects prognosis. Existing histopathologic classification schemes, including Lauren classification [10], Ming clas-sification [11], Goseki classification [12], and World Health Organization histologic type and grade classifica-tion, cannot predict a patient’s prognosis [13]. There is an
Open Access
*Correspondence: daguangjida@163.com; suojian42@gmail.com 1 Department of Gastrointestinal Surgery, The First Hospital of Jilin University, Changchun 130021, Jilin, China
urgent need for additional biomarkers to identify patients at risk of poor outcomes or recurrence.
GC is a heterogeneous disease, and its initiation and progression are influenced strongly by genetic and envi-ronmental factors [14]. Presently, many candidate gene products, such as MUC1, CEA, p53, p16, and E-cadherin, have been suggested to predict the survival of patients with GC [15–19]. Although there has been much inves-tigation of the genetic factors that predict survival, few genetic alterations have been used in GC diagnosis. Recently, it has become possible to conduct large-scale molecular studies on formalin-fixed tissue samples with tissue microarrays and immunohistochemistry. Such large-scale studies have involved numerous markers and cases. For example, a large-scale cluster analysis showed that multiple markers correlated significantly with patient survival [20, 21]. Therefore, tissue microarrays and immunohistochemistry may be a practical method for routine testing and validation studies.
In a previous study, we screened for GC-associated signaling proteins using protein pathway arrays (PPAs) and found that 22 proteins, or phosphorylated (p)-pro-tein forms, were differentially expressed between cancer and normal tissues. Of those 22 proteins, the follow-ing 9 were upregulated in GC tissues [1]: proliferating cell nuclear antigen (PCNA), Notch4, cyclin-depend-ent kinase (CDK)4, CDK6, X-linked inhibitor of apop-tosis protein (XIAP), p-protein kinase C (PKC)α/βII, Akt, β-catenin, and p-PKCα. In this study, we aimed to verify overexpression of these proteins in GC using tis-sue microarrays and immunohistochemistry. We also analyzed survival characteristics to establish prognostic scoring models to improve clinical outcome predictions.
Materials and methods
Patients and tissue samples
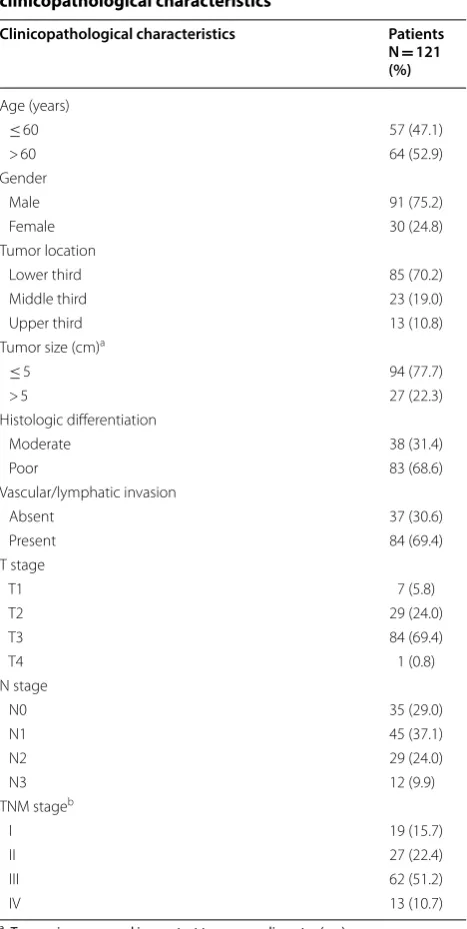
This study included 121 surgically resected primary GC samples collected from patients who underwent D2 gastrectomy over a period of 5 years, between Janu-ary of 2006 and December of 2012, and 30 normal gas-tric samples from patients who underwent gastrectomy for non-cancer diseases. Two pathologists confirmed the histological diagnoses and tumor-node-metastasis (TNM) staging of the collected tissues. Clinicopathologi-cal characteristics of the GC patients, including gender, age, tumor size, tumor location, histologic differentia-tion, vascular or lymphatic invasion, and tumor stage, were obtained by reviewing medical charts and pathol-ogy records (Table 1). None of the patients received preoperative chemotherapy or radiotherapy. Patients were followed-up from the date of surgery for a period
of 6–119 months (mean, 55 months) and clinical out-comes were recorded. Survival time was calculated from the date of surgery to the date of death or the last day of follow-up. The majority of the patients died of the cancer. Cases lost to follow-up were not included in our survival analysis. The Institution Ethical Review Board of The First Hospital of Jilin University approved this study, and all of the patients provided informed consent.
Table 1 Summary of patient demographics and clinicopathological characteristics
a Tumor size measured in greatest transverse diameter (cm)
b TNM staging was performed according to the American Joint Committee on Cancer. No patient had metastasis to distant organs (M0)
Clinicopathological characteristics Patients
N = 121 (%)
Age (years)
≤ 60 57 (47.1)
> 60 64 (52.9)
Gender
Male 91 (75.2)
Female 30 (24.8)
Tumor location
Lower third 85 (70.2)
Middle third 23 (19.0)
Upper third 13 (10.8)
Tumor size (cm)a
≤ 5 94 (77.7)
> 5 27 (22.3)
Histologic differentiation
Moderate 38 (31.4)
Poor 83 (68.6)
Vascular/lymphatic invasion
Absent 37 (30.6)
Present 84 (69.4)
T stage
T1 7 (5.8)
T2 29 (24.0)
T3 84 (69.4)
T4 1 (0.8)
N stage
N0 35 (29.0)
N1 45 (37.1)
N2 29 (24.0)
N3 12 (9.9)
TNM stageb
I 19 (15.7)
II 27 (22.4)
III 62 (51.2)
Tissue microarrays
Tissue microarrays were prepared as previously described [22]. Briefly, whole sections of individual donor tissue blocks, which were stained with hematoxylin and eosin (H&E), were used to select tumor areas for tissue micro-array cores. Three cylinders of tissues (0.6 mm in diam-eter) were punched from each sample and re-embedded in a recipient paraffin block at predetermined positions. Multiple 4-µm-thick sections were cut from each tissue array block and mounted on microscope slides.
Immunohistochemistry
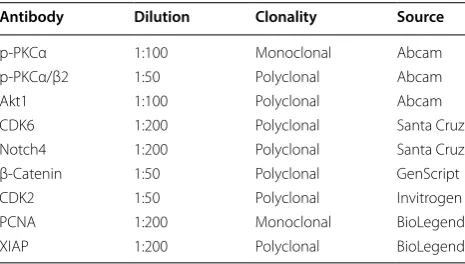
Sections on tissue microarray slides were dewaxed in xylene and then rehydrated in a series of graded alcohols. Antigen retrieval was performed by autoclaving the sec-tions in citrate buffer (pH 6.0) for 2 min and then cool-ing them in dH2O. Then, the sections were immersed in 3% hydrogen peroxide in phosphate-buffered saline (PBS) for 15 min to block endogenous peroxidase activity. Non-specific binding was then blocked in 10% normal goat serum at room temperature for 10 min. Subsequently, the sections were incubated with primary antibodies (Table 2) at 4 °C overnight in a moist chamber. After washing with PBS, the sections were incubated with secondary antibodies for 1 h at room temperature. The sections were stained with 3,3-diaminobenzidine and counterstained with Harris hematoxylin, dehydrated, and mounted. Immunoreactivity was evaluated microscopi-cally by two pathologists. Protein staining was graded according to a previous study [23]: 0, negative, − (no cells stained); 1, weakly positive, + (< 10% of cells stained); 2, moderately positive < ++ (10–50% of cells stained); or 3, strongly positive, +++ (> 50% cells stained).
Cluster analysis
Hierarchical cluster analysis was conducted in the Cluster program (complete linkage clustering) [24]. Clustering analysis results were displayed in TreeView
software [25]. Expression data were graded as fol-lows: − 3, negative staining; 1, weak positive staining; 2, moderately positive staining; and 3, strongly positive staining.
Signaling network analysis
To visualize the interactions and upstream regulators of differentially expressed proteins, pathway and network analyses were carried out in Ingenuity Pathway Analy-sis version 9.0 (IPA), a protein-gene and protein–pro-tein interaction analysis program.
Statistical analysis
Chi-square test and Fisher’s exact (two-sided) tests were used to determine associations between protein expression status and clinicopathological variables. Kaplan–Meier survival curves were created, and differ-ences between the curves were examined by log-rank testing. Cox proportional hazard regression analysis was used to determine independent prognostic factors. Principal component analysis (PCA) was performed to establish a survival prediction model for GC patients. Additionally, the Kaiser–Meyer–Olkin measure and Bartlett’s test of sphericity were used to ensure appro-priate extraction factor analysis. To determine the opti-mal prognosis prediction model, receiver operating characteristic (ROC) curve analysis was applied to prin-cipal components (PCs), and the area under the curves (AUCs) were calculated. All analyses were performed in SPSS 17.0 (SPSS Inc, Chicago, IL). A p value < 0.05 was considered to be statistically significant.
Results
Protein expression profiling in GC and normal tissues
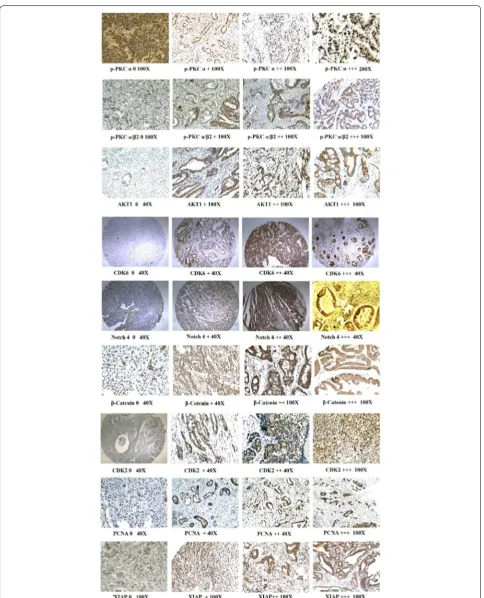
The immunohistochemistry results for the nine evalu-ated proteins are shown in Fig. 1 and summarized in Table 3. Notably, p-PKCα was expressed in 97.5% (117/121) of the GC cases, with weakly positive, mod-erately positive, and strongly positive expression in 46, 59, and 12 cases, respectively. Meanwhile, p-PKCα was expressed in 66.7% (20/30) of the normal tissues, with weakly positive, moderately positive, and strongly posi-tive expression in 10, 19, 1 and 0 cases, respecposi-tively. p-PKCα/β2 was expressed in 82.6% (100/121) of the GC cases; weakly positive, moderately positive, and strongly positive expression was seen in 59, 37, and 4 cases, respectively, whereas weakly positive p-PKCα/ β2 expression was observed in 32.5% (13/30) of the normal tissues. Akt1 was expressed in 81.8% (99/121) of the GC cases, and weakly positive, moderately
Table 2 Antibodies used for immunohistochemistry
Antibody Dilution Clonality Source
p-PKCα 1:100 Monoclonal Abcam
p-PKCα/β2 1:50 Polyclonal Abcam
Akt1 1:100 Polyclonal Abcam
CDK6 1:200 Polyclonal Santa Cruz
Notch4 1:200 Polyclonal Santa Cruz
β-Catenin 1:50 Polyclonal GenScript
CDK2 1:50 Polyclonal Invitrogen
PCNA 1:200 Monoclonal BioLegend
positive, and strongly positive expression was seen in 73, 20, and 6 cases, respectively, whereas weakly posi-tive Akt1 expression was seen in 33.3% (10/30) of the normal tissues. CDK6 was expressed in 62.0% (75/121) of the GC cases, and weakly positive, moderately posi-tive, and strongly positive expression was seen in 68, 4, and 4 cases, respectively, whereas weakly positive CDK6 expression was seen in 83.3% (25/30) of the nor-mal tissues. Notch4 was expressed in 95.0% (115/121) of the GC cases, with weakly positive, moderately posi-tive, and strongly positive expression in 64, 48, and 3 cases, respectively, whereas weakly positive Notch4 expression was seen in 73.3% (22/30) of the normal tis-sues. β-Catenin was expressed in 96.7% (117/121) of the GC cases, with weakly positive, moderately posi-tive, and strongly positive expression in 96, 21, and 0 cases, respectively. β-Catenin was expressed in 93.3% (28/30) of the normal tissues, with weakly positive, moderately positive, and strongly positive expression in 27, 1, and 0 cases, respectively. CDK2 was expressed in 56.2% (68/121) of the GC cases, with weakly positive, moderately positive, and strongly positive expressio in 55 cases, 12 cases, and 1 case, respectively, whereas no CDK2 immunopositivity was seen in normal tis-sues. PCNA was expressed in 97.5% (118/121) of the GC cases, and weakly positive, moderately positive, and strongly positive expression in 7, 57, and 54 cases, respectively. PCNA was expressed in 73.3% (22/30) of the normal tissues, with weakly positive, moderately positive, and strongly positive expression in 21, 1, and 0 cases, respectively. XIAP was expressed in 97.5% (101/121) of the GC cases, with weakly positive, moder-ately positive, and strongly positive expression in 63, 32, and 6 cases, respectively. XIAP was expressed in 93.3% (28/30) of the normal tissues, with weakly positive,
moderately positive, and strongly positive expression in 26, 2, and 0 cases, respectively. In GC cells, p-PKCα/ β2, Akt1, CDK6, Notch4, and PCNA were expressed mainly in the nucleus and the cytoplasm. CDK6 was also expressed in some muscle tissues near GC cells. p-PKCα, CDK2, and XIAP were expressed mainly in the nucleus with low-level expression in the cytoplasm. Of the nine proteins, eight (p-PKCα, p-PKCα/β2, Akt1, CDK6, Notch4, CDK2, PCNA, and XIAP) were upregu-lated in GC tissues when compared to normal tissues (Chi-square or Fisher’s exact tests, p < 0.05; Table 3).
Correlations between protein expression profiles and clinicopathologic parameters of GC
Correlations between protein expression status (negative vs. positive) and clinicopathologic characteristics were determined (summarized in Table 4). Positive p-PKCα/β2 and CDK2 expression in primary GC was associated with older age (p < 0.05). Increased CDK2 expression also cor-related with the presence of vascular/lymphatic invasion (p = 0.014), advanced N stage (p = 0.042), and advanced TNM stage (p = 0.020).
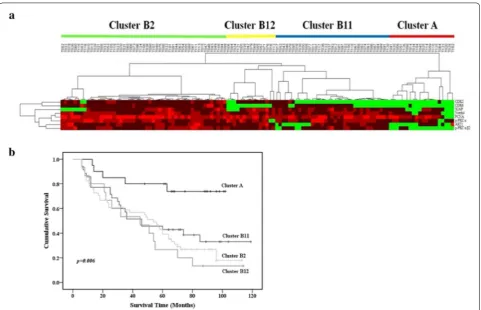
Hierarchical cluster analysis of GC and survival‑associated feature selection
Hierarchical cluster analysis was performed with eight pro-tein expression profiles from 121 GC cases. Tumors were separated into two clusters based on protein expression patterns (Fig. 2a). Cluster A contained 20 cases and Clus-ter B contained 101 cases. Eight of the proteins had much lower (including negative) expression in Cluster A than in Cluster B. Furthermore, Cluster B was subdivided into three subclusters: B11 (35 cases), B12 (15 cases), and B2 (51 cases). Comparison of differences in clinicopathologi-cal characteristics among the four (sub)clusters, showed
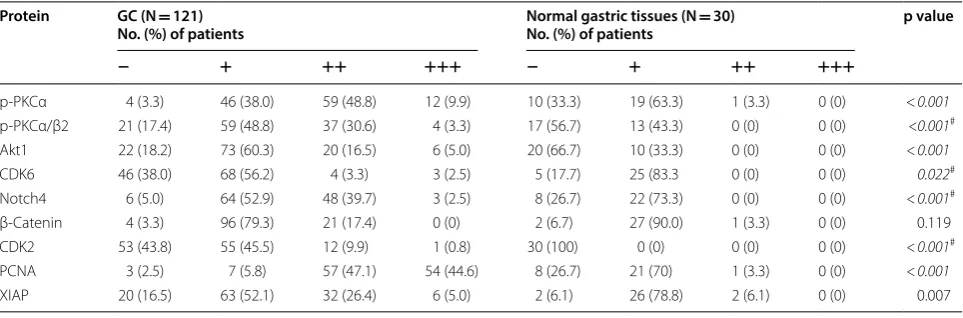
Table 3 Expression of nine GC-associated proteins in GC and normal tissues detected by immunohistochemistry
Data are shown for negative (−), weakly positive (+), moderately positive (++), and highly positive (+++) labeling
p values were obtained by Chi-square test or the Fisher’s exact test; #Fisher’s exact test used with theoretical frequency < 1, italic values: p < 0.05
Protein GC (N = 121)
No. (%) of patients Normal gastric tissues (N No. (%) of patients = 30) p value
− + ++ +++ − + ++ +++
p-PKCα 4 (3.3) 46 (38.0) 59 (48.8) 12 (9.9) 10 (33.3) 19 (63.3) 1 (3.3) 0 (0) < 0.001
p-PKCα/β2 21 (17.4) 59 (48.8) 37 (30.6) 4 (3.3) 17 (56.7) 13 (43.3) 0 (0) 0 (0) <0.001#
Akt1 22 (18.2) 73 (60.3) 20 (16.5) 6 (5.0) 20 (66.7) 10 (33.3) 0 (0) 0 (0) <0.001
CDK6 46 (38.0) 68 (56.2) 4 (3.3) 3 (2.5) 5 (17.7) 25 (83.3 0 (0) 0 (0) 0.022#
Notch4 6 (5.0) 64 (52.9) 48 (39.7) 3 (2.5) 8 (26.7) 22 (73.3) 0 (0) 0 (0) <0.001#
β-Catenin 4 (3.3) 96 (79.3) 21 (17.4) 0 (0) 2 (6.7) 27 (90.0) 1 (3.3) 0 (0) 0.119
CDK2 53 (43.8) 55 (45.5) 12 (9.9) 1 (0.8) 30 (100) 0 (0) 0 (0) 0 (0) <0.001#
PCNA 3 (2.5) 7 (5.8) 57 (47.1) 54 (44.6) 8 (26.7) 21 (70) 1 (3.3) 0 (0) <0.001
that Cluster A contained earlier TNM-stage cases than the three B subclusters. Cluster B2 contained more cases with vascular/lymphatic invasion than Cluster A. Kaplan–Meier analysis revealed that Cluster A cases had better survival than cases in Clusters B11, B12, and B2 (p = 0.006; Fig. 2b). Multivariate Cox proportional hazard regression analy-sis of age, tumor size, histologic differentiation, vascular/
lymphatic invasion, TNM stage, and expression of the eight proteins (Cluster A vs. Cluster B) showed that expression of the eight proteins was an independent prognostic indica-tor of survival (hazard ratio, 5.822; 95% confidence interval, 2.317–14.625; p < 0.001). In addition, age at surgery, tumor size, and TNM stage were also independent prognos-tic indicators of survival with hazard ratios of 1.914 (95%
Table 4 Correlation between protein expression and clinicopathologic characteristics (p values are shown)
p values were obtained by Chi-square or Fisher’s exact tests; #p values obtained by Fisher’s exact test used with theoretical frequency < 1
Variables p‑PKCα p‑PKCα/β2 Akt1 CDK6 Notch4 CDK2 PCNA XIAP
Age (years) > 0.99 0.048 0.213 0.211 0.160 0.001 0.919 0.836
Gender 0.256# 0.659 0.804 0.489 0.338 0.628 0.573# 0.163
Tumor location 0.217# 0.404 0.092 > 0.99 0.288# 0.453 0.372# > 0.99
Tumor size 0.574# 0.494 0.173 0.570 > 0.99 0.066 0.535# 0.983
Histologic differentiation 0.407 0.758 0.332 0.56 0.212 0.516 0.551# 0.882
Vascular/lymphatic invasion > 0.99 0.459 0.889 0.098 > 0.99 0.014 0.552# 0.553
T stage > 0.99# 0.586# 0.111# 0.701# 0.356# 0.123# > 0.99# 0.925#
N stage 0.790# 0.745 0.504 0.103 0.390# 0.042 0.236# 0.575
TNM stage 0.766# 0.714 0.390 0.447 0.647# 0.020 > 0.99# 0.765
confidence interval, 1.186–3.089; p = 0.008), 1.989 (95% confidence interval, 1.175–3.367; p = 0.01), and 1.961 (95% confidence interval, 1.294–2.971; p = 0.002), respectively.
Feature selection was performed with the Kaplan–Meier method (univariate analysis) to identify protein expres-sion profiles associated with survival. Overall survival was worse in cases with CDK2, Akt1, XIAP, Notch4, and p-PKCα/β2 than in cases without immunopositivity for these proteins (log-rank test: p = 0.014, 0.026, 0.042, 0.011, and < 0.001, respectively; Fig. 3).
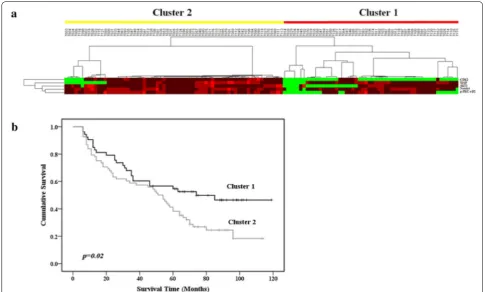
After feature selection, further hierarchical cluster analysis of 121 cases and five survival-associated proteins (CDK2, Akt1, XIAP, Notch4, and p-PKCα/β2) segre-gated the cases into Cluster 1 (53 cases) and Cluster 2 (68 cases) (Fig. 4a). Univariate analysis performed to deter-mine whether these clusters were indicative of clinically distinct subgroups showed that Cluster 2 cases had poorer prognoses than Cluster 1 cases (p = 0.02; Fig. 4b). Multi-variate analysis revealed that this classification (Cluster 1 or 2) was an independent prognostic indicator of survival (hazard ratio, 2.370; 95% confidence interval, 1.447–3.879; p = 0.001).
Establishment of a risk model to predict prognoses of GC patients
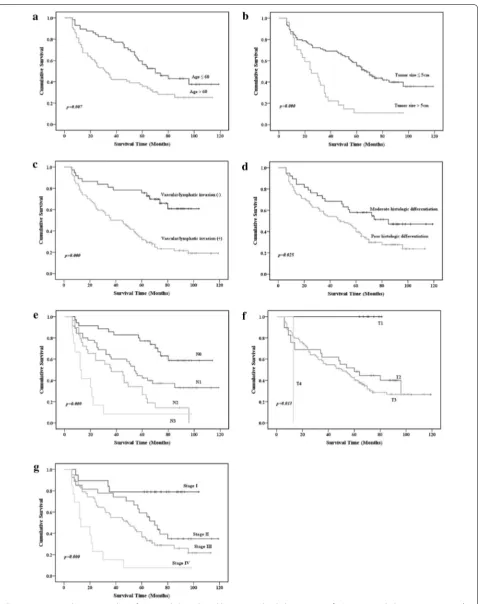
Kaplan–Meier analysis (univariate) performed to identify clinicopathological variables associated with GC prognosis indicated that age at surgery, tumor size, T stage, N stage, TNM stage, vascular/lymphatic invasion, and histologic differentiation correlated with overall survival (p< 0.05; Fig. 5). To exclude redundant variables, five proteins (CDK2, AKT1, XIAP, Notch4, and p-PKC α/β2) and five clinicopathological variables (age of surgery, tumor size, TNM stage, vascular/lymphatic invasion, and histologic differentiation) were included in a PCA analysis to extract features. T stage and N stage were excluded from the analy-sis because they are encompassed in the TNM stage vari-able. The proteins and clinicopathological variables were considered categorical covariates with corresponding cate-gories and codes: protein expression (immunonegative = 0, immunopositive = 1); gender (female = 0, male = 1); age (≤ 60 = 0, > 60 = 1); tumor size (≤ 5 = 0, > 5 = 1); histologic differentiation (moderate = 0, poor = 1); vascular/lym-phatic invasion (absent = 0, present = 1); TNM stage (I = 0, II = 1, III = 2, IV = 3). The code “0” was assigned to the reference category. The Kaiser–Meyer–Olkin measure of sampling adequacy was 0.602 and the significance level (p value) for Barlett’s Test of Sphericity was < 0.001, thus the data were deemed suitable for analysis.
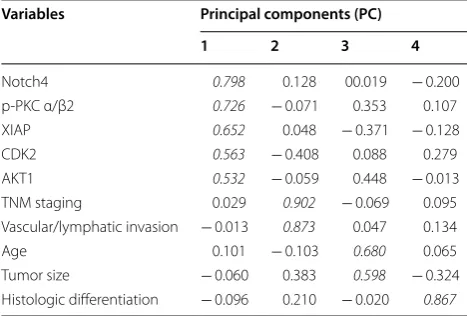
Four factors (PC 1–4) arose from our analysis of PCs with eigenvalues > 1.0 in the PCA. The contributing rate of the cumulative sums of the squares was 65.16%. PC load-ings for each of the variables are shown in Table 5. PC 1
was heavily loaded with the Notch4, p-PKCα/β2, XIAP, DK2, and Akt1 variables and termed the protein factor. PC 2 was heavily loaded with the TNM stage and vascular/ lymphatic invasion variables and was termed the patholog-ical factor. PC 3 was heavily loaded with the age and tumor size variables and was termed the clinical factor. PC 4 was heavily loaded with the histologic differentiation variable. PC scores (calculated in SPSS) indicated that each of these four factors was independent of the others.
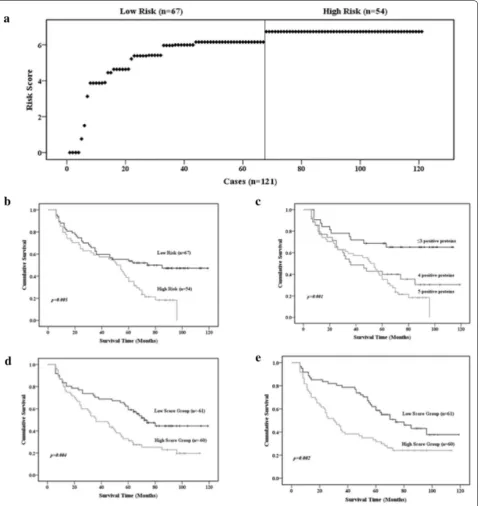
Because PC 1 was a five-protein factor, we established a risk score model based on the five proteins to predict GC prognosis. Risk scores were calculated on the basis of pro-tein expression status (immunonegative/immunopositive) and the corresponding regression coefficients from univar-iate Cox proportion hazard regression analysis. Risk scores for patients were calculated by multiplying the regression coefficient of a protein by the protein expression status for each protein and then summing the values. The regres-sion coefficients for Notch4, p-PKCα/β2, XIAP, CDK2, and Akt1 were 3.13, 1.52, 0.74, 0.58, and 0.77, respectively. Therefore, in this study, a risk score = 3.13 × (Notch4) + 1.52 × (p-PKCα/β2) + 0.74 × (XIAP) + 0.58 × (CDK2) + 0.77 × (Akt1). The distribution of risk scores for the 121 patients (range, 0–6.73) is presented in Fig. 6a. Based on the risk score curve, the patients were separated into two groups: low-risk (scores < 6.15; 54 cases) and high-risk (scores ≥ 6.15; 67 cases). Kaplan–Meier analysis revealed that overall survival of patients was worse in the high-risk score group than in the low-risk score group (log-rank test: p = 0.005; Fig. 6b) indicating that the risk score model based on Notch4, p-PKCα/β2, XIAP, CDK2, and Akt1 expression predicts GC prognosis.
To further determine whether the number of immu-nopositive proteins indicated differential overall sur-vival, we regrouped the patients according to numbers of immunopositive proteins: five immunopositive pro-teins (6.73; 54 cases), four immunopositive propro-teins (5.96–6.15; 35 cases), and ≤ 3 immunopositive proteins (0–5.41; 32 cases). Kaplan–Meier analysis showed that patients with ≤ 3 immunopositive proteins had bet-ter overall survival (log-rank test: p = 0.001), whereas patients with 4 or 5 immunopositive proteins had simi-lar and worse overall survival (Fig. 6c).
group had better overall survival than the high-score group (log-rank test: p = 0.002; Fig. 6e). Thus, PC 2 and PC 3 scores can predict GC prognosis. Histologic differentiation in PC 4 separated GC patients into two natural groups. Patients with poor histologic differen-tiation had worse overall survival than those with mod-erate differentiation.
ROC curve analysis AUCs for PCs 1–4 were 0.728, 0.732, 0.630, and 0.599, respectively. The sensitivity/spec-ificity/accuracy of PCs 1–4 were 81.48%/49.2%/63.64%, 76.67%/47.54%/61.98%, 75%/45.90%/60.33%, and 71.08%/ 50%/64.465, respectively. To obtain a risk score prog-nostic model with higher sensitivity, specificity, and accuracy, a risk score model (PC combination) based on the five proteins and the five clinicopathological vari-ables from the four PCs was established. The risk score was calculated as follows: risk score = 3.13 × (Notch4) ± 1.52 × (p-PKCα/β2) + 0.74 × (XIAP) + 0.58 × (CDK2) + 0.77 × (Akt1) + 0.74 × (TNM stage) + 1.20 × (vascu-lar/lymphatic invasion) + 0.97 × (tumor size) + 0.61 × (age) + 0.58 × (histologic differentiation). The distribu-tion of risk scores for the 121 patients (range, 0.58–11.57) is presented in Fig. 7a. Based on the median score (9.25), the patients were separated into low-score (< 9.25; 60
cases) and high-score (≥ 9.25; 61 cases) groups. Kaplan– Meier analysis revealed that overall survival was worse in the high-score group than in the low-score group (log-rank test: p = 0.005; Fig. 7b). The AUC, sensitivity, speci-ficity, and accuracy were 0.912, 96.72%, 70%, and 83.47% for the PC combination risk model, and these values are higher than the values obtained for the four individual PCs (p < 0.001). Thus, the PC combination risk score model predicted the prognosis of GC patients better than the four PCs (Fig. 7c).
Identification of signaling networks associated with survival of patients with GC
category showed that all eight of the proteins studied were related to cancer (p = 3.00 × 10⁻⁸–1.80 × 10⁻²), and seven of the proteins associated with metabolic dis-ease (p = 6.47 × 10⁻⁸–1.10 × 10⁻²). IPA results revealed that the eight proteins evaluated in this study are involved in several canonical signaling pathways, includ-ing molecular mechanisms of cancer (p = 1.56 × 10⁻⁹), HER-2 signaling (p = 1.97 × 10⁻⁸), gloma signaling (p = 4.66 × 10⁻⁸), HGF signaling (p = 7.01 × 10⁻⁸), MAPK signaling (p = 1.31 × 10⁻⁶), ErB4 signaling (p = 7.02 × 10⁻⁶), IL-3 signaling (p = 3.17 × 10⁻⁶), VEGF signal-ing (p = 6.28 × 10⁻⁶), p53 signaling (p = 8.4 × 10⁻⁶), 14-3-3-mediated signaling (p = 1.35 × 10⁻⁵), p70S6K sign-aling (p = 1.47 × 10⁻⁵), mTOR signaling (p = 5.45 × 10⁻⁵), EGF signaling (p = 2.59 × 10⁻⁴), cell cycle G1/S check-point regulation (p = 3.28 × 10⁻⁴), ERK/MAPK signaling (p = 2.81 × 10⁻³), and JAK/Stat signaling (p = 3.13 × 10⁻²; Fig. 8a).
Two networks with scores of 23 and 0 were identi-fied by IPA; the former was selected for further analy-sis. In this network, Akt, CDK2, PKC, caspase, ERK1/2, and cyclin D interacted closely with additional protein signals (Fig. 8b). Upstream analysis of the IPA network detected 525 upstream regulators of the eight proteins, including plant extracts, chemical medicines, microR-NAs, transcriptional regulators, kinases, and cytokines. The most significant upstream regulators included embe-lin (CDK2, CDK6, XIAP; p = 4.73 × 10⁻⁹), butyric acid (CDK2, CDK6, PCNA, PRKCB, XIAP; p = 1.06 × 10⁻⁷), silibinin (CDK2, CDK6, XIAP; p = 5.19 × 10⁻⁷), silicon phthalocyanine (CDK2, CDK6; p = 1.34 × 10⁻⁶), ingenol mebutate (PRKCA, PRKCB; p = 1.34 × 10⁻⁶), rottlerin (CDK6, PCNA, XIAP; p = 1.41 × 10⁻⁶), methylselenic acid (AKT1, CDK2, PCNA, PRKCA; p = 1.41 × 10⁻⁶),
and resveratrol (CDK2, CDK6, PCNA, XIAP; p = 1.48 × 10⁻⁶). Overall, PCNA, PRKCB, CDK6, CDK2, AKT1, PRKCA, and XIAP were regulated by 4, 2, 6, 5, 1, 2, and 5 upstream regulators, respectively (Fig. 8c).
Discussion
In this study, to reduce the limitations to clinical appli-cation, we used the tissue microarray method on forma-lin-fixed specimens to evaluate the expression of nine proteins that we identified in a previous PPA study [1] in 121 primary GC tissues and 30 normal gastric tis-sues. The results showed that all of the nine proteins were expressed in primary GC tissues and eight of the proteins (all except CDK2) were expressed in normal gastric tis-sues. Additionally, eight of the proteins were upregulated in GC tissues, in accordance with our previous findings [1].
Hierarchical clustering of immunolabeling data from tissue microarrays of 121 formalin-fixed GC samples with nine GC-associated antibodies yielded patient clus-ters based on protein expression patterns. The patients in Cluster A (20 cases) had better survival than patients in Cluster B11 (35 cases), Cluster B12 (15 cases), and Clus-ter B2 (51 cases) (p = 0.006).
Feature selection based on Kaplan–Meier survival analysis yielded Cluster 1 (53 cases) and Cluster 2 (68 cases), which had distinct clinicopathologic features and patient outcomes, with Cluster 2 being associated with poorer prognoses than Cluster 1. Examination of sub-sequently developed risk score models established to predict clinical outcomes indicated that the PC combi-nation prognosis risk model based on five proteins and five clinicopathological variables was clinically relevant and useful for guiding medical treatment. For exam-ple, aggressive chemotherapy may be recommended for patients with high-risk scores in this model to improve survival.
We correlated the five proteins obtained from feature selection with clinicopathologic characteristics. Given the generally long delays from tumorigenesis to diagno-sis, protein markers would enable earlier diagnoses. Cur-rently, GC is diagnosed based on symptoms, patients’ knowledge of the disease, and the overall medical condi-tion of the patient. Age is also a major factor in GC diag-nosis [26]. In our study, the expression levels of p-PKCα/ β2 and CDK2 were higher in patients > 60 years old than in younger patients. In addition to age, depth of invasion can be considered a prognostic factor and an indicator of GC progression. Previous studies have shown that vas-cular/lymphatic invasion status correlates with GC pro-gression [27, 28]. This study showed that upregulation of CDK2 correlates with vascular/lymphatic invasion.
Table 5 Component matrix of variables associated with gastric cancer prognosis
Extration methods: Principal components analysis. Italic valus: the variables in different PCs
Variables Principal components (PC)
1 2 3 4
Notch4 0.798 0.128 00.019 − 0.200
p-PKC α/β2 0.726 − 0.071 0.353 0.107
XIAP 0.652 0.048 − 0.371 − 0.128 CDK2 0.563 − 0.408 0.088 0.279 AKT1 0.532 − 0.059 0.448 − 0.013
TNM staging 0.029 0.902 − 0.069 0.095
Vascular/lymphatic invasion − 0.013 0.873 0.047 0.134
Age 0.101 − 0.103 0.680 0.065
Tumor size − 0.060 0.383 0.598 − 0.324
CDK2 expression also correlated with N stage and TNM stage, suggesting that CDK2 may play an important role in GC progression, invasion, and metastasis.
XIAP), the cell cycle (CDK6 and CDK2), cell differ-entiation (Notch4), and cell proliferation (PCNA). A deregulated cell cycle is a fundamental aspect of cancer. Normal cells only proliferate in response to mitogenic or
developmental signals, whereas cancer cells proliferate unchecked [29]. In addition, upregulation of PCNA, Akt, and CDK2 has been associated with GC [30–32].
Fig. 7 Association between the PC combination risk score model and survival. a The PC combination risk score model was based on five proteins and five clinicopathological variables from four PCs. The patients were ranked according to their risk scores; the line divides patients into low-risk and high-risk score groups. b Kaplan–Meier survival analysis of patients in the low-risk and high-risk score groups. p values were determined by the log-rank test. c ROC curves for the various prognosis prediction models. Five prediction models, PC combination, PC1, PC2, PC3, and PC4, were included in the analysis. The PC combination and PC1 models were better predictors than the other models (p < 0.05)
0 2 4 6 8 10
-log(p-value
)
a
b
Pathway analysis revealed that the proteins evaluated in this study are involved in several canonical signaling pathways, including HER-2 signaling, MAPK signal-ing, VEGF signalsignal-ing, and p53 signaling. It has been sug-gested that HER-2 expression is a prognostic indicator of GC [33]. MAPK signaling mediates many biological events, such as cell proliferation, differentiation, apop-tosis, migration, and invasion in various human cancers, including GC [34, 35]. VEGF is a potent angiogenic factor that has been implicated in tumor-induced angiogenesis, which has been shown to be related to GC development and prognosis [36]. p53 is a transcription factor that reg-ulates a complex signal transduction network referred to as the p53 pathway. The p53 tumor suppressor protein plays a critical role in protection from tumor progres-sion by inducing apoptosis or cell cycle arrest [37]. Thus, we speculate that the proteins evaluated in this study are involved in GC progression and prognosis via these pathways.
Conclusion
In this study, tissues from 121 GC cases were immuno-labeled with nine tumor-associated antibodies in tissue microarrays. Hierarchical cluster analysis based on eight upregulated proteins revealed two clusters with different clinicopathologic features and prognoses. Kaplan–Meier method-based feature selection revealed five proteins that correlated strongly with overall survival suggesting that a risk score model including these proteins could predict the prognoses of patients with GC. These pro-teins have been shown to be involved in cancer-related signaling pathways. Future studies will focus on elucidat-ing the roles of these proteins in GC.
Abbreviations
GC: gastric cancer; PPA: protein pathway array; P: phosphorylated; PCNA: proliferating cell nuclear antigen; CDK: cyclin-dependent kinase; XIAP: X-linked inhibitor of apoptosis protein; PKC: protein kinase C; TNM: tumor-node-metastasis; H&E: hematoxylin and eosin; PBS: phosphate-buffered saline; IPA: ingenuity pathway analysis; PCA: principal component analysis.
Acknowledgements
We thank the Department of Pathology of the First Hospital of Jilin University for technical support in preparing the samples.
Authors’ contributions
JS, DGW, and WL conceived and designed the study. WL, YC, and JPY performed the experiments. WL and XS analyzed the data. JS and DGW performed the surgery. JPY and XS prepared the samples. All authors read and approved the final manuscript.
Funding
This research was funded by grants from the National Natural Science Foundation of China (No. 81372295 and No. 81402374) and the Excellent Young Foundation of Jilin Scientific and Technological Development Program (20170520002JH).
Availability of data and materials Not applicable.
Ethics approval and consent to participate
This study was reviewed and approved by the Institution Ethical Review Board of The First Hospital of Jilin University (No. 2014-087).
Consent for publication Not applicable.
Competing interests
The authors declare that they have no competing interests.
Author details
1 Department of Gastrointestinal Surgery, The First Hospital of Jilin University, Changchun 130021, Jilin, China. 2 Jilin Province Key Laboratory of Bioinformat-ics for Gastrointestinal Tumor, Changchun, Jilin, China. 3 Department of Pathol-ogy, Mount Sinai School of Medicine, New York, NY, USA.
Received: 21 November 2018 Accepted: 1 August 2019
References
1. Wang D, Ye F, Sun Y, Li W, Liu H, Jiang J, et al. Protein signatures for clas-sification and prognosis of gastric cancer a signaling pathway-based approach. Am J Pathol. 2011;179(4):1657–66.
2. Chen W, Zheng R, Zuo T, Zeng H, Zhang S, He J. National cancer inci-dence and mortality in China, 2012. Chin J Cancer Res. 2016;28(1):1. 3. Wadhwa R, Taketa T, Sudo K, Blum MA, Ajani JA. Modern oncological
approaches to gastric adenocarcinoma. Gastroenterol Clin North Am. 2013;42(2):359–69.
4. Chen K, Xu XW, Zhang RC, Pan Y, Wu D, Mou YP. Systematic review and meta-analysis of laparoscopy-assisted and open total gastrectomy for gastric cancer. World J Gastroenterol. 2013;19(32):5365–76.
5. Pretz JL, Wo JY, Mamon HJ, Kachnic LA, Hong TS. Chemoradiation therapy: localized esophageal, gastric, and pancreatic cancer. Surg Oncol Clin N Am. 2013;22(3):511–24.
6. Ming-Ming T, Wang CS, Chung-Ying T, Huang HW, Chi HC, Lin YH, et al. Potential diagnostic, prognostic and therapeutic targets of microRNAs in human gastric cancer. Int J Mol Sci. 2016;17(6):945.
7. Muto M. Treatment of gastric cancer. World J Gastroenterol. 2014;10(7):729–35.
8. Oba K, Paoletti X, Bang YJ, Bleiberg H, Burzykowski T, Fuse N, et al. Role of chemotherapy for advanced/recurrent gastric cancer: an individual-patient-data meta-analysis. Eur J Cancer. 2013;49(7):1565–77.
9. Yasui W, Oue N, Ito R, Kuraoka K, Nakayama H. Search for new biomarkers of gastric cancer through serial analysis of gene expression and its clinical implications. Cancer Sci. 2010;95(5):385–92.
10. Lauren P. The two histological main types of gastric carcinoma, an attempt at a histoclinical classification. Acta Pathol Microbiol Scand. 1965;64(1):31–49.
11. Ming SC. Gastric carcinoma: a pathobiological classification. Cancer. 1977;39(6):2475–85.
12. Goseki N, Takizawa T, Koike M. Differences in the mode of the extension of gastric cancer classified by histological type: new histological clas-sification of gastric carcinoma. Gut. 1992;33(5):606–12.
13. Lee HS, Cho SB, Lee HE, Kim MA, Kim JH, Park DJ, et al. Protein expression profiling and molecular classification of gastric cancer by the tissue array method. Clin Cancer Res. 2007;13(14):4154–63.
14. Liu J, Deng N, Xu Q, Sun L, Tu H, Wang Z, et al. Polymorphisms of multiple genes involved in NER pathway predict prognosis of gastric cancer. Oncotarget. 2016;7(30):48130–42.
15. Tahara E. Genetic alterations in human gastrointestinal cancers. The application to molecular diagnosis. Cancer. 2015;75(S6):1410–7. 16. Gabbert HE, Müller W, Schneiders A, Meier S, Hommel G. The
relation-ship of p53 expression to the prognosis of 418 patients with gastric carcinoma. Cancer. 2015;76(5):720–6.
•fast, convenient online submission
•
thorough peer review by experienced researchers in your field
• rapid publication on acceptance
• support for research data, including large and complex data types
•
gold Open Access which fosters wider collaboration and increased citations maximum visibility for your research: over 100M website views per year
•
At BMC, research is always in progress.
Learn more biomedcentral.com/submissions
Ready to submit your research? Choose BMC and benefit from:
its relationship with the prognosis of the patients. Clin Cancer Res. 1998;4(11):2605.
18. Yonemura Y, Nojima N, Kaji M, Fujimura T, Itoh H, Ninomiya I, et al. E-cadherin and urokinase-type plasminogen activator tissue status in gastric carcinoma. Cancer. 2015;76(6):941–53.
19. Feakins RM, Nickols CD, Bidd H, Walton SJ. Abnormal expression of pRb, p16, and cyclin D1 in gastric adenocarcinoma and its lymph node metas-tases: relationship with pathological features and survival. Hum Pathol. 2003;34(12):1276–82.
20. Lee HS, Lee HK, Kim HS, Yang HK, Kim WH. Tumour suppressor gene expression correlates with gastric cancer prognosis. J Pathol. 2003;200(1):39–46.
21. Jacquemier J, Ginestier C, Rougemont J, Bardou VJ, Charafe-Jauffret E, Geneix J, et al. Protein expression profiling identifies subclasses of breast cancer and predicts prognosis. Can Res. 2005;65(3):767–79.
22. Ginestier C, Charafe-Jauffret E, Bertucci F, Eisinger F, Geneix J, Bechlian D, et al. Distinct and complementary information provided by use of tissue and DNA microarrays in the study of breast tumor markers. Am J Pathol. 2002;161(4):1223.
23. Rosen DG, Huang X, Deavers MT, Malpica A, Silva EG, Liu J. Validation of tissue microarray technology in ovarian carcinoma. Mod Pathol. 2004;17(7):790–7.
24. de Hoon MJ, Imoto S, Nolan J, Miyano S. Open source clustering software. Bioinformatics. 2004;20(9):1453–4.
25. Eisen MB, Spellman PT, Brown PO, Botstein D. Cluster analysis and display of genome-wide expression patterns. Proc Natl Acad Sci USA. 1998;95(25):14863–8.
26. Lee HJ, Yang HK, Ahn YO. Gastric cancer in Korea. Gastric Cancer. 2002;5(3):177–82.
27. Bu Z, Zheng Z, Li Z, Zhang L, Wu A, Wu X, et al. Lymphatic vascular invasion is an independent correlated factor for lymph node metastasis and the prognosis of resectable T2 gastric cancer patients. Tumor Biol. 2013;34(2):1005–12.
28. Kusano T, Shiraishi N, Shiroshita H, Etoh T, Inomata M, Kitano S. Poor prog-nosis of advanced gastric cancer with metastatic suprapancreatic lymph nodes. Ann Surg Oncol. 2013;20(7):2290–5.
29. Nakayama KI, Nakayama K. Ubiquitin ligases: cell-cycle control and can-cer. Nat Rev Cancan-cer. 2006;6(5):369–81.
30. Li N, Deng W, Ma J, Wei B, Guo K, Shen W, et al. Prognostic evaluation of Nanog, Oct4, Sox2, PCNA, Ki67 and E-cadherin expression in gastric cancer. Med Oncol. 2015;32(1):1–9.
31. Liang B, Wang S, Yang X, Ye Y, Yu Y, Cui Z. Expressions of cyclin E, cyclin dependent kinase 2 and p57 (KIP2) in human gastric cancer. Chin Med J. 2003;116(1):20–3.
32. Nam SY, Jung GA, Hur GC, Chung HY, Kim WH, Seol DW, et al. Upregula-tion of FLIPS by Akt, a possible inhibiUpregula-tion mechanism of TRAIL-induced apoptosis in human gastric cancers. Cancer Sci. 2003;94(12):1066–73. 33. Ross JS, Mckenna BJ. The HER-2/neu oncogene in tumors of the
gastroin-testinal tract. Cancer Invest. 2001;19(5):554–68.
34. Meng X, Zhang S. MAPK cascades in plant disease resistance signaling. Annu Rev Phytopathol. 2013;51(1):245–66.
35. Li P, Xue W-J, Feng Y, Mao Q-S. Long non-coding RNA CASC2 suppresses the proliferation of gastric cancer cells by regulating the MAPK signaling pathway. Am J Transl Res. 2016;8(8):3522.
36. Kakeji Y, Koga T, Sumiyoshi Y, Shibahara K, Oda S, Maehara Y, et al. Clinical significance of vascular endothelial growth factor expression in gastric cancer. J Exp Clin Cancer Res. 2002;21(1):125–9.
37. Harris SL, Levine AJ. The p53 pathway: positive and negative feedback loops. Oncogene. 2005;24(17):2899.
Publisher’s Note