www.the-cryosphere.net/5/869/2011/ doi:10.5194/tc-5-869-2011
© Author(s) 2011. CC Attribution 3.0 License.
The Cryosphere
The fate of lake ice in the North American Arctic
L. C. Brown and C. R. Duguay
Department of Geography and Environmental Management and Interdisciplinary Centre for Climate Change (IC3), University of Waterloo, Waterloo, Ontario, N2L 3G1, Canada
Received: 5 June 2011 – Published in The Cryosphere Discuss.: 5 July 2011 Revised: 3 October 2011 – Accepted: 6 October 2011 – Published: 20 October 2011
Abstract. Lakes comprise a large portion of the surface cover in northern North America, forming an important part of the cryosphere. The timing of lake ice phenological events (e.g. break-up/freeze-up) is a useful indicator of climate vari-ability and change, which is of particular relevance in envi-ronmentally sensitive areas such as the North American Arc-tic. Further alterations to the present day ice regime could result in major ecosystem changes, such as species shifts and the disappearance of perennial ice cover. The Canadian Lake Ice Model (CLIMo) was used to simulate lake ice phenol-ogy across the North American Arctic from 1961–2100 using two climate scenarios produced by the Canadian Regional Climate Model (CRCM). Results from the 1961–1990 time period were validated using 15 locations across the Cana-dian Arctic, with both in situ ice cover observations from the Canadian Ice Database as well as additional ice cover simulations using nearby weather station data. Projected changes to the ice cover using the 30-year mean data between 1961–1990 and 2041–2070 suggest a shift in break-up and freeze-up dates for most areas ranging from 10–25 days ear-lier (break-up) and 0–15 days later (freeze-up). The resulting ice cover durations show mainly a 10–25 day reduction for the shallower lakes (3 and 10 m) and 10–30 day reduction for the deeper lakes (30 m). More extreme reductions of up to 60 days (excluding the loss of perennial ice cover) were shown in the coastal regions compared to the interior conti-nental areas. The mean maximum ice thickness was shown to decrease by 10–60 cm with no snow cover and 5–50 cm with snow cover on the ice. Snow ice was also shown to in-crease through most of the study area with the exception of the Alaskan coastal areas.
Correspondence to: L. C. Brown
(lcbrown@uwaterloo.ca)
1 Introduction
Lakes are a major feature across northern North America, forming an important part of the cryosphere, with their ice cover both playing a role in and responding to climate vari-ability. Future changes in ice cover conditions due to chang-ing climate conditions could impact the role of lakes on en-ergy, water and biogeochemical processes in cold regions as well as socio-economic impacts in terms of transportation (ice roads) and recreation.
Both long-term and short-term trends have been identi-fied in ice phenology records and are typically associated with variations in air temperatures, while trends in ice thick-ness tend to be associated more with changes in snow cover (Brown and Duguay, 2010). Generally, lake ice records show trends towards earlier break-up, and later freeze-up (Northern Hemisphere: Magnuson et al., 2000; Europe: e.g. Blenckner et al., 2004; Korhonen, 2006; Palecki and Barry, 1986; Weyhenmeyer et al., 2004; Livingstone, 1999); North American Laurentian Great Lakes region: e.g. Jensen et al., 2007; Johnson and Stefan, 2006; Anderson et al., 1996). However, the statistical significance and magnitude of the trends varies by location and time scale examined (see Brown and Duguay, 2010).
Snow is a very important influencing factor for lake ice. Once the ice has formed, snow accumulation on the ice surface slows the growth of ice below due to the insulat-ing properties as a result of the lower thermal conductivity (thermal conductivity of snow, 0.08–0.54 Wm−1K−1versus 2.24 Wm−1K−1for ice, Sturm et al., 1997). Conversely, the mass of the snow can also change the composition of the ice by promoting snow ice development, and hence influence the thickness of the ice cover (Korhonen, 2006; Brown and Duguay, 2011).
Recent work using a combination of several datasets by Brown et al. (2010) showed a reduction of the spring snow cover extent throughout the pan-arctic from 1967–2008. Specifically for the North American Arctic, they found a 12 % reduction of mean snow cover extent in May and a 31 % reduction in June. Additionally, Tedesco et al. (2009) using passive microwave data, found that the melt season for arctic snow has decreased by 0.6 days yr−1 from 1978–
2008. Future climate predictions using the Arctic Climate Impact Assessment (ACIA) model ensemble also suggests the greatest changes to the arctic snow cover will occur dur-ing the sprdur-ing (ACIA, 2005). Increasdur-ing temperatures reduce the amount of snow in a region by decreasing the fraction of precipitation that falls as snow and also by increasing snowmelt, however, increasing precipitation could counter-act this (R¨ais¨anen, 2007). The complex intercounter-actions between increasing temperatures and increasing precipitation vary by region but climate model predictions for the 21st century tend to show shorter snow cover durations, with increased amounts of snow water equivalent in the colder northern re-gions of North America (R¨ais¨anen, 2007; Brown and Mote, 2009). Several studies have examined the trends in the cli-mate of the North American Arctic, typically showing warm-ing temperatures and increased precipitation (e.g. Zhang et al., 2007; Kaufmann et al., 2009) and those trends are pre-dicted to continue with future climate scenarios (e.g., ACIA, 2005; Bonsal and Kochtubajda, 2009). From a hydrological perspective little work has been done for this region examin-ing future changes, however, GCMs have been used in com-bination with hydrological models to predict changes within a small headwater basin (Pohl et al., 2007) and the larger Liard Basin (Woo et al., 2008; Thorne, 2011). River ice duration by 2050 for most of Canada is estimated to be ap-proximately 20 days shorter than 1961–1990, based on pro-jected changes to the 0◦isotherm (Prowse et al., 2007). In the Peace-Athabasca Delta (western end of Lake Athabasca) the ice cover is estimated to be up to 20 % thinner and with a re-duced duration of 2–4 weeks by 2071–2099, with most of the reduction being attributed to changes in break-up (Beltaos et al., 2006). Sea ice extent is also predicted to decrease with future climates (Holland et al., 2006). Changes to the sea ice within the Canadian Arctic Archipelago (CAA) for 2041–60 are predicted to show little change in wintertime ice concen-trations, with summer ice concentrations decreasing by 45 % and the thickness decreasing by 17 % in the winter and by
36 % in summer (Sou and Flato, 2009).
Many studies have examined how lake ice might respond to changes in both temperature and precipitation, and sensi-tivity analysis has shown that ice phenology is most sensitive to changes in air temperatures while ice thickness is more sensitive to snow cover (e.g., Vavrus et al., 1996; M´enard et al., 2002; Duguay et al., 2003; Gao and Stefan, 2004; Williams et al., 2004; Morris et al., 2005) (see Brown and Duguay, 2010 for a detailed comparison). While most work involving ice cover changes has been done for specific loca-tions, Walsh et al. (1998) produced gridded ice phenology for the entire Northern Hemisphere using historical 1931–1960 mean climate data to create the first wide-scale examination of lake ice phenology. A recent study using climate model output examining possible changes to the lake ice regime in North America from 40◦N to 75◦N under future climates suggests break-up will advance by 10–20 days, while freeze-up will be delayed by 5–15 days, resulting in a reduction of the ice cover duration by 15–35 days (Dibike et al., 2011).
In situ data is very sparse throughout northern North America and the majority of the climate stations in the Arc-tic are typically confined to relatively accessible areas of the mainland or coastal areas in the islands. The use of reanalysis data or climate model output data to drive numerical lake ice models provides the ability for wide-scale assessments of ice cover, as well as the ability to produce predictions of future ice conditions (Duguay et al., 2007; Dibike et al., 2011). The aim of this paper is to create gridded ice phenology data for North America (greater than 58◦N) using input data from the Canadian Regional Climate Model (CRMC) both for present day climate as well as future simulation, while highlighting the importance of snow cover on the potential changes to the lake ice regimes.
2 Study area and methodology 2.1 Study area
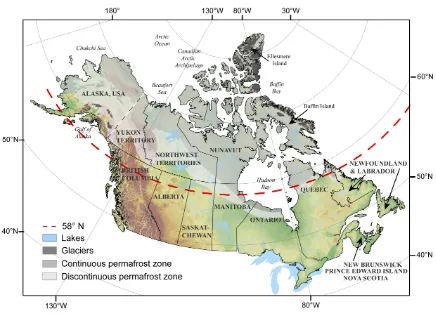
Canada and Alaska (USA), north of 58◦ latitude are dom-inated by discontinuous or continuous permafrost except at the southern reaches of the Yukon and Northwest Territo-ries (NWT), and northern part of the provinces of British Columbia and Alberta (Fig. 1). The area encompasses mainly subarctic and arctic climate, where the temperatures can reach up to 25◦C in the summer in the interior
conti-nental areas (e.g. Yellowknife, NWT) to below−40◦C in
the winter throughout most of the area. Mean annual tem-peratures range from 4◦C in the coastal areas of Alaska, to
Fig. 1. Canada with provincial and territorial boundaries and the
state of Alaska (USA), highlighting the area above 58◦N used for this study. Also shown are areas of permafrost and glacier.
through most of the region range from 30–50 cm (higher in the mountains) with less than 30 cm in the western parts of the CAA.
Many mountainous areas are present in the study region: The Western Cordillera extending up the west coast through British Columbia and Alaska with the Alaska Range and the Brooks Range to the north; and the Arctic Cordillera span-ning most of the northern areas of the CAA. Across the in-terior plains and the northern parts of the Canadian Shield is the boreal forest while tundra extends to the north of the tree line.
Many large lakes (>400 km2)are situated north of 58◦N
(e.g. Nettelling Lake, Amadjuak Lake, Baker Lake) as well as the Northern Great Lakes (Great Bear Lake and Great Slave Lake). Lakes in the northern boreal and tundra areas are numerous, with an estimated coverage in the Arctic and Subarctic regions of North America reaching up to 15–40 % depending on the location (Duguay et al., 2003).
2.2 Lake ice model
The model used is the Canadian Lake Ice Model (CLIMo), a one-dimensional thermodynamic model used for freshwa-ter ice cover studies (e.g. M´enard et al., 2002; Duguay et al., 2003; Jeffries et al., 2005, Morris et al., 2005) capa-ble of simulating ice on and off, thickness and composi-tion of the ice cover (clear or snow ice). CLIMo has been shown to perform very well at simulating lake ice phenol-ogy when using input data that well represents the climate for the lake, for example from nearby meteorological tow-ers (Duguay et al., 2003; Jeffries et al., 2005; Brown and Duguay, 2011). CLIMo has been modified from the one-dimensional sea ice model of Flato and Brown (1996), which was based on the one-dimensional unsteady heat conduction
equation, with penetrating solar radiation, of Maykut and Untersteiner (1971), i.e.
ρCp ∂T
∂t =
∂ ∂zk
∂T
∂z +FswIo(1−α)Ke −kz
(1) whereρ(kg m−3)is the density,Cp(J kg−1K−1)is the
spe-cific heat capacity,T (K) is the temperature,t(s) is the time,
k(Wm−1K−1)is the thermal conductivity,z(m) is the verti-cal coordinate, positive downward,Fsw(Wm−2)is the
down-welling shortwave radiative energy flux,Io (Wm−2)is the
fraction of shortwave radiation flux that penetrates the sur-face, α is the surface albedo, and K is the bulk extinction coefficient for penetrating shortwave radiation.
From this, the surface energy budget can then be calcu-lated:
Fo=Flw−εσ T4(0,t )+(1−α)(1−Io)Fsw+Flat+Fsens(2)
whereFo (Wm−2)is the net downward heat flux absorbed
at the surface, ε is the surface emissivity, σ is the Stefan– Boltzmann constant (5.67×10⁻⁸Wm−2K−4),Flw(Wm−2)
is the downwelling longwave radiative energy flux, Flat
(Wm−2)is the downward latent heat flux, andFsens(Wm−2)
is the downward sensible heat flux (M´enard et al., 2002, Jef-fries et al., 2005).
CLIMo includes a fixed-depth mixed layer in order to rep-resent an annual cycle. When ice is prep-resent, the mixed layer is fixed at the freezing point and when ice is absent, the mixed layer temperature is computed from the surface energy bud-get and hence represents a measure of the heat storage in the lake. The water column of shallow lakes is typically well-mixed and isothermal from top to bottom during the ice-free period, permitting the mixed layer depth to be a good approx-imation of the effect of lake depth leading to autumn freeze-up (Duguay et al., 2003). While warming lake temperatures from longer ice free seasons could alter the lake stratification (e.g. Kvambekk and Melvold, 2010; Mueller et al., 2009) an assumption was made that the mixed layer remained con-stant in the future simulations. In order to represent potential changes to the mixed layer a lake model such as the Fresh-water Lake model (FLake: Mironov, 2008) could be used to provide mixed layer information for CLIMo (Kheyrollah Pour et al., 2011).
The snow layer (if present) is represented as a single layer in CLIMo. While recent work has highlighted some advan-tages to multi-layer snow models (e.g. Chung et al., 2010 who coupled a snow model (SNTHRM) to a sea ice model) when provided realistic on-ice snow densities, CLIMo has been shown to simulate the on-ice snowpack depth and melt well compared to observations (Brown and Duguay, 2011). Snow ice is created by the model if there is a sufficient amount of snow to depress the ice surface below the water level. The added mass of the water filled snow pores (slush) is added to the ice thickness as snow ice.
Fig. 2. Locations of stations used for CRCM temperature
adjust-ment; 15 stations within Alaska and 47 stations within Canada.
(melting vs. frozen) and ice thickness, with no distinction regarding ice composition. A more detailed description of CLIMo can be found in Duguay et al. (2003).
2.3 Forcing data
CLIMo was driven by climate model output from the Cana-dian Regional Climate Model (CRCM 4.2.0) (45 km true at 60◦N) provided by Consortium Ouranos. CRCM is a limited-area model, originally developed at Universit´e du Qu´ebec `a Montr´eal (UQAM), driven at the boundaries by GCMs or reanalysis data. CRCM uses the Canadian LAnd Surface Scheme (CLASS 2.7; Verseghy, 1991; Verseghy et al., 1993) to describe the water and energy exchanges be-tween land surface and atmosphere (Music and Caya, 2007). For a detailed description of CRCM see Caya and Laprise (1999) and Laprise (2008).
Two CRCM scenarios were used, both spanning from 1961–2100, driven at the boundaries with the Canadian Global Climate Model (CGCM 3.1/T47 member 4 (scenario 1) and member 5 (scenario 2)) following the IPCC Special Report on Emission Scenarios A2 green-house-gas scenario, of continually increasing CO2emissions. The two scenarios
are the same except with a slight perturbation to the initial GCM conditions which allows the climate to evolve slightly differently, providing some insight into the interannual vari-ability in the climate simulations. CGCM data is produced by the Canadian Centre for Modelling and Analysis (CCCma). Daily data from each scenario consisted of 2 m screen tem-perature, humidity (specific humidity converted to relative humidity using a calculated saturated vapour pressure as a function of temperature (Beljaars et al., 1989) and a fixed air pressure of 1015 mb), wind speed, water equivalent of snow, snow density and cloud cover amounts.
A temperature bias has been previously identified in the CRCM data (Plummer et al., 2006; Gagnon et al., 2009) and was an average of 4◦C below the observed station temper-atures, varying seasonally up to 14◦C too cold during the spring in some areas. The use of reanalysis data (e.g.
NCEP-NCAR, ECMWF) is limited in this region as previous stud-ies have found these data sets to have cold biases as a result of the large grid cells representing the glaciated and moun-tainous areas more-so than the channels between the islands (Sou and Flato, 2009) and hence not representative of the low-lying or coastal areas where lakes would more likely be situated. Instead, a bias correction was done using tempera-ture data from the Adjusted and Homogenized Canadian Cli-mate Data (AHCCD) available from Environment Canada, which is a database of homogenized and long-term tempera-ture time series specifically designed for climate change anal-ysis over Canada (Vincent and Gullet,1999; Vincent, 1998; Vincent et al., 2002). 47 stations were available across the Canadian north and an additional 15 weather stations from Alaska were added for the bias correction (Fig. 2). While this method of bias correction is adequate for the majority of the study area, correcting the large bias in the mountain-ous Ellesmere Island areas using coastal station data (Alert) could potentially introduce a warm bias over the glaciated mountains. Conversely, since this study aims to examine changes in the lake ice cover, the adjusted temperature data would be suitable to represent the areas where lakes would be more likely to be situated (e.g. lowland areas, valleys, rather than in high altitude glaciated areas). The mean monthly bias was determined from the 1961–1990 data and then adjusted accordingly. Snow amounts from the CRCM scenarios were compared to station data (see Sect. 3.1) and were found to be suitably comparable. Other variables play a lesser role in the model and no bias correction was undertaken. An as-sumption was made that the bias present from 1961–1990 is consistent into the future.
2.4 In situ data
" " " " "" " " " " " " " " " """ 1 3 13 12 10 11 9 8 7 6 5 4 2
1. Watson Lake
2. Unnamed Lake (Sachs Harbour) 3. Unnamed Lake (Mould Bay) 4. Module Lake
5. Back Bay, Great Slave Lake 6. Charlton Bay, Great Slave Lake 7. Lake Athabasca
8. Beaverlodge Lake
9. Ennadai Lake 10. Farnworth Lake 11. Baker Lake 12. Resolute Lake 13. Upper Dumbell Lake 14. Fenor Lake 15. Dewar Lakes
14 15
Fig. 3. Lakes used as validation sites for the model simulations.
Squares represent the lakes used for ice phenology validation, trian-gles represent the lakes where snow depth on ice and ice thickness data was also available.
and Braaten, 1998). Snow density was obtained as a sea-sonal average from bi-weekly gridded snow density nor-mals, created from snow course data and interpolated to a 200 km grid (MSC, 2000). Six of the selected valida-tion sites had on-ice snow depths measurements recorded by the Canadian Ice Service (CIS) as part of the Canadian Ice Thickness Program (http://www.ec.gc.ca/glaces-ice/default. asp?lang=En\&n=E1B3129D-1). Ice thickness and snow depths are available for 195 Lake/River/Sea ice sites through-out Canada from 1947 to present, with varying completeness of years. Snow depths on the lake ice surface were compared with snow depths at the MSC stations and the corresponding CRCM tile in order to examine the effects of snow depth on the ice cover simulations.
Table 1 provides a summary of the available observation data from the validation lakes, along with the years of able meteorological data and on-ice snow depths where avail-able. A statistical comparison was done for the validation results using the Mean Bias Error (MBE) or Absolute Error (AE).
2.5 Simulations
In order to account for redistribution of snow across the ice surface, simulations for the North American Arctic were run using the CRCM data with both a full snow cover and no snow cover (see Sect. 3.1 for details). Three sets of simu-lations were run with respect to mixing depth: 3 m (to rep-resent shallow lakes, e.g. in the North Slope area of Alaska; the Hudson Bay Lowlands), 10 m (to represent medium deep lakes, near-shore areas where observations would be taken on
larger lakes, or lakes of unknown depth following Samuels-son et al., 2010) and 30 m (to represent large, deep lakes).
While the pan-arctic simulations were run with two pos-sible snow covers (full snow cover or no snow cover), the validation lakes were each simulated separately in order to obtain the best representation possible. The percentage of snow-on-ice to snow-on-land was determined when possible from the CIS data, or was estimated based on best fit to obser-vations when no measurements were available. To compare how well the CRCM data performed for the in situ lakes, the CRCM snow data was adjusted in the same manner for the tiles over each validation lake and additional simulations were run.
3 Results
3.1 Comparison of snow cover on the lakes
Realistic representation of snow cover on a lake ice sur-face is important for accurate simulation of ice evolution (Brown and Duguay, 2011) because of snow’s important in-sulating role and contribution to snow ice growth. Redistri-bution of the snow across the lake ice surface can result in a non-uniform snow cover, typically less than what would be measured nearby on-land. For example, in northern Alaska, the ratio of snow-on-ice over the lakes to snow-on-land was found to be and average of 56 % (Sturm and Liston, 2003). In order to represent the range of potential snow conditions on the lake ice surface, simulations are run with a “full snow cover” to represent 100 % of the snowfall accumulating on the ice, as well as a “no snow cover” simulation to represent the opposite conditions. Table 2 presents the comparison of the snow cover between the CRCM data sets with respect to the measured snow at the MSC stations nearest to the lakes where on-ice snow measurements were available. Although it is not advised to compare a CRCM tile with a weather sta-tion (Gagnon et al., 2009) an assessment of the amounts of snow in each data set is important to determine the ability of the CRCM tile to represent the snow cover of the lakes within it.
Table 1. Summary of the lake ice observation data, corresponding climate station and the years used.
Lake Observations Nearby Climate Years Years of ice Years of
(CID) Station (MSC) observations Snow Depth
Break-up/ on ice Freeze-up
Watson Lake Watson Lake 1961–1990 28/25 Unnamed Lake Sachs Harbour 1961–1986 18/18 Unnamed Lake Mould Bay 1961–1990 18/21 Module Lake Kugluktuk 1980–1990 7/9
Back Bay Yellowknife 1961–1990 28/27 1961–1990
Charlton Bay Fort Reliance 1961–1990 26/29 1961–1990 Lake Athabasca Fort Chipewyan 1968–1990 20/17 1962–1990 Beaverlodge Lake Uranium City 1963–1982 20/16
Ennadai Lake Ennadai Lake 1961–1979 19/19 1961–1979 Farnworth Lake Churchill 1961–1990 22/22
Baker Lake Baker Lake 1961–1990 29/29 1961–1990 Resolute Lake Resolute 1961–1990 10/18
Upper Dumbell Lake Alert 1961–1990 3/24 1961–1990 Fenor Lake Hall Beach 1961–1990 4/6
Dewar Lakes Dewar Lakes 1961–1990 21/23
Table 2. Ratio of snow depths measured on-ice and snow depth from the CRCM data with respect to the amounts measured at the MSC
weather stations.
Lake (MSC Station) Ratio of on-ice snow Ratio of CRCM depth to MSC station snow depth to
nearest MSC station
S 1 S 2
Back Bay, GSL (Yellowknife) 0.68 0.89 1.04
Charlton Bay, GSL (Fort Reliance) 0.48 0.80 0.88 Lake Athabasca (Fort Chipewyan) 0.41 0.83 0.83
Ennadai Lake 0.67 1.21 1.22
Baker Lake 0.09 0.85 0.81
Upper Dumbell Lake 0.82 2.34 2.35
3.2 Ice cover during 1961–1990 climate
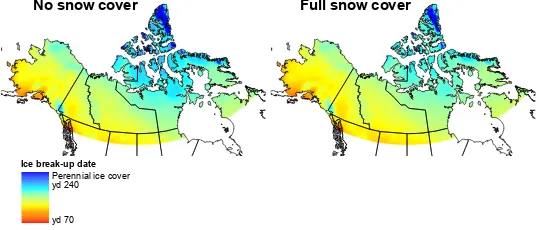
The two CRCM scenarios are similar for the contemporary climate years (1961–1990). The similar input data results in similar simulated ice cover patterns with the primary differ-ence between them occurring in the areas predicted to have perennial ice cover. The ice cover figures produced for the 1961–1990 climate use scenario 1 and are meant to repre-sent hypothetical lakes at the given depths (3, 10 and 30 m), since many different lakes sizes and shape could exist within a given grid cell.
3.2.1 Ice cover duration 1961–1990
No snow cover Full snow cover
Perennial ice cover
yd 70 Ice break-up date
yd 240
Fig. 4. Mean simulated break-up dates for 1961–1990 for hypothetical 10 m lakes, for both no snow and full snow scenarios.
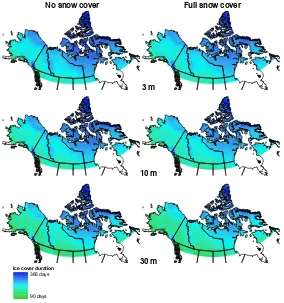
lake rather than the snow cover scenario (Fig. 5). Freeze-up ranges from September to December (yd 245–yd 358), with a mean freeze-up date for 3 m lakes of yd 281, 10 m lakes freezing an average of 11 days later (yd 292), and 30 m lakes freezing an average of a further 20 days after the 10 m lakes (yd 313). The resulting ice cover durations vary for both depth and snow cover, ranging from 90 to 365 days (Fig. 6), with the longest ice cover duration (ICD) on shallow free lakes (average of 255 days) and shortest for large snow-covered lakes (average 215 days).
In the far northern areas, break-up does not always occur on an annual basis resulting in occasional summer ice cover. All simulations encountered occasional summer ice cover on the lakes in the far northern areas, however only grid cells where no break-up occurred during the 30 year mean were designated as “perennial ice cover”. Perennial ice cover is simulated the same regardless of lake depth but is slightly different between the two climate scenarios. Scenario 1 pro-duces 40 grid cells (81 000 km2)where perennial ice is sim-ulated on snow-free lakes (versus 33 (66 825 km2)for sce-nario 2) and 19 grid cells (38 475 km2) for snow-covered lakes (versus 10 (20 250 km2)for scenario 2).
3.2.2 Ice cover thickness 1961–1990
Lake ice thickness is known to be influenced by snow cover on the ice (e.g. M´enard et al., 2003; Morris et al., 2005; Brown and Duguay, 2011) as shown in Fig. 7, with a sub-stantial difference between the thickness in snow-free ver-sus snow-covered lakes. Since CLIMo uses the mixing depth rather than absolute lake depth the areas where peren-nial ice cover occurs continue to thicken each year and are hence, capped at 3 m to avoid unrealistically thick ice. Both CRCM scenarios produce similar mean maximum ice thick-ness (MMT) (within 2 cm of each other) ranging from an average of 1.91 m to 2.03 m for the snow-free scenarios, and 1.44 m to 1.51 m for the snow-covered scenarios for all depths. The difference in MMT between the snow-free and snow-covered scenarios differs by depth, with an average of 58 cm thicker ice for snow free 3 m lakes, 53 cm thicker ice for snow free 10 m lakes and 42 cm thicker for snow free 30 m lakes.
10 m
30 m
Perennial ice cover yd 365
yd 200
3 m
Ice freeze-up date
Fig. 5. Mean freeze-up dates for 1961–1990 for the three depth
No snow cover Full snow cover
3 m
10 m
30 m 365 days
90 days Ice cover duration
Fig. 6. Mean ice cover duration for 1961–1990 for the three depth simulations, for both the no snow and full snow scenarios.
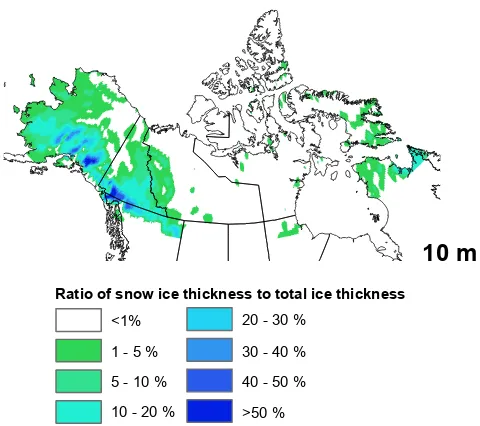
The composition of the ice (snow ice/clear ice) can af-fect the strength of the ice as well as the melt rates due to albedo differences between the snow versus clear ice. Fig-ure 8 shows the distribution of snow ice (as a ratio to total ice thickness), highlighting the areas where enough snowfall is received to depress the ice cover enough for snow ice to form. Cold temperatures and low snowfall amounts through most of the Arctic limit the amount of snow ice that forms, how-ever throughout the mountainous areas and northern Que-bec/southern Baffin Island some snow ice is simulated. 3.3 Validation of ice phenology and thickness
Validation of modelled ice phenology and thickness in North-ern Canada and Alaska presents challenges as the observa-tional network for lake ice is very sparse. Simulations us-ing CLIMo typically compare well to observation data when run using climate data that adequately represents the lake observed (i.e. nearby weather stations) (e.g., Duguay et al., 2003; Brown and Duguay, 2010; Jefferies et al., 2005). To examine how representative the CRCM simulations are com-pared to observations, simulation results from the containing CRCM tiles were compared to 15 locations that had both ob-servation data and MSC station data available. If CLIMo is not able to accurately capture the break-up/freeze-up dates using nearby MSC station data, then the same would be
No snow cover Full snow cover
3 m
10 m
30 m
3 m
0 m
Mean maximum ice thickness
Fig. 7. Mean maximum ice thickness for 1961–1990, for three depth simulations, and both the no snow and full snow scenarios. Ice thickness
capped at 3 m in areas where perennial ice cover growth continued due to the model structure of CLIMo.
10 m
<1%
>50 % 30 - 40 % 5 - 10 %
20 - 30 %
10 - 20 % 1 - 5 %
40 - 50 %
Ratio of snow ice thickness to total ice thickness
Fig. 8. Ratio of mean snow ice thickness to mean maximum ice
thickness for 1961–1990.
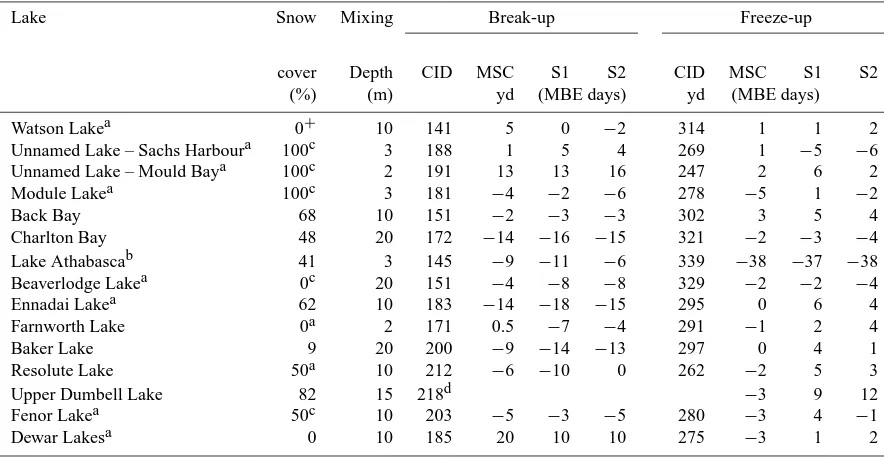
Table 3. Mean bias error (MBE) in break-up and freeze-up dates from simulations using Meteorological Service of Canada (MSC) data,
CRCM scenario 1 (S1) and scenario 2 (S2) for the validation sites along with the mean observed break-up and freeze-up from the Canadian Ice Database (CID) (dates as indicated in Table 1).
Lake Snow Mixing Break-up Freeze-up
cover Depth CID MSC S1 S2 CID MSC S1 S2
(%) (m) yd (MBE days) yd (MBE days)
Watson Lakea 0+ 10 141 5 0 −2 314 1 1 2
Unnamed Lake – Sachs Harboura 100c 3 188 1 5 4 269 1 −5 −6
Unnamed Lake – Mould Baya 100c 2 191 13 13 16 247 2 6 2
Module Lakea 100c 3 181 −4 −2 −6 278 −5 1 −2
Back Bay 68 10 151 −2 −3 −3 302 3 5 4
Charlton Bay 48 20 172 −14 −16 −15 321 −2 −3 −4
Lake Athabascab 41 3 145 −9 −11 −6 339 −38 −37 −38
Beaverlodge Lakea 0c 20 151 −4 −8 −8 329 −2 −2 −4
Ennadai Lakea 62 10 183 −14 −18 −15 295 0 6 4
Farnworth Lake 0a 2 171 0.5 −7 −4 291 −1 2 4
Baker Lake 9 20 200 −9 −14 −13 297 0 4 1
Resolute Lake 50a 10 212 −6 −10 0 262 −2 5 3
Upper Dumbell Lake 82 15 218d −3 9 12
Fenor Lakea 50c 10 203 −5 −3 −5 280 −3 4 −1
Dewar Lakesa 0 10 185 20 10 10 275 −3 1 2
aAssumed mixing depth based on most suitable fit to observations when lake depth was not available.bFreeze up simulated poorly due to hydrological factors not captured by the
1-dimensional model.cSnow cover percentage estimated based on best fit to observations when on ice snow depth measurements not available.dOnly 3 break-up observations available.
resulted in freeze-up being captured within 3 days of obser-vations, CRCM simulations for scenario 1 and 2 were both over a week late.
Overall, the absolute error compared to observations for all fifteen lakes combined was 8 days for break-up and 6 days for freeze-up (4 days excluding Lake Athabasca), indicating that CLIMo produces satisfactory simulations for break/freeze-up using CRCM climate data.
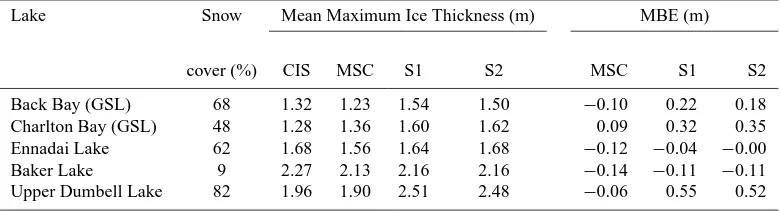
A comparison of mean maximum thickness (MMT) was possible at five of the validation lakes (Table 4). Simulating the ice thickness correctly is dependent on accurately repre-senting the snow cover depth and density on the lake ice sur-face where the measurements were taken. Also, since the in situ thickness measurements are generally taken weekly (but not always) there is a small possibility of missing the max-imum thickness during the sampling. For Back Bay (GSL) the MSC simulations had a MBE of 10 cm too thin, while the CRCM simulations here were 20 cm too thick. Ennadai Lake was also too thin with MSC (12 cm) however in this instance the CRCM simulations were closer to the obser-vations (<4 cm MBE). MMT was underestimated at Baker Lake as well with the MSC simulations 14 cm too thin, and the CRCM simulations 11 cm too thin. Break-up was not simulated well at Charlton Bay (GSL) so the likelihood of representing the thickness well here is reduced with all sim-ulations being too thick. The large discrepancy for the thick-ness of Upper Dumbell Lake for the CRCM simulations is
due to the snow cover being poorly represented here (MSC simulations captured the thickness well with a MBE of 6 cm). The average absolute error for the simulated MMT com-pared to observations is 10 cm for the MSC simulations and 25/23 cm for the CRCM simulations using the best estimate for snow cover amounts. Excluding Charlton Bay where the MSC simulations did not capture the observations well (and hence CRCM would not be expected to either), and Upper Dumbell Lake where snow cover amounts are inaccurate, the average absolute error for the remaining three lakes is within 12 cm of observations for both scenarios.
Snow ice measurements are not recorded in the histori-cal archives, however a study on Baffin Island near Iqaluit, Nunavut, found a 7 % ratio of snow ice to maximum ice thickness during the 2005–2006 winter (Dyck, 2007). The 1961-1990 mean ratio in this area was∼6 %.
3.4 Ice cover during future climate
Table 4. Mean bias error in mean maximum thickness for the validation sites along with the mean maximum thicknesses (dates as indicated
in Table 1).
Lake Snow Mean Maximum Ice Thickness (m) MBE (m)
cover (%) CIS MSC S1 S2 MSC S1 S2
Back Bay (GSL) 68 1.32 1.23 1.54 1.50 −0.10 0.22 0.18
Charlton Bay (GSL) 48 1.28 1.36 1.60 1.62 0.09 0.32 0.35
Ennadai Lake 62 1.68 1.56 1.64 1.68 −0.12 −0.04 −0.00
Baker Lake 9 2.27 2.13 2.16 2.16 −0.14 −0.11 −0.11
Upper Dumbell Lake 82 1.96 1.90 2.51 2.48 −0.06 0.55 0.52
DJF
MAM
JJA
DJF
MAM
JJA
0 1 2 3 4 5 6 7 8 9 10+
Temperature increase (ºC) from 1961-1990 to 2041-2070 SON
Scenario 1 Scenario 2
SON
Fig. 9a. Increase in air temperature from 1961–1990 mean to 2041–
2070 mean from the CRCM data displayed by season Winter (De-cember, January, February), Spring (March, Aprril, May), Summer (June, July, August) and Fall (September, October, November).
on the IPCC website (IPCC, 2007) suggest CGCM3 has a larger increase in surface air temperature (1980–1999 to 2046–2065) than the ensemble mean through the Gulf of Alaska region.
Although the two CRCM scenarios begin with similar con-ditions and both show warming throughout (Fig. 9a), by the 2041–2070 mean they have evolved different tempera-ture patterns. Temperatempera-tures in scenario 1 show the great-est change in the winter seasons (December, January, Febru-ary) ranging from 5–9◦C warmer over the land areas. Spring (March, April, May) shows an increase mainly in the 3–5◦C range; summer (June, July, August) only 1–3◦C, and fall (September, October, November) a 2–6◦C change. Tempera-tures in scenario 2 however are cooler and show less warming to 2041–2070. Winter in scenario 2 does not have warming in the Alaskan area seen in scenario 1, and the bulk of the NWT shows less warming in the spring. Summer is quite similar for both, while fall shows less warming in Alaska.
DJF
MAM
DJF
MAM
SON
Scenario 1 Scenario 2
SON
100 +10 +20 +30 +40 -10
-20 -30 -40
< -50 >+50
% change of snow water equivalent from 1961 - 1990 to 2041 - 2070
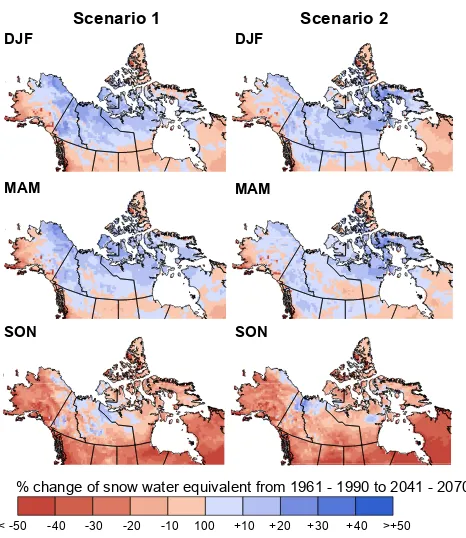
Fig. 9b. Change in snow water equivalent from 1961–1990 mean to
2041–2070 mean from the CRCM data displayed by season Winter (December, January, February), Spring (March, April, May) and Fall (September, October, November).
3.4.1 Ice cover duration 2041–2070
Comparing the mean break-up dates for 2041–2070 to the mean 1961–1990 dates show later break-up across the en-tire study area (Fig. 10a, b) with the exception of 1 small area on Baffin Island in the snow free scenario 1 simulation where the increased frequency of summer break-up resulted in a slightly earlier date. Break-up ranges from late February to mid-August (yd 51–yd 232) for all simulations, with the mean break-up date now yd 150 (151 for scenario 2) for full snow scenarios and 156 (157 for scenario 2) for no snow sce-narios – a shift of mean break-up date 7 days earlier for the snow scenario and 14 days earlier for no snow scenario. No perennial ice cover remains in scenario 2 and only 5 grid cells remain in scenario 1 for the no snow scenarios (compared to 19 and 40 for snow/no snow in 1961–1990). Although in most areas scenario 2 is cooler than scenario 1, the far north-ern parts of Ellesmere and Baffin Islands where the perennial ice was located, experience warmer temperatures than sce-nario 1 during the winter and spring, likely contributing to the differences in the perennial ice cover.
Comparing the results from the two future scenarios can provide some insight on the possible range of dates predicted by this CRCM scenario data (Fig. 10c). Examining the snow-free scenarios, the majority of the study area has mean 2041– 2070 break-up dates for both CRCM scenarios within 5 days
of each other. Scenario 2 is mainly 0–5 days later than sce-nario 1; not unexpected as slightly cooler temperatures per-sist in most areas of scenario 2. Only a few areas show a difference of more than 5 days between the scenarios, with a few smaller areas dispersed around the southern reaches of the study area showing 5–10 days later break-up. The north-western coastal and southern coastal areas of Alaska (and northern British Columbia) show 10–30 days earlier break up with scenario 2. The northern and eastern parts of the CAA show earlier break-up for scenario 2, again the result of warmer temperatures in this area. The areas with greater than 30 days differences in break-up dates on Ellesmere Is-land result from the lack of any remaining perennial ice cover in scenario 2. For the snow-covered scenarios, break-up for the two CRCM scenarios is still mainly within 5 days, with a larger portion of the study area shifting to 0–5 days earlier break-up, particularly in the north eastern areas.
Freeze-up for 2041–2070 now ranges from late August un-til the end of December (yd 240–yd 365 for scenario1 and yd 245–yd 364 for scenario 2), with mean freeze-up dates the same for both scenarios: 289 (3 m), 301(10 m) and 325 (30 m). Mean freeze-up dates show a shift of 6–11 days later than those from 1961–1990, less of a change than break-up. Figure 11a and b present the changes in freeze-up dates from 1961–1990 to 2041–2070. Scenario 1 has the greatest changes for freeze-up in Alaska and the High Arctic while scenario 2 has the greatest changes in the High Arctic and eastern areas (Baffin Island and northern Quebec). The areas with greater than 40 days change in freeze-up on Ellesmere Island are the areas where the perennial ice cover changed to seasonal ice cover. There are more pronounced differences between the scenarios for freeze-up than break-up (Fig. 11c). The central section of the study area is still±5 days between the scenarios, however northern Quebec and Baffin Island show 5–20 days later up with scenario 2, while freeze-up in Alaska is 5–10 days earlier with some section in the shallower lakes>10days earlier (not shown).
The changes in ICD from 1961–1990 to 2041–2070 are presented in Fig. 12a and b. Scenario 1 shows a change in ICD ranging from 10 to more than 40 days shorter by 2041–2070. The areas of the most change are the Alaska coast and the High Arctic islands (25 to >40 days shorter ICD); and northern Quebec (20–30 days shorter ICD). The ICD throughout the rest of the region is mainly 10–25 days shorter ICD and the effect of snow cover can also be seen in the simulations, with the snow-covered simulations produc-ing slightly less change in ICD than the snow-free simula-tions.
Change in mean break-up date (days earlier), 1961-1990 mean to 2041-2070 mean
40+ 0 - 5
5 - 10 10 - 15 15 - 20 20 - 25
25 - 30 30 - 35
35 - 40 later break-up
No snow cover Full snow cover
3 m
10 m
30 m a) Scenario 1
Fig. 10a. Change in mean break-up date from 1961–1990 to 2041–2070 for (a) scenario 1; (b) scenario 2; (c) the difference between the
scenarios for the 2041–2070 mean break-up dates.
focusing over the Arctic islands as well as northern Quebec and southern Baffin Island rather than the Alaskan coast (as seen in scenario 1). Similar to break-up and freeze-up, the ICD differences for the two CRCM scenarios (Fig. 12c) is mainly±5 days, with more areas in the 5-10 day differences from the combined effect of break-up and freeze-up differ-ences.
Both future scenarios show a loss of perennial ice cover as well as large reductions to the area where occasional sum-mer ice cover is predicted to occur (Fig. 13). There is a larger reduction of grid cells where occasional summer ice occurs with the no-snow scenarios than with snow. How-ever, a smaller area remains with occasional summer ice when snow is taken into account, reflecting the insulating ef-fects of the snow, leading to thinner ice, leading to fewer summers where any ice persists in the lakes. Using the 10 m hypothetical lakes as an example, a reduction of 192 grid cells where perennial or occasional ice would occur (38 8800 km2)was seen with no-snow and reduction of 91 grid cells (184 275 km2) was seen with snow. Also, while scenario 2 begins with slightly more occasional summer ice, due to the greater warming in the high latitude areas by the 2041–2070 mean in this scenario, a greater reduction in the summer ice cover is seen.
3.4.2 Ice cover thickness 2041–2070
Change in mean break-up date (days earlier), 1961-1990 mean to 2041-2070 mean
40+ 0 - 5
5 - 10 10 - 15 15 - 20 20 - 25
25 - 30 30 - 35
35 - 40 later break-up
No snow cover Full snow cover
3 m
10 m
30 m b) Scenario 2
Fig. 10b. Continued.
No snow cover
10 m c) Scenario differences
Difference between the two CRCM scenario simulation results for break-up (Scenario 2 relative to Scenario 1)
0 - 5
> 30 10 - 30 5 - 10 0 - 5
> 30 10 - 30 5 - 10 Days earlier Days later
Fig. 10c. Continued.
10–30 cm, except for some areas of the CAA and northern Quebec/southern Baffin Island where this increases to 30– 40 cm.
Comparing the two scenarios (Fig. 14c), most of the area has less than 10 cm difference between them, with the ex-ception of the northern western Alaskan coastal areas in the
Change in mean freeze-up date (days later), 1961-1990 mean to 2041-2070 mean
No snow cover Full snow cover
3 m
10 m
30 m a) Scenario 1
40+ 0 - 5
5 - 10 10 - 15 15 - 20
20 - 25 25 - 30 30 - 35 35 - 40
earlier freeze-up
Fig. 11a. Change in mean freeze-up date from 1961-1990 to 2041-2070 for (a) scenario 1; (b) scenario 2; (c) the difference between the
scenarios for the 2041–2070 mean freeze -up dates.
Mean maximum thickness amounts include both snow ice and black ice in the total amounts. Looking at the changes in to the snow ratio ice from 1961–1990 to 2041–2070 most of the study area experiences some increase, though in the central regions this increase is less than 1 % (Fig. 15). Also, with the shallower lakes, increased snow ice ratios are seen around Hudson Bay and up into the High Arctic that are not evident with the deeper 30 m lakes. Areas of decreased snow ice ratio are along the warmer coastal areas of Alaska (and a small area of northern Quebec/Labrador), corresponding to areas of decreased SWE (Fig. 9b) where increased amounts of precipitation would be expected to fall as rain rather than snow, reducing the chance for snow to accumulate on the ice surface to form snow ice.
4 Summary and conclusions
Ice phenology simulations using the lake ice model CLIMo driven by climate model output from CRCM scenarios for 1961–1990 had an average absolute error of less than 1 week compared to observation data at 15 validation sites across northern Canada. For three validation lakes where CLIMo
was able to represent the phenology well, the mean maxi-mum ice thickness had an average absolute error of 12 cm (6.5 %) compared to the measured ice thickness. Capturing the correct ice thickness in the simulations depends on how well the snow cover on the ice surface is represented both in terms of depth and density.
Change in mean freeze-up date (days later), 1961-1990 mean to 2041-2070 mean
No snow cover Full snow cover
3 m
10 m
30 m b) Scenario 2
40+ 0 - 5
5 - 10 10 - 15 15 - 20
20 - 25 25 - 30 30 - 35 35 - 40
earlier freeze-up
Fig. 11b. Continued.
No snow cover Full snow cover
10 m c) Scenario differences
Difference between the two CRCM scenario simulation results for freeze-up (Scenario 2 relative to Scenario 1)
0 - 5
> 20 10 - 20 5 - 10 0 - 5
> 20 10 - 20 5 - 10 Days later Days earlier
No snow cover Full snow cover
3 m
10 m
30 m a) Scenario 1
Change in ice cover duration (days shorter), 1961-1990 mean to 2041-2070 mean
40+ 0 - 5
5 - 10 10 - 15 15 - 20 20 - 25
25 - 30 30 - 35
35 - 40 increased duration
Fig. 12a. Change in mean ice cover duration from 1961–1990 to 2041–2070 for (a) scenario 1; (b) scenario 2; (c) the difference between the
scenarios for the 2041–2070 mean ice cover duration.
No snow cover Full snow cover
3 m
10 m
30 m b) Scenario 2
Change in ice cover duration (days shorter), 1961-1990 mean to 2041-2070 mean
40+ 0 - 5
5 - 10 10 - 15 15 - 20 20 - 25
25 - 30 30 - 35
35 - 40 increased duration
No snow cover Full snow cover
10 m c) Scenario differences
Difference between the two CRCM scenario simulation results for ICD (Scenario 2 relative to Scenario 1)
0 - 5
> 20 10 - 20 5 - 10 0 - 5
> 20 10 - 20 5 - 10
Days shorter Days longer
Fig. 12c. Continued.
Fig. 13. Area of occasional summer ice (including perennial ice cover) and the change from 1961–1990 to 2041–2070. Scenario 1, 10 m
No snow cover Full snow cover
3 m
10 m
30 m a) Scenario 1
30 - 40 20 - 30
Change in mean maximum thickness (cm), 1961-1990 mean to 2041-2070 mean 0 - 10
10 - 20 excluded data > 40
Fig. 14a. Change in mean maximum thickness 1961–1990 to 2041–2070 for (a) scenario 1; (b) scenario 2; (c) the difference between the
scenarios for the 2041–2070 mean maximum thickness.
No snow cover Full snow cover
3 m
10 m
30 m b) Scenario 2
30 - 40 20 - 30
Change in mean maximum thickness (cm), 1961-1990 mean to 2041-2070 mean
0 - 10
10 - 20 excluded data
> 40
No snow cover Full snow cover
10 m c) Scenario difference
Difference between the two CRCM scenario simulation results for mean maximimum thickness (Scenario 2 relative to Scenario 1)
0 - 5
> 20 10 - 20 5 - 10 0 - 5
> 20 10 - 20 5 - 10 Thinner (cm) Thicker (cm)
excluded data
Fig. 14c. Continued.
3 m
10 m
30 m
Change in ratio of snow ice to mean maximum thickness,1961-1990 mean to 2041-2070 mean
> 5% decrease
1 - 5 % increase > 5% increase
<1 % change 1 - 5% decrease
Fig. 15. Change in snow ice thickness to total ice thickness from
1961–1990 to 2041–2070 mean.
section of the study area (the CAA and southern Baffin Is-land/northern Quebec). In the remainder of the study area (away from the areas of maximum change) the shallower lakes (3 and 10 m) show mainly 10–25 days shorter ICD (5–
25 days shorter for scenario 2), while the 30 m lakes show primarily 15–30 days shorter ICD (10–30 days shorter for scenario 2). The areas of maximum change identified in this study were more extreme than those in the results produced by Dibike et al. (2011) for reduction in ICD, however the spatial patterns in their results were most similar to scenario 1.
Both scenarios show a drastic reduction in the number of grid cells with perennial ice cover, with none remaining in scenario 2. The areas of occasional summer ice cover are also reduced, with greater losses when no snow cover is on the ice (though a smaller area remains when snow cover is taken into account).
Changes to the mean maximum thickness show an aver-age of 25 cm less ice for the snow simulations (21 cm less for scenario 2), and 32 cm (24 cm) less ice for the snow-free simulations. Overall, scenario 1 shows more reduction in ice thickness than scenario 2 with the maximum loss reaching over 40 cm in the Alaskan coast areas (scenario 1) and up to 40 cm reduction in the CAA and northern Quebec/southern Baffin Island (scenario 2). The ratio of snow ice to total max-imum ice thickness was also shown to increase throughout the study area, with the exception of the Alaskan coastal ar-eas, where a reduction in the SWE was also observed. Dibike et al. (2011) show the area with the thickness changes along the northern coast lines at the upper extent of their study area (up to 25 cm reduction), which is again, most comparable to the full snow simulations in scenario 1.
differences between the scenarios for freeze-up range up to
±16 days (the very large values ranging up to ∼100 days in the far north are due to the different amounts of peren-nial ice cover). Thickness typically varied less than 10 cm between the scenarios except for Alaska, where the snow free simulations were up to 20 cm different (snow covered up to 25 cm) in the same areas of maximum differences seen in ICD. The variations in these areas are a reflection of the different patterns of temperature change between the sce-narios by the time they evolve to 2041–2070. Scenario 1 shows the greatest warming over the Alaska region in the fall and winter, while scenario 2 has the greatest warming in the Quebec/Baffin region in the winter and the CAA in the fall. Higher temperatures throughout in the spring for scenario 1 would affect the break-up, and the warmer winter temper-atures would lead to less ice thickening and earlier spring break-up.
Changes to northern lakes as a result of a shorter ice cover season and thinner ice covers could lead to in an increase to the availability of under ice habitat, a prolonged productivity period (ACIA, 2005) and a change to the habitats and species from increased amounts of light and UV radiation reaching the water (e.g. Reist et al., 2006). Longer open water sea-sons will result in changes to the stratification and circulation patterns in the lakes (ACIA, 2005), and previously stratified perennially ice covered lakes that have changed to seasonally ice free will experience wind-driven mixing, changing the water column regime (Mueller et al., 2009). Longer open wa-ter seasons will also lead to increased evaporation from lakes, and while ponds in the High Arctic are drying out as the cli-mate warms (Smol and Douglas, 2007) the shrinking/drying of lakes and ponds will likely be mitigated in some areas by increases in precipitation (Duguay et al., 2009). A shortened ice covered season is also expected to have a detrimental ef-fect on the duration and stability of the winter ice roads in northern Canada and Alaska. By mid-century, Canada is pre-dicted to lose access to 13 % of the northern areas currently accessible via ice roads, while Alaska is predicted to lose ac-cess to 29 %, with most of the changes occurring in April and November (Stephenson et al., 2011).
Reanalysis data or climate model output specifically cre-ated for the arctic regions could be beneficial for future predictions. Alternatively, the use of model ensemble data for future ice cover simulations could be beneficial as the largest source of uncertainty can come from the section of the model used (e.g. Prudhomme and Davis, 2009). Downscal-ing projects to examine regional changes to the future climate are underway through programs such as CORDEX: (COor-dinated Regional climate Downscaling Experiment, regional climate change scenarios) and high resolution climate change scenarios are being studied at NARCCAP (North American Regional Climate Change Assessment Program) to better as-sess the uncertainties in the various model simulations.
The gridded phenology maps produced herein highlight the important effects that both snow cover and lake depth
have on lake ice regimes, and that snow cover tends to mit-igate the changes to the ice cover. As well, the use of the two scenarios suggests areas of the greatest uncertainty in the phenology and thickness changes, primarily the Alaska coastal areas, the eastern CAA and the Baffin Island/northern Quebec region.
Acknowledgements. This research was supported by a NSERC
postgraduate scholarship (CGS) to L. Brown and Discovery Grant to C. Duguay. The CRCM data was generated and supplied by Ouranos. We are indebted to Ross Brown (Environment Canada at OURANOS) for valuable advice throughout the project.
Edited by: S. Marshall
References
ACIA: Arctic Climate Impact Assessment: Cambridge University Press, New York, 1042 pp., 2005.
Anderson, W. L., Robertson, D. M., and Magnuson, J. J.: Evi-dence of climatic change and projected future change, Limnol. Oceanogr., 41, 815–821,1996.
Beljaars, A. C. M., Holtslag, A. A. M., and van Westrhenen, R. M.: Description of a software library for the calculation of sur-face fluxes. KNMI Technical Report; TR-112, Royal Netherlands Meteorological Institute (KNMI), Netherlands, 1989.
Beltaos, S., Prowse, T., Bonsal, B., MacKay, R., Romolo, L., Pietroniro, A., and Toth, B.: Climatic effects on ice-jam flooding of the Peace-Athabasca Delta, Hydrol. Process., 20, 4031–4050, doi:10.1002/hyp.6418, 2006.
Blenckner, T., Jarvinen, M., and Weyhenmeyer, G. A.: Atmospheric circulation and its impact on ice phenology in Scandinavia, Bo-real Environ. Res., 9,371–380, 2004.
Bonsal, B. R. and Kochtubajda, B.: An assessment of present and future climate in the Mackenzie Delta and the near-shore Beaufort Sea region of Canada, Int. J. Climatol. 29, 1780–1795, doi:10.1002/joc.1812, 2009.
Brown, L. C. and Duguay, C. R.: The response and role of ice cover in lake-climate interactions. Prog. Phys. Geog., 34, 671– 704, doi:10.1177/0309133310375653, 2010.
Brown, L. C. and Duguay, C. R.: A comparison of simulated and measured lake ice thickness using a Shallow Water Ice Profiler, Hydrol. Process., 25, 2932–2941, doi:10.1002/hyp.8087, 2011. Brown, R. D. and Braaten, R. O.: Spatial and temporal variability
of Canadian monthly snow depths, 1946–1995, Atmos. Ocean, 36, 37–45, 1998.
Brown, R. D. and Mote, P.: The response of Northern Hemisphere snow cover to a changing climate, J. Climate, 22, 2124–2145, 2009.
Brown, R., Derksen, C., and Wang, L.: A multi-data set analysis of variability and change in Arctic spring snow cover extent, 1967–2008, J. Geophys. Res., 115, D16111, doi:10.1029/2010JD013975, 2010.
Canadian Ice Thickness Program: available at: http://www.ec.gc. ca/glaces-ice/default.asp?lang=En\&n=E1B3129D-1, 2010. Caya, D. and Laprise, R.: A semi-Lagrangian semi-implicit
Chung, Y. C., Belair, S., and Mailhot, J.: Simulation of Snow on Arctic Sea Ice Using a Coupled Snow-Ice Model, J. Hydrome-teor., 11, 199–210, 2010.
Dibike, Y., Prowse, T., Bonsal, B., de Rham, L., and Saloranta, T.: Simulation of North American lake-ice cover characteristics un-der contemporary and future climate conditions, Int. J. Climatol., 31, doi:10.1002/joc.2300, 2011.
Douglas, M. S. V. and Smol, J. P.: Freshwater diatoms as indicators of environmental change in the High Arctic, in: The Diatoms: Applications for the Environmental and Earth Sciences, edited by: Stoermer, E. F. and Smol, J. P., Cambridge University Press, Cambridge, 227–244, 1999.
Duguay, C. R., Flato, G. M., Jeffries, M. O., M´enard, P., Morris, K., and Rouse, W. R.: Ice-cover variability on shallow lakes at high latitudes: model simulations and observations, Hydrol. Process., 17, 3465–3483, 2003.
Duguay, C. R., Prowse, T. D., Bonsal, B. R., Brown, R. D., Lacroix, M. P., and M´enard, P.: Recent trends in Canadian lake ice cover, Hydrol. Process., 20, 781–801, 2006.
Duguay, C. R., Pivot, F. C., Brown, R. D., and Flato, G. M.: Continental-scale simulation of lake ice cover phenology, thick-ness and composition in Canada. CMOS-CGU-AMS Congress. St. Johns, Newfoundland, Canada, May 28–June 1, 2007, Ab-stract ID: 1908, 2007.
Duguay, C. R., Macrae, M. L., Parrott, J. A., Brown, L. C., and Svacina, N.: Response of shallow lakes and ponds to contempo-rary climate change in the Hudson Bay Lowland near Churchill, Manitoba, American Geophysical Union Fall Meeting, San Fran-cisco, California, USA, December 14-18, 2009, C42A-03, 2009. Dyck, M. G.: Community monitoring of environmental change: College-based limnological studies at Crazy Lake (Tasirluk), Nunavut, Arctic, 60, 55–61, 2007.
Flato, G. M. and Brown, R. D.: Variability and climate sensitivity of landfast Arctic sea ice, J. Geophys. Res., 101, 25767–25777, 1996.
Gao, S. and Stefan, H. G.: Potential climate change effects on ice covers of five freshwater lakes, J. Hydrol. Eng., 9, 226–234, 2004.
Gagnon, P., Konan, B., Rousseau, A. N., and Slivitzky, M.: Hy-drometeorological validation of a Canadian Regional Climate Model simulation within the Chaudi`ere and Chˆateauguay water-sheds (Qu´ebec, Canada), Can. J. Civ. Eng., 36, 253–266, 2009. Hinzman, L. D., Bettez, N. D., Bolton, W. R., Chapin, F. S.,
Dyurg-erov, M. B., Fastie, C. L., Griffith, B., Hollister, R. D., Hope, A., Huntington, H. P., Jensen, A. M., Jia, G. J., Jorgenson, T., Kane, D. L., Klein, D. R., Kofinas, G., Lynch, A. H., Lloyd, A. H., McGuire, A. D., Nelson, F. E., Oechel, W. C., Osterkamp, T. E., Racine, C. H., Romanovsky, V. E., Stone, R. S., Stow, D. A., Sturm, M., Tweedie, C. E., Vourlitis, G. L., Walker, M. D., Walker, D. A., Webber, P. J., Welker, J. M., Winker, K. S., and Yoshikawa, K.: Evidence and implications of recent cli-mate change in northern Alaska and other Arctic regions, Clim. Change, 72, 251–298, 2005.
Holland, M. M., Bitz, C. M., and Tremblay, B: Future abrupt re-ductions in the summer Arctic sea ice, Geophys. Res. Lett., 33, L23503, doi:10.1029/2006GL028024, 2006
IPCC, 2007. Chapter 10 supplementary figures: http://www. ipcc.ch/publications and data/ar4/wg1/en/en/chapter10/Ch10 indiv-maps.html, 2011.
Jeffries, M. O., Morris, K., and Duguay, C. R.: Lake ice growth and decay in central Alaska, USA: observations and computer simulations compared, Ann. Glaciol., 40, 1–5, 2005.
Jensen, O. P., Benson, B. J., Magnuson, J. J., Card, V. M., Futter, M. N., and Soranno, P. A.: Spatial analysis of ice phenology trends across the Laurentian Great Lakes region during a recent warming period, Limnol. Oceanogr., 52, 2013–2026, 2007. Johnson, S. L. and Stefan, H. G.: Indicators of climate warming
in Minnesota: Lake ice covers and snowmelt run off, Climatic Change, 75, 421–453, 2006.
Kaufman, D. S., Schneider, D. P., McKay, N. P., Ammann, C. M., Bradley, R. S., Briffa, K. R., Miller, G. H., Otto-Bliesner, B. L., Overpeck, J. T., and Vinther, B. M.: Arctic Lakes 2k Project Members: Recent Warming Reverses Long-Term Arctic Cool-ing, Science, 325, 1236, doi:10.1126/science.1173983, 2009. Keatley, B. E., Douglas, M. S. V., and Smol, J. P.: Prolonged ice
cover dampens diatom community response to recent change in high arctic lakes, Arct. Antarct. Alp. Res., 40, 364–372, 2008. Kheyrollah Pour, H., Duguay, C. R. , Martynov, A., and Brown,
L. C.,: Simulation of surface temperature and ice cover of large northern lakes with 1-D models: A comparison with MODIS satellite data and in situ measurements, Tellus Series A: Dynamic Meteorology and Oceanography, in review, 2011.
Korhonen, J.: Long-term changes in lake ice cover in Finland, Nord. Hydrol., 4–5, 347–363, 2006.
Kvambekk, A. S. and Melvold, K.: Long-term trends in water tem-perature and ice cover in the subalpine lake, Øvre Heimdals-vatn, and nearby lakes and rivers, Hydrobiologia, 642, 47–60, doi:10.1007/s10750-010-0158-2, 2010.
Laprise, R.: Regional climate modeling, J. Comput. Phys., 227, 3641–3666, 2008.
Latifovic, R. and Pouliot, D.: Analysis of climate change impacts on lake ice phenology in Canada using the historical satellite data record, Remote Sens. Environ., 106, 492–507, 2007.
Lenormand, F., Duguay, C. R., and Gauthier, R.: Development of a historical ice database for the study of climate change in Canada, Hydrol. Process., 16, 3707–3722, 2002.
Livingstone, D. M. and Adrian R.: Modeling the duration of inter-mittent ice cover on a lake for climate change studies, Limnol. Oceanogr., 54, 1709–1722, 2009.
Magnuson, J. J., Robertson, D. M., Benson, B. J., Wynne, R. H., Livingstone, D. M., Arai, T., Assel, R. A., Barry, R. G., Virginia Card, V., Kuusisto, E., Granin, N. G., Prowse, T. D., Stewart, K. M., and Vuglinski, V. S.: Historical trends in lake and river ice cover in the Northern Hemisphere, Science, 289, 1743–1746, 2000, errata, Science, 291, 254, 2001.
Maykut, G. A. and Untersteiner, N.: Some results form a time-dependant thermodynamic model of sea ice, J. Geophys. Res., 76, 1550-1-575, 1971.
MSC: Canadian Snow Data CD-ROM, CRYSYS Project, Climate Processes and Earth Observation Division, Meteorological Ser-vice of Canada, Downsview, Ontario, January, 2000.
M´enard, P., Duguay, C. R., Flato, G. M., and Rouse, W. R.: Simula-tion of ice phenology on Great Slave Lake, Northwest Territories, Canada, Hydrol. Process., 16, 3691–3706, 2002.
M´enard, P., Duguay, C. R., Pivot, F. C., Flato, G. M., and Rouse, W. R.: Sensitivity of Great Slave Lake ice cover to climate variabil-ity and climatic change, in: Proceedings of the 16th International Symposium on Ice, Dunedin, New Zealand, 2–6 December 2002, Volume 3, 57–63, 2003.
Mironov, D.: Parameterization of lakes in numerical weather pre-diction, Part 1: Description of a lake model, Offenbach: Consor-tium for Small-scale Modeling, Technical Report 11, Deutscher Wetterdienst, Offenbach am Main, Germany, 41 pp., 2008. Music, B. and Caya, D.: Evaluation of the Hydrological Cycle over
the Mississippi River Basin as Simulated by the Canadian Re-gional Climate Model (CRCM), J. Hydrometeorol., 8, 969–988, 2007.
Mueller, D. R., Van Hove, P., Antoniades, D., Jeffries, M. O., and Vincent, W. F.: High Arctic lakes as sentinel ecosystems: Cas-cading regime shifts in climate, ice cover, and mixing, Limnol. Oceanogr., 54, 2371–2385, 2009.
Morris, K., Jeffries, M., and Duguay, C.: Model simulation of the effects of climate variability and change on lake ice in central Alaska, USA, Ann. Glaciol., 40, 113–118, 2005.
North American Regional Climate Change Assessment Pro-gram: http://www.narccap.ucar.edu/results/crcm-cgcm3-results. html, 2011.
Palecki, M. A. and Barry, R. G.: Freeze-up and break-up of lakes as an index of temperature changes during the transition seasons: a case study for Finland, J. Appl Meteorol., 25, 893–902, 1986. Peters, D. L. and Buttle, J. M.: The effects of flow regulation
and climatic variability on obstructed drainage and reverse flow contribution in a northern river-lake-delta complex, Mackenzie Basin headwaters, River Res. Applic., 26, 1065–1089, 2010. Plummer, D. A., Caya, D., Frigon, A., Cˆot´e, H., Gigu`ere, M.,
Paquin, D., Biner, S., Harvey, R., and De Elia, R.: Climate and climate change over North America as simulated by the Canadian RCM, J. Climate, 19, 3112–3132, 2006.
Pohl, S., Marsh, P., and Bonsal, B. R.: Modeling the Impact of Cli-mate Change on Runoff and Annual Water Balance of an Arctic Headwater Basin, Arctic, 60, 173–186, 2007.
Prowse, T. D. and Beltaos, S.: Climatic control of river-ice hydrol-ogy: a review, Hydrol. Process., 16, 805–822, 2002.
Prowse, T. D., Bonsal, B. R., Duguay, C. R., and Lacroix, M. P.: River-ice break-up/freeze-up: a review of climatic drivers, his-torical trends and future predictions, Ann. Glaciol., 46, 443–451, 2007.
Prudhomme, C. and Davies, H.: Assessing uncertainties in climate change impact analyses on the river flow regimes in the UK, Part 2: future climate, Climatic Change, 93, 197–222, 2009. R¨ais¨anen, J.: Warmer climate: less or more snow?, Clim. Dynam.,
30, 307–319, doi:10.1007/s00382-007-0289-y, 2007.
Reist, J. D., Wrona, F. J., Prowse, T. D., Dempson, J. B., Power, M., K¨ock, G., Carmichael, T. J., Sawatzky, C. D., Lehtonen, H., and Tallman, R. F.: Effects of Climate Change and UV Radiation on Fisheries for Arctic Freshwater and Anadromous Species, Am-bio, 35, 402–410, doi:10.1579/0044-7447, 2006.
Rouse, W. R., Binyamin, J., Blanken, P. D., Bussi`eres, N., Duguay, C. R., Oswald, C. J., Schertzer, W. M., and Spence, C.: The influence of lakes on the regional energy and water balance of the central Mackenzie, Chapter 18 in: Cold Region Atmospheric and Hydrologic Studies: The Mackenzie GEWEX Experience, Vol. 1, edited by: Woo, M. K., Springer-Verlag: Berlin, 309– 325, 2008.
Saloranta, T. M. and Anderson, T.: MyLake – A multi-year lake simulation model code suitable for uncertainty and sensitivity analysis simulations, Ecol. Model., 207, 45–60, 2007.
Samuelsson, P., Kourzeneva, E., and Mironov, D.: The impact of lakes on the European climate as simulated by a regional climate model, Boreal Environ. Res., 15, 113–129, 2010.
Smol, J. P.: Paleophycology of a High Arctic lake near Cape Her-schel, Ellesmere Island, Can. J. Botany, 61, 2195–2204, 1983. Smol, J. P.: Paleoclimate proxy data from freshwater, Arctic
di-atoms. Verh. Int. Ver. Theor. Angew. Limnol., 23, 837–844, 1988.
Smol, J. P. and Douglas, M. S. V.: Crossing the final ecological threshold in high Arctic ponds, P. Natl. Acad. Sci. USA, 104, 12395–12397, 2007.
Smol, J. P., Wolfe, A. P., Birks, H. H., Douglas, M. S. V., Jones, V., Korhola, A., Pienitz, R., R¨uhland, K., Sorvari, S., Antoniades, D., Brooks, S. J., Fallu, M. A., Hughes, M., Keatley, B. E., Laing, T. E., Michelutti, N., Nazarova, L., Nyman, M. Paterson, A. M., Perren, B., Quinlan, R., Rautio, M., Saulnier-Talbot, E., Susanna Siitonen, S., Solovieva, N., and Weckstr¨om, J.: Climate-driven regime shifts in the biological communities of Arctic lakes, P. Natl. Acad. Sci. USA, 102, 4397–4402, 2005.
Stephenson, S. R., Smith, L. C., and Agnew, J. A.: Divergent long-term trajectories of human access to the Arctic, Nature Climate Change, 1, 156–160, doi:10.1038/NCLIMATE1120, 2011. Sturm, M. and Liston, G. E.: The snow cover on lakes of the Arctic
Coastal Plain of Alaska, USA, J. Glaciol., 49, 370–380, 2003. Sturm, M., Holmgren, J., K¨onig, M., and Morris, K.: The thermal
conductivity of seasonal snow, J. Glaciol., 43, 26–41, 1997. Sou, T. and Flato, G.: Sea Ice in the Canadian Arctic Archipelago:
Modeling the Past (1950–2004) and the Future (2041–60), J. Cli-mate., 22, 2181–2198, 2009.
Thorne, R.: Uncertainty in the impacts of projected climate change on the hydrology of a subarctic environment: Liard River Basin, Hydrol. Earth Syst. Sci., 15, 1483–1492, doi:10.5194/hess-15-1483-2011, 2011.
Tomkins, J. D., Lamoureux, S. F., Antoniades, D., and Vincent, W. F.: Sedimentary pellets as an ice-cover proxy in a High Arctic ice-covered lake, J. Paleolimnol., 41, 225–242, 2009.
Vavrus, S. J., Wynne, R. H., and Foley, J. A.: Measuring the sen-sitivity of southern Wisconsin lake ice to climate variations and lake depth using a numerical model, Limnol. Oceanogr., 41, 822– 831, 1996.
Verseghy, D. L.: CLASS – A Canadian land surface scheme for GCMs. Part I: Soil model, Int. J. Climatol., 11, 111–133, 1991. Verseghy, D. L., McFarlane, N. A., and Lazare, M. CLASS – A
Canadian land surface scheme for GCMs. Part II: Vegetation model and coupled runs, Int. J. Climatol., 13, 347–370, 1993. Vincent, L. A.: A technique for the identification of
inhomo-geneities in Canadian temperature series, J. Climate, 11, 1094– 1104, 1998.
homogeneous temperature datasets for climate change analyses, Int. J. Climatol., 19, 1375–1388, 1999.
Vincent, L. A., Zhang, X., Bonsal, B. R., and Hogg, W. D.: Ho-mogenization of daily temperatures over Canada, J. Climate, 15, 1322–1334, 2002.
Walsh, S. E., Vavrus, S. J., Foley, J. A., Fisher, V. A., Wynne, R. H., and Lenters, J. D.: Global pattern of lake ice phenology and climate: Model simulation and observations, J. Geophys. Res., 103, 28825–28837, 1998.
Weyhenmeyer, G. A., Meili, M., and Livingstone, D. M.: Nonlinear temperature response of lake ice breakup, Geophys. Res. Lett., 31, L07203, doi:10.1029/2004GL019530, 2004.
Williams, G., Layman, K. L., and Stefan, H. G.: Dependence of lake ice covers on climatic, geographic and bathymetric vari-ables, Cold Reg. Sci. Technol., 40, 145–164, 2004.
Woo, M. K., Thorne, R., Szeto, K., and Yang, D.: Streamflow hydrology in the boreal region under the influences of climate and human interference, Phil. Trans. R. Soc. B, 363, 2251–2260, doi:10.1098/rstb.2007.2197, 2008.