Open Access
Research
Evaluating the protein coding potential of exonized transposable
element sequences
Jittima Piriyapongsa
1, Mark T Rutledge
1, Sanil Patel
1, Mark Borodovsky
1,2,3and I King Jordan*
1Address: 1School of Biology, Georgia Institute of Technology, Atlanta, GA 30332, USA., 2Wallace H. Coulter Department of Biomedical
Engineering, Georgia Institute of Technology and Emory University, Atlanta, GA 30332, USA. and 3Division of Computational Science and
Engineering at College of Computing, Georgia Institute of Technology, Atlanta, GA 30332, USA.
Email: Jittima Piriyapongsa - [email protected]; Mark T Rutledge - [email protected]; Sanil Patel - [email protected]; Mark Borodovsky - [email protected]; I King Jordan* - [email protected]
* Corresponding author
Abstract
Background: Transposable element (TE) sequences, once thought to be merely selfish or parasitic members of the genomic community, have been shown to contribute a wide variety of functional sequences to their host genomes. Analysis of complete genome sequences have turned up numerous cases where TE sequences have been incorporated as exons into mRNAs, and it is widely assumed that such 'exonized' TEs encode protein sequences. However, the extent to which TE-derived sequences actually encode proteins is unknown and a matter of some controversy. We have tried to address this outstanding issue from two perspectives: i-by evaluating ascertainment biases related to the search methods used to uncover TE-derived protein coding sequences (CDS) and ii-through a probabilistic codon-frequency based analysis of the protein coding potential of TE-derived exons.
Results: We compared the ability of three classes of sequence similarity search methods to detect TE-derived sequences among data sets of experimentally characterized proteins: 1-a profile-based hidden Markov model (HMM) approach, 2-BLAST methods and 3-RepeatMasker. Profile based methods are more sensitive and more selective than the other methods evaluated. However, the application of profile-based search methods to the detection of TE-derived sequences among well-curated experimentally characterized protein data sets did not turn up many more cases than had been previously detected and nowhere near as many cases as recent genome-wide searches have. We observed that the different search methods used were complementary in the sense that they yielded largely non-overlapping sets of hits and differed in their ability to recover known cases of TE-derived CDS. The probabilistic analysis of TE-derived exon sequences indicates that these sequences have low protein coding potential on average. In particular, non-autonomous TEs that do not encode protein sequences, such as Alu elements, are frequently exonized but unlikely to encode protein sequences.
Conclusion: The exaptation of the numerous TE sequences found in exons as bona fide protein coding sequences may prove to be far less common than has been suggested by the analysis of complete genomes. We hypothesize that many exonized TE sequences actually function as post-transcriptional regulators of gene expression, rather than coding sequences, which may act through a variety of double stranded RNA related regulatory pathways. Indeed, their relatively high copy numbers and similarity to sequences dispersed throughout the genome suggests that exonized TE sequences could serve as master regulators with a wide scope of regulatory influence.
Reviewers: This article was reviewed by Itai Yanai, Kateryna D. Makova, Melissa Wilson (nominated by Kateryna D. Makova) and Cedric Feschotte (nominated by John M. Logsdon Jr.).
Published: 26 November 2007
Biology Direct 2007, 2:31 doi:10.1186/1745-6150-2-31
Received: 26 October 2007 Accepted: 26 November 2007
This article is available from: http://www.biology-direct.com/content/2/1/31
© 2007 Piriyapongsa et al; licensee BioMed Central Ltd.
Background
Transposable elements (TEs) are DNA sequences capable of moving (transposing) among locations in the genomes of their host organisms. When TEs transpose they often replicate themselves and they can accumulate to very high copy numbers. For instance, at least 47% of the human genome is made up of TE-derived sequences [1]. For many years, TEs were thought to be genomic parasites that did not contribute functionally relevant sequences to the genomes in which they reside [2,3]. However, as of late it has become increasingly apparent that TEs can have pro-found effects on the structure, function and evolution of their host genomes [4-7].
One way that TEs have contributed to the function and evolution of their host genomes is through the donation of regulatory sequences that control the expression of nearby genes. This phenomenon was originally noticed through the elucidation of individual cases where host genes were found to be regulated by TE-derived sequences [8,9]. Later, genome-scale analyses confirmed that TE-derived sequences have contributed diverse and abundant regulatory sequences to host genomes [10,11].
TEs can also contribute to host genomes by providing pro-tein coding sequences. This process is initiated when a new or existing TE sequence becomes captured as an exon (exonized) in a host gene mRNA sequence. The exoniza-tion of TE sequences appears to be quite common in eukaryotic genomes. An early high-throughput analysis of the human transcriptome by Nekrutenko and Li revealed that 4% of human protein coding regions contained TE sequences [12]. However, the extent to which exonized TE
sequences actually contribute bona fide protein coding
sequences has been called into question. It is simply not clear whether the presence of a TE sequence in a spliced
exon, i.e. as part of an mRNA, indicates that it will
ulti-mately be translated into a functioning protein.
Two reports in particular have challenged the figure of 4% of human proteins with TE-derived coding sequences. In both of these studies, more conservative approaches to the identification of TE-derived protein coding sequences were taken. Specifically, these studies employed the anal-ysis of coding sequences taken exclusively from proteins that had been experimentally characterized, either through elucidation of their 3D structures or via direct peptide sequencing methods. Thus, only the best charac-terized protein coding sequences were studied and gene predictions, or models, based on the mapping of expressed sequences to genomes were not considered.
This approach was first taken by Pavlicek et al. who
sur-veyed a dataset of 781 non-redundant human proteins with 3D structures for the presence of TE-derived coding sequences [13]. They were not able to find a single reliable
case of a TE-derived protein coding sequence in these data. Considering these results together with the previous work of Nekrutenko and Li [12], the authors concluded that while many alternative transcripts may include TE sequences, these are rarely if ever incorporated into the mRNA sequences that are destined to be translated into
proteins. Pavlicek et al. found it particularly unlikely that
non-coding TEs, such as Alu elements, could evolve to encode proteins after being incorporated into host mRNAs.
Gotea and Makalowski conducted a similar, if further reaching, study by looking for TE-derived sequences in the coding regions of human proteins taken from the Protein Data Bank [14] (3,764) and from the SwissProt [15] col-lection of directly sequenced human peptides (1,765) [16]. Evaluation of these sequences with the RepeatMas-ker program [17] uncovered 24 cases of TE-derived pro-tein coding sequences. However, many of these had relatively low sequence similarity scores that were close the RepeatMasker threshold for false-positives. After fur-ther evaluation of these cases using a variety of compara-tive sequence analysis techniques, the authors settled on a figure of 0.1% for the percentage of actual protein coding sequences with TE-derived exons. Incidentally, this figure is in line with the initial analysis of the human genome sequence, which found 47 cases of human protein coding regions with TE-derived sequences, corresponding to ~0.16% of all human genes given the total human gene number count of ~30,000 used at that time [1].
While there can be little doubt that these two aforemen-tioned studies used appropriately conservative datasets to search for TE-derived protein coding sequences, it may also be the case that the primary detection methods they employed are insufficiently sensitive since they rely on DNA-DNA sequence comparisons. For instance, Repeat-Masker, which is the most widely used program for the detection of TE sequences, uses pairwise comparisons of genomic DNA sequences with DNA consensus sequences that represent TE families. Protein sequence based similar-ity searches are more sensitive than DNA based searches, and profile searches that take advantage of information on site-specific variation along protein domains are proven to be the most sensitive approach for detecting sequence homology [18-20].
sequence search method resulted in a more than two-fold increase, from 814 to 1,950, in the number of genes found to have TE-derived protein coding sequences [23]. An even more sensitive profile based search method was used
by Zdobnov et al. to search for TE-derived protein coding
sequences in four vertebrate genomes [24]. These authors compiled a set of known protein domains that are charac-teristic of TEs, and profiles of these domains were then used in hidden Markov model (HMM) searches of the protein sequences. This analysis resulted in the discovery of 1,000 vertebrate genes containing protein coding sequences that are related to TEs. However, neither the
Britten nor the Zdobnov et al. studies confined their
searches to experimentally characterized protein coding
sequences as did the studies of Pavlicek et al. and Gotea
and Makalowski, both of which resulted in far smaller estimates for the fraction of genes with TE-derived protein coding sequences.
Clearly, the extent to which TEs contribute protein coding sequences to vertebrate genomes is not a settled matter. Relatively insensitive searches of conservative data sets lead to low estimates for the fraction of TE-derived protein coding sequences, while more sensitive searches of less conservative data sets yield higher fractions. The aims of this study are i-to evaluate the ascertainment biases related to different sequence similarity search methods and ii-to try and better understand the potential of TEs to contribute protein coding sequences to vertebrate genomes. To these ends, we searched conservative, exper-imentally characterized, protein coding sequence data sets for TE-derived sequences using sensitive profile based search methods. We also compared the results of profile based search methods with more traditional pairwise
DNA and protein based search methods. Known cases of experimentally characterized proteins with TE-related sequences were used as positive controls to assess the sen-sitivity of the different sequence similarity search tech-niques. Finally, we used probabilistic gene prediction methods as well as an analysis of relative nucleotide (GC) frequencies across codon positions to evaluate the protein coding probability of TE-derived exon sequences.
Results and Discussion
Searching for TE-associated proteins
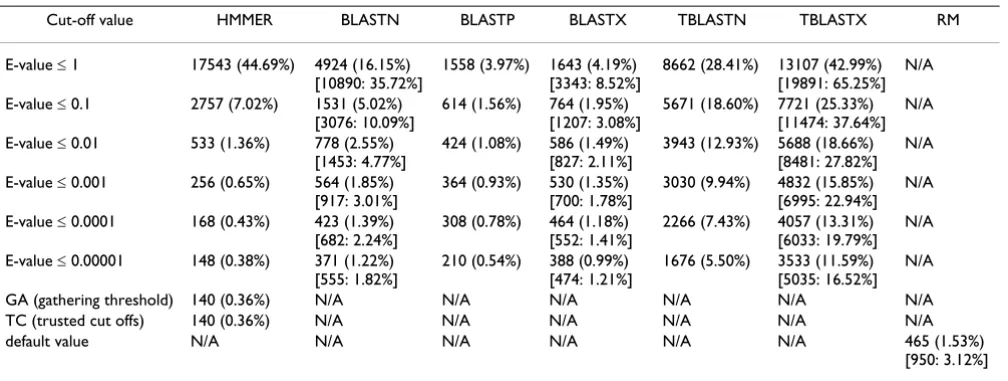
We used a number of approaches to detect molecular domestication events, specifically exaptation of host (cel-lular) CDS from TE sequences, by searching for the pres-ence of TE-related sequpres-ences in functionally well characterized host protein sequences and CDS. A total of 41,492 PDB entries and 21,050 Swiss-Prot directly sequenced proteins were taken to represent functionally well characterized proteins (genes) since they have been experimentally determined. Viral proteins were excluded from these data sets in order to avoid the overlap among protein domains shared between viral and retrotranspo-son-encoded proteins resulting in final data sets of 39,252 PDB and 20,732 Swiss-Prot entries. Using the combined automatic and manual search procedure described in the Methods section, we identified 124 TE-related Pfam pro-tein domains (See Additional file 1). We then searched for the presence of these TE-related domains among the experimentally characterized PDB and Swiss-Prot data sets using profile-based similarity search methods (HMM pro-files) as described in the Methods section. The numbers (percentages) of protein sequences found to possess TE-related domains, based on a series of increasingly strin-gent HMM search cut-off criteria, are shown in Table 1
Table 1: Detection of TE-encoded sequences in PDB proteins. The number of PDB entries found with TE protein fragments (from autonomous TEs) by different search programs is shown. The percentage of total PDB entries is shown in the parenthesis. The square bracket indicates the number and the percentage of protein entries associated with sequences derived from TEs including the non-autonomous ones.
Cut-off value HMMER BLASTN BLASTP BLASTX TBLASTN TBLASTX RM
E-value ≤ 1 17543 (44.69%) 4924 (16.15%) [10890: 35.72%]
1558 (3.97%) 1643 (4.19%) [3343: 8.52%]
8662 (28.41%) 13107 (42.99%) [19891: 65.25%]
N/A
E-value ≤ 0.1 2757 (7.02%) 1531 (5.02%) [3076: 10.09%]
614 (1.56%) 764 (1.95%) [1207: 3.08%]
5671 (18.60%) 7721 (25.33%) [11474: 37.64%]
N/A
E-value ≤ 0.01 533 (1.36%) 778 (2.55%) [1453: 4.77%]
424 (1.08%) 586 (1.49%) [827: 2.11%]
3943 (12.93%) 5688 (18.66%) [8481: 27.82%]
N/A
E-value ≤ 0.001 256 (0.65%) 564 (1.85%) [917: 3.01%]
364 (0.93%) 530 (1.35%) [700: 1.78%]
3030 (9.94%) 4832 (15.85%) [6995: 22.94%]
N/A
E-value ≤ 0.0001 168 (0.43%) 423 (1.39%) [682: 2.24%]
308 (0.78%) 464 (1.18%) [552: 1.41%]
2266 (7.43%) 4057 (13.31%) [6033: 19.79%]
N/A
E-value ≤ 0.00001 148 (0.38%) 371 (1.22%) [555: 1.82%]
210 (0.54%) 388 (0.99%) [474: 1.21%]
1676 (5.50%) 3533 (11.59%) [5035: 16.52%]
N/A
GA (gathering threshold) 140 (0.36%) N/A N/A N/A N/A N/A N/A TC (trusted cut offs) 140 (0.36%) N/A N/A N/A N/A N/A N/A default value N/A N/A N/A N/A N/A N/A 465 (1.53%)
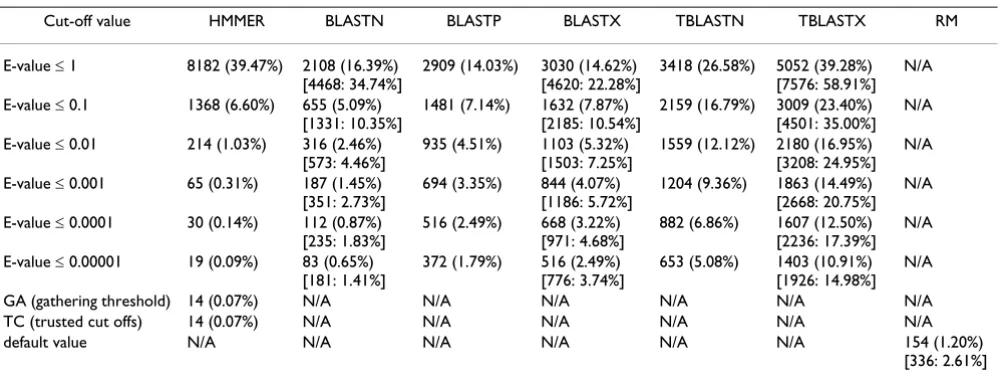
and Table 2 for the PDB and Swiss-Prot data sets respec-tively.
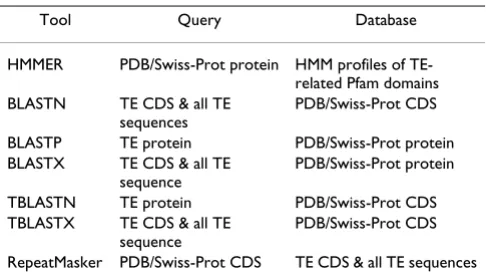
To compare the sensitivity of the HMM profile-based search method with more standard sequence-against-sequence similarity search methods, we used the BLAST and RepeatMasker programs to search for TE-derived sequences among host proteins and their corresponding CDS. To this end, we built CDS databases corresponding to the PDB and Swiss-Prot protein data sets, which con-tain 34,795 and 38,754 CDS sequences, respectively. These CDS data sets correspond to 30,486 PDB and 12,860 Swiss-Prot proteins. The difference in the number of proteins versus CDS can be attributed to the fact that a number of protein sequences lack the matching CDS because they are synthetic, mutated, or chimeric proteins. In addition, some protein entries may be related to more than one CDS sequence, while some CDS may match with several PDB entries due to the redundancy of protein chains. For use as query sequences in BLAST searches, we created three TE sequence libraries from data provided in Repbase: 5,611 TE sequences (for all TEs in all taxa), 1,423 TE-encoded proteins and 1,349 TE CDS sequences. The specific combinations of BLAST program, query set and data base set used in each search is shown in Table 3. The numbers (percentages) of sequences found with TE-related domains, based on a series of increasingly strin-gent E-value cut-offs, are shown in Table 1 and Table 2 for the PDB and Swiss-Prot data sets respectively. Finally, the RepeatMasker program was used to search for TE-related sequences among the PDB and Swiss-Prot CDS data sets (see numbers and percentages of hits in Table 1 and Table 2).
Considering the results of the three different classes of search strategies – HMMER, BLAST and RepeatMasker – together yields some unexpected results. Not surprisingly, however, RepeatMasker proved to be the least sensitive strategy to search for TE-related host protein coding sequences. Using the fairly liberal default cut-off value, which returns a number of hits with marginal reliability, RepeatMasker yields a lower number of hits than all but the most conservative searches with the other methods (Table 1 and Table 2). This is consistent with the fact that RepeatMasker relies on DNA-DNA sequence comparison.
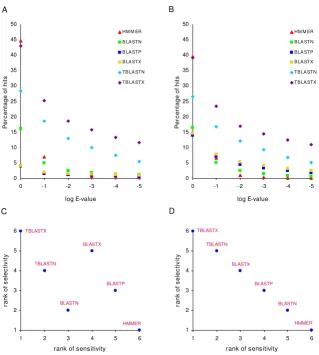
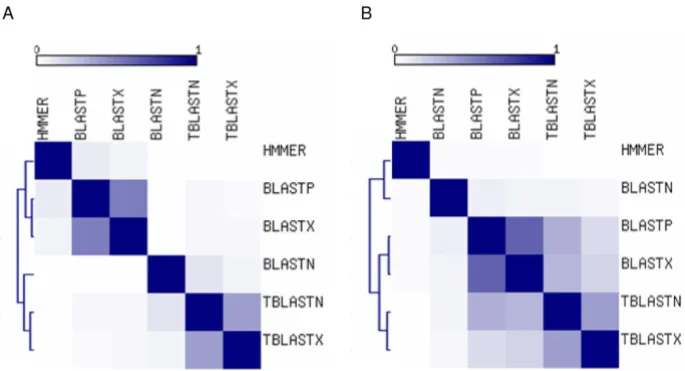
To compare the results of the HMMER versus BLAST search strategies, we plotted the percentage of hits against the E-value threshold used (Figure 1A and 1B). Together with Tables 1 and 2, these plots show the relative numbers (percentages) of hits retrieved using each method. TBLASTX searches, where CDS are translated in all six reading frames and are searched against nucleotide data-bases that are translated in six frames, gave the highest number of hits across all but the most liberal E-value cut-offs. This is consistent with previous results, showing that translated BLAST searches yield far more TE-host protein similarity than BLASTN or RepeatMasker searches [23]. The profile-based HMMER searches, which are expected to be the most sensitive, did return the highest number of hits at liberal E-values, but after two rounds of decreasing E-values, HMMER dropped off to yield the fewest number of hits across all the methods (Table 1, Table 2 and Figure 1). Thus, HMMER appears to be particularly sensitive to increasingly stringent E-value cut-offs.
To evaluate the selectivity of the search methods we employed, we measured the exponential rate of decline in
Table 2: Detection of TE-encoded sequences in SwissProt directly sequenced proteins. The number of SwissProt directly sequenced proteins found with TE protein fragments (from autonomous TEs) by different search programs is shown. The percentage of total SwissProt entries is shown in the parenthesis. The square bracket indicates the number and the percentage of protein entries associated with sequences derived from TEs including the non-autonomous ones.
Cut-off value HMMER BLASTN BLASTP BLASTX TBLASTN TBLASTX RM
E-value ≤ 1 8182 (39.47%) 2108 (16.39%) [4468: 34.74%]
2909 (14.03%) 3030 (14.62%) [4620: 22.28%]
3418 (26.58%) 5052 (39.28%) [7576: 58.91%]
N/A
E-value ≤ 0.1 1368 (6.60%) 655 (5.09%) [1331: 10.35%]
1481 (7.14%) 1632 (7.87%) [2185: 10.54%]
2159 (16.79%) 3009 (23.40%) [4501: 35.00%]
N/A
E-value ≤ 0.01 214 (1.03%) 316 (2.46%) [573: 4.46%]
935 (4.51%) 1103 (5.32%) [1503: 7.25%]
1559 (12.12%) 2180 (16.95%) [3208: 24.95%]
N/A
E-value ≤ 0.001 65 (0.31%) 187 (1.45%) [351: 2.73%]
694 (3.35%) 844 (4.07%) [1186: 5.72%]
1204 (9.36%) 1863 (14.49%) [2668: 20.75%]
N/A
E-value ≤ 0.0001 30 (0.14%) 112 (0.87%) [235: 1.83%]
516 (2.49%) 668 (3.22%) [971: 4.68%]
882 (6.86%) 1607 (12.50%) [2236: 17.39%]
N/A
E-value ≤ 0.00001 19 (0.09%) 83 (0.65%) [181: 1.41%]
372 (1.79%) 516 (2.49%) [776: 3.74%]
653 (5.08%) 1403 (10.91%) [1926: 14.98%]
N/A
GA (gathering threshold) 14 (0.07%) N/A N/A N/A N/A N/A N/A TC (trusted cut offs) 14 (0.07%) N/A N/A N/A N/A N/A N/A default value N/A N/A N/A N/A N/A N/A 154 (1.20%)
the relative number (percentage) of hits retrieved at decreasing E-value thresholds, which allowed us to meas-ure the effect of increasing stringency on the number of hits retrieved across methods. This was done by fitting exponential trend lines to the data shown in Figure 1A and Figure 1B and then ranking the searches with respect to the exponent of the trend line; the most selective
meth-ods are ranked the highest (i.e. have the lowest rank
number). In this way, HMMER was shown to be the most selective method and TBLASTX the least selective. As could be expected, selectively is inversely correlated with sensitivity, and exactly so for the SwissProt search, as can be seen when the ranks of method sensitivity (number of hits) are compared to the selectivity ranks (Figure 1C and Figure 1D). Again, this overall trend defied the expecta-tions of increased sensitivity of profile methods that we had at the outset of the study.
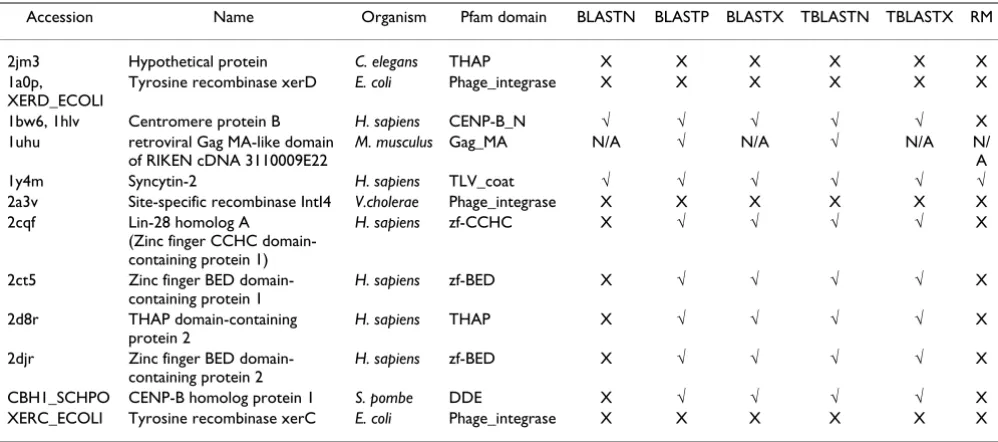
We also considered the relationships among the different search methods in terms of the fraction of hits that they had in common. For each pair of search methods, the frac-tion of shared hits was calculated (see Methods), and the resulting pairwise similarity matrix was used to cluster the methods (Figure 2). For both the PDB and SwissProt searches, the translated BLAST methods group together as do the protein searches BLASTP and BLASTX. BLASTN was more similar to the translated methods in the PDB search, while it had lower overlap with the other BLAST methods in the SwissProt search. HMMER consistently showed the lowest overlap with other methods. Perhaps more impor-tantly, the extent of overlap between the different meth-ods was surprisingly low. For instance, at the lowest E-value cut-off only 2 out of a total of 4,241 hits for PDB and 2 out of 1,724 for SwissProt were identified by all six search methods. This underscores the fact that the differ-ent search methods are very much complemdiffer-entary and indicates that an exhaustive search for potential TE-CDS exaptation events will require the use of a variety of search techniques.
Comparative analysis of cases of TE-CDS exaptation
HMMER was also run using the most conservative gather-ing (GA) and trusted cut-off (TC) thresholds described in the Methods section. Searches using GA and TC yield the fewest number of hits for both the PDB and Swiss-Prot searches. Thus, we took these results to be the most relia-ble (conservative) set of TE-related host proteins and
fur-ther evaluated these results to look for bona fide cases of
TE-CDS exaptation.
By manually evaluating these results, we were able to clas-sify the hits into five distinct categories (see Methods), only one of which represents the kinds of TE-CDS exapta-tion events that we are most interested in (Table 4). For instance, the vast majority of apparent TE-related proteins in the PDB data set corresponded to either synthetic
con-structs (i.e. artificial sequences) or non-specific, and often
ubiquitous, TE-related protein domains such as RNaseH. For this latter category, the non-specific TE-related domains, it is a formal possibility that they represent ancient TE-CDS exaptation events but it is difficult, if not impossible, to unambiguously support that assertion. Other proteins detected in the PDB set correspond to TE-encoded proteins and viral proteins. Only 11 out of 140 cases (or 7.9%) correspond to likely TE-CDS exaptation events. With the GA and TC thresholds, the Swiss-Prot dataset yielded far fewer total hits than did PDB and only 3 of these correspond to likely TE-CDS exaptation events (Table 4).
A set of 12 likely TE-CDS exaptation events, representing the non-redundant union of the most reliable cases from the PDB and Swiss-Prot sets in Table 4, were further ana-lyzed in order to assess the ability of BLAST and Repeat-Masker to detect these cases. Only one of the 12 proteins was detected using all methods, and again, RepeatMasker was shown to be the least sensitive method (Table 5). Indeed, as expected, DNA-DNA search methods in general were found to be insensitive; there are 4 cases where BLASTN and RepeatMasker are the only programs unable to detect the TE-CDS similarity. There were four individ-ual cases, corresponding to two different Pfam domains, where only HMMER was able to detect the TE-protein sequence similarity. These results stand in contrast to the results of the previous section, which indicate that HMMER is the least sensitive search method overall. There are two possible explanations for this dissonance. First of all, HMMER may suffer from a lack of coverage due to its reliance on the collection of Pfam domain family defini-tions. Secondly, and perhaps more plausible, the different search methods may in fact be complementary in terms of detecting different sets of exaptation events. This may be particularly relevant for DNA based, and/or translated, search methods that are able to compare non-coding TE-derived sequences to host protein and CDS sequences.
Table 3: Sequence similarity program-query-database combinations used to search for TE-related host sequences
Tool Query Database
HMMER PDB/Swiss-Prot protein HMM profiles of TE-related Pfam domains BLASTN TE CDS & all TE
sequences
PDB/Swiss-Prot CDS
BLASTP TE protein PDB/Swiss-Prot protein BLASTX TE CDS & all TE
sequence
PDB/Swiss-Prot protein
TBLASTN TE protein PDB/Swiss-Prot CDS TBLASTX TE CDS & all TE
sequence
PDB/Swiss-Prot CDS
Case studies of known TE-derived genes
There are a number of well verified cases of host proteins (genes) that are known to have been derived from TE sequences. These are proteins that have been shown to be functionally analogous and evolutionarily derived from their TE-encoded counterparts. For instance, the enzyme Telomerase evolved from TE-encoded reverse tran-scriptase enzymes [25,26] and the RAG1 recombinase is related to the transposase enzymes [27,28]. The centro-mere protein CENPB [29] and SETMAR [30] are other well documented cases of the evolution of host CDS from TEs. We have used these cases as positive controls in order to further evaluate the ability of the different classes of search methods to detect cases of TE-CDS exaptation.
We assessed the ability of each program to detect human proteins or CDS for all four of these cases (Table 6).
Trans-lated BLAST searches BLASTX and TBLASTN were the most sensitive search methods finding all of the cases in this data set, and HMMER was shown to be fairly sensitive in detecting three out four of the known cases of TE-exapta-tion. RepeatMasker was the least sensitive detecting only the SETMAR case. SETMAR represents an evolutionarily recent TE-CDS exaptation event that occurred during the primate radiation some 40–58 million years ago [30]. Thus, the SETMAR CDS retains DNA sequence similarity to the Hsmar1-type TE transposase gene from which it is derived. In any case, all the search methods were able to detect SETMAR, so RepeatMasker would not be necessary to elucidate this case. In general, for the BLAST searches, translated and protein based searches are the most sensi-tive followed by DNA-based BLASTN.
Sensitivity and selectivity comparison for different sequence similarity search methods
Figure 1
Sensitivity and selectivity comparison for different sequence similarity search methods. The percentage of hits returned by different sequence similarity search methods are shown across increasingly stringent E-value cut-offs for the PDB (A) and SwissProt (B) data sets. The selectivity and sensitivity ranks are compared for different search methods for the PDB (C) and SwissProt (D) data sets.
0 5 10 15 20 25 30 35 40 45 50 -5 -4 -3 -2 -1 0 log E-value P e rc en ta g e of hi ts
HM M ER
B LA STN
B LA STP
B LA STX
TB LA STN
TB LA STX
0 5 10 15 20 25 30 35 40 45 50 -5 -4 -3 -2 -1 0 log E-value P e rc en ta g e of hi ts
HM M ER
B LA STN
B LA STP
B LA STX
TB LA STN
TB LA STX
A B D C 1 2 3 4 5 6
1 2 3 4 5 6
rank of sensitivity
ra nk of s e le c tiv it y HMMER BLASTN BLASTP BLASTX TBLASTN TBLASTX 1 2 3 4 5 6
1 2 3 4 5 6
rank of sensitivity
Evolutionary relationship between TE and cellular proteins
In the formal sense, establishing a solid, statistically sig-nificant, sequence similarity relationship between TE-encoded and cellular proteins is necessary but not suffi-cient to make the claim of a TE-CDS exaptation event. This is exemplified by the numerous cases of ubiquitous, non-specific TE-related protein domains uncovered when searching the PDB and Swiss-Prot experimentally charac-terized data sets (Table 4). These abundant protein domains, such as RNaseH, can be functional analogs that have evolved convergently in host and TE genomes or they may have their evolutionary origins in host (cellular) genomes and been subsequently captured by TEs. Thus, it is necessary to document the evolutionary relationships between TE-encoded and related host-encoded protein domains as accurately as possible in order to evaluate the evidence for TE-CDS exaptation. Phylogenetic analysis is
best suited to this task. Indeed, phylogenetic analysis is
needed to unequivocally demonstrate a TE-origin, i.e. the
direction of the TE-to-host sequence transfer, for protein domains with similarity between TEs and host genomes as was shown for the case of Telomerase [26].
To illustrate this analytical process, we have chosen the THAP protein domain. Sequence similarity between the THAP domain and TEs has been noted previously but the evolutionary origins of the domain, and in particular the specific direction of the TE-host transfer, remains
uncer-tain. The Caenorhabditis elegans C-terminal binding
pro-tein (CtBP) [PDB: 2jm3] contains the THAP domain, a ~90 residue domain, which is restricted to animals and shared between the THAP family of cellular DNA-binding proteins and transposases encoded by DNA-type TEs. This domain was previously found to be homologous to the
site-specific DNA-binding domain (DBD) of Drosophila
P-element transposase [31]. An evolutionary analysis of the domain architectures and sequence similarities among THAP domain containing proteins was taken to suggest the possibility that cellular proteins have recruited this domain on more than one occasion [32].
In order to characterize all sequence relationships between TE and host-encoded THAP domains, we used HMMER with the Pfam THAP domain HMM profile to search among the Repbase library of TE-encoded proteins. The use of HMMER was necessitated by the fact that, con-sistent with results reported in previous sections of the manuscript, BLAST and RepeatMasker can not detect any Relationships among sequence similarity search methods
Figure 2
Relationships among sequence similarity search methods. Colors represent the fraction hits shared between ods, from 0 (white) to 1 (purple). The matrices are symmetrical with self-similarity shown along the diagonal. The search meth-ods are ordered along both axes of the plots with respect to similarity, and dendograms showing the relationships among methods are shown for the PDB (A) and SwissProt (B) data sets.
Table 4: Classification of proteins containing TE-associated Pfam domains detected by the GA and TC cut-offs of HMMER. The categories of hits are described in the text and the number (percentage) for each category is shown for searches against the PDB and SwissProt data sets.
Category PDB Swiss-Prot
Potential TE-related proteins 11 (7.86%) 3 (21.43%) Viral proteins 14 (10.00%) 0 (0%) TE-encoded proteins 18 (12.86%) 7 (50.00%) Synthetic construct 47 (33.57%) 0 (0%) non-specific TE-related protein
domains
TE-related sequence in C. elegans CtBP. Using HMMER, we found that PROTOP is the identity of the autonomous
Drosophila melanogaster P element that contains the THAP domain, in positions 12 to 94 of its consensus protein sequence. We also identified six additional TE families containing THAP domain (KBOC_DB, P1_AG, P3_AG, P4_AG, Kolobok-1_XT, Kolobok-2_BF). In addition, CtBP was used as a BLASTP search query to identify host (cellu-lar) genome encoded THAP domains. All TE and host encoded THAP domains were aligned, globally and locally, and phylogenetically analyzed as described in the Methods section.
The global and local alignment based phylogenetic analy-ses consistently identify one clade of host encoded THAP domains and a second clade of THAP domains encoded by both TEs and cellular genomes (Figure 3). Interest-ingly, the TE and host encoded domains are distributed throughout this clade suggesting the possibility of multi-ple transfers of THAP domain CDS between TE and host genomes. In addition, TE encoded THAP domains appear to have greater sequence diversity, reflected by the branch lengths, than host encoded THAP domains, consistent
with a TE origin of the domain. Thus, it appears that THAP indeed evolved among TE sequences and was subse-quently transferred on more than one occasion to host (cellular) genomes.
Protein coding potential of TE-derived exons
By now, it is well known that TE-derived sequences are fre-quently incorporated into the exons of host mRNAs [12]. What is less clear is the extent to which TE-derived exons of host genes are destined to become protein coding sequences. Previously, we addressed this issue by search-ing functionally well characterized protein codsearch-ing sequences for the presence of TE-related domains. Here, we take a DNA sequence codon based approach to this question. Our approach is based on the fact that protein coding sequences show a specific and marked periodicity of nucleotide frequencies across the first, second and third codon positions. This periodicity serves as a robust signal for a number of gene prediction algorithms, one of the earliest and most prominent example of which is Gene-Mark [33]. GeneGene-Mark can accurately identify protein cod-ing nucleotide sequences based solely on the distribution
Table 6: Detection of previously identified TE-associated proteins. The ability of the different sequence similarity search methods to detect well known cases of TE-derived CDS is indicated with √ and failure to detect is indicated with X.
Name TE-protein HMMER BLASTN BLASTP BLASTX TBLASTN TBLASTX RM
Telomerase Reverse transcriptase (LINEs) √ X X √ √ √ X RAG1 Transposase (Transib superfamily) X X √ √ √ X X
CENPB pogo-like DNA transposase √ √ √ √ √ √ X
SETMAR Hsmar1 transposase √ √ √ √ √ √ √
Table 5: Analysis of the qualified set of TE-associated domain containing proteins. Twelve PDB/Swiss-Prot proteins with TE-associated Pfam domains detected by HMMER (GA and TC cut-offs) are shown. The results from BLAST and RepeatMasker analysis are compared (√ = found, X = not found TE-related sequence). The cut-off E-value of 0.01 was used as the detection criteria.
Accession Name Organism Pfam domain BLASTN BLASTP BLASTX TBLASTN TBLASTX RM
2jm3 Hypothetical protein C. elegans THAP X X X X X X 1a0p,
XERD_ECOLI
Tyrosine recombinase xerD E. coli Phage_integrase X X X X X X
1bw6, 1hlv Centromere protein B H. sapiens CENP-B_N √ √ √ √ √ X 1uhu retroviral Gag MA-like domain
of RIKEN cDNA 3110009E22
M. musculus Gag_MA N/A √ N/A √ N/A N/
A
1y4m Syncytin-2 H. sapiens TLV_coat √ √ √ √ √ √
2a3v Site-specific recombinase IntI4 V.cholerae Phage_integrase X X X X X X 2cqf Lin-28 homolog A
(Zinc finger CCHC domain-containing protein 1)
H. sapiens zf-CCHC X √ √ √ √ X
2ct5 Zinc finger BED domain-containing protein 1
H. sapiens zf-BED X √ √ √ √ X
2d8r THAP domain-containing protein 2
H. sapiens THAP X √ √ √ √ X
2djr Zinc finger BED domain-containing protein 2
H. sapiens zf-BED X √ √ √ √ X
of observed nucleotide frequencies across codon posi-tions.
We used the eukaryotic version of GeneMark [33], to eval-uate the coding capacity of TE-derived exon sequences in the human genome. First, we compared the locations of 14,802 consensus CDS (CCDS) genes mapped to the hg17 build, from the UCSC Genome Browser [34], of the human genome to the locations of annotated TEs (see Methods). 761 of the human CCDS genes have TE-derived exon sequences; there are a total of 817 TE-derived exons. The 761 human genes with TE-derived exons include 160 TE-derived fragments with the minimum length of 100 nt required for GeneMark analysis. Using GeneMark proba-bilistic models (see Methods), we analyzed the TE-derived exon sequences as well as 500 randomly chosen represent-ative non TE-derived exons by calculating their
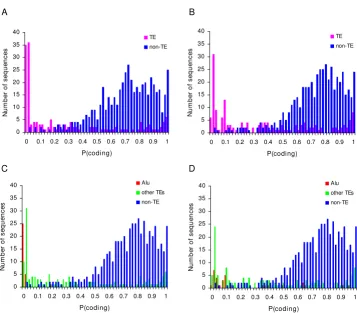
probabil-ity to be protein coding regions. The distributions of protein coding potentials (probabilities) for TE versus non TE sequences are shown in Figure 4. Visually the dis-tributions are quite distinct, with TE derived exons having far lower coding potential, and accordingly there is a highly significant difference between the two coding
probability distributions, D = 0.67 P = 0
Kolmogorov-Smirnov test (Figure 4A). The average coding potential of derived exons was 0.26 compared to 0.70 for non TE-derived coding sequences. Using a more sensitive custom-trained GeneMark model gave consistent results, 0.35 average TE coding probability versus 0.73 for non TE
sequences with significantly different distributions D =
0.59 P = 0 Kolmogorov-Smirnov test (Figure 4B). Clearly,
TE-derived exons have much lower coding probability than non-TE derived sequences suggesting that many of these exons do not actually encode proteins.
Phylogenetic relationship of TE and cellular THAP domains
Figure 3
Phylogenetic relationship of TE and cellular THAP domains. Neighbor-joining trees of seven THAP homologous TE sequences and seventeen cellular THAP sequences from various species are shown. The trees were created based on (A) the multiple sequence alignment of all THAP sequences and (B) the pairwise gamma distance matrix calculated from BLAST all-against-all pairwise alignments. TE-THAP sequences are indicated by red triangle marks. Bootstrap values (A) represent the fraction of times that internal branches, supporting clades, were recovered among trees built from 1,000 re-sampled align-ments.
A B
XP 871145.1 Bos taurus XP 001095010.1 Macaca mulatta NP 067488.1 Mus musculus XP 511041.1 Pan troglodytes XP 226417.2 Rattus norvegicus XP 001365051.1 Monodelphis domestica XP 546872.2 Canis familiaris NP 065190.2 Homo sapiens AAH71032.1 Xenopus laevis AAI35207.1 Xenopus tropicalis
XP 001176951.1 Strongylocentrotus purpuratus F49E10.5 Caenorhabditis elegans
CAE68813.1 Caenorhabditis briggsae XP 695016.1 Danio rerio
KBOC DB THAP Kolobok-2 BF THAP
CAG12750.1 Tetraodon nigroviridis EAT45565.1 Aedes aegypti
Kolobok-1 XT THAP PROTOP THAP P4 AGp THAP THAP NP 001014316.1 Danio rerio
P1 AG THAP P3 AG THAP
97 99
64
43 32 44 44 21
18 14 7
21
99 99
98
0.1
NP 065190.2 Homo sapiens XP 546872.2 Canis familiaris XP 511041.1 Pan troglodytes NP 067488.1 Mus musculus XP 871145.1 Bos taurus XP 226417.2 Rattus norvegicus XP 001095010.1 Macaca mulatta XP 001365051.1 Monodelphis domestica
AAH71032.1 Xenopus laevis AAI35207.1 Xenopus tropicalis
CAG12750.1 Tetraodon nigroviridis P1 AG THAP XP 001176951.1 Strongylocentrotus purpuratus
EAT45565.1 Aedes aegypti CAE68813.1 Caenorhabditis briggsae
Kolobok-1 XT THAP F49E10.5 Caenorhabditis elegans NP 001014316.1 Danio rerio XP 695016.1 Danio rerio
PROTOP THAP KBOC DB THAP Kolobok-2 BF THAP P4 AGp THAP THAP
P3 AG THAP
Since the TE-derived exons evaluated using GeneMark as described above are taken from the RepeatMasker annota-tions on the human genome sequence, they do not include more ancient well established cases of TE-derived CDS such as the first three cases shown in Table 6. One would expect that these TE-derived CDS have higher pro-tein coding potentials than the more recently exonized TE sequences revealed by RepeatMasker. In fact, when ana-lyzed using GeneMark in the same way as described for the entire set of TE-derived exons, all of their protein cod-ing probabilities are significantly greater (z-test: 15.5 <z < 16.9) than the average protein coding probability (0.35) of the aforementioned set of TE-derived exons: Telomer-ase = 0.81, RAG1 = 0.77, CENPB = 0.89. Interestingly, the protein coding probability of the relatively recent case of TE-CDS exaptation, SETMAR (0.67), is also significantly
greater (z = 11.8) than the average coding potential for the
set of RepeatMasker identified TE-derived exons. This is consistent with the fact that, while SETMAR does repre-sent a recent case of CDS exaptation, the particular
TE-sequence that was exonized was already a protein-coding domain prior to becoming a host gene [30].
Taken together, these protein coding probability data are consistent with previous studies that have suggested cau-tion is warranted when extrapolating genome sequence analyses to infer TE-CDS exaptation events [13,16,35,36]. In particular, the notion that non-autonomous TEs that do not encode any protein, including SINEs such as the Alu family of elements, can emerge as protein coding sequences after being incorporated into exons has been directly challenged [13]. On the other hand, Alus are fre-quently incorporated into mRNAs as exons [37-40], and there are a number of specific cases of Alu-derived CDS that have been proposed to provide novel CDS to primate genes [41,42]. In light of this controversy, we have specif-ically evaluated the potential coding capacity of Alu-derived exons using GeneMark.
Coding probability of human CCDS genes
Figure 4
Coding probability of human CCDS genes. The coding probability of derived coding sequences (pink) and non TE-derived coding sequences (blue) are shown, with results from the original GeneMark model (A) and our custom trained Gene-Mark model (B). TEs are separated in Alu (red) and non-Alu (green) for the original (C) and custom (D) GeneGene-Mark models.
A B
C D
0 5 10 15 20 25 30 35 40
0 0.1 0.2 0.3 0.4 0.5 0.6 0.7 0.8 0.9 1
P(coding)
N
u
m
b
e
r of
s
e
que
nc
e
s
TE non-TE
0 5 10 15 20 25 30 35 40
0 0.1 0.2 0.3 0.4 0.5 0.6 0.7 0.8 0.9 1
P(coding)
N
u
m
b
e
r of
s
e
que
n
c
e
s
TE non-TE
0 5 10 15 20 25 30 35 40
0 0.1 0.2 0.3 0.4 0.5 0.6 0.7 0.8 0.9 1
P(coding)
N
u
m
b
e
r of
s
e
que
n
c
e
s
Alu other TEs non-TE
0 5 10 15 20 25 30 35 40
0 0.1 0.2 0.3 0.4 0.5 0.6 0.7 0.8 0.9 1
P(coding)
N
u
m
b
e
r o
f se
q
u
e
n
ce
s
Alu-derived exons were considered separately from all other TE-derived exons and their coding probability distri-butions were plotted along with the distribution for non TE-derived exons (Figure 4C and Figure 4D). Alu-derived exons have coding probability distributions that are
shifted to the left, i.e. towards lower probability, than all
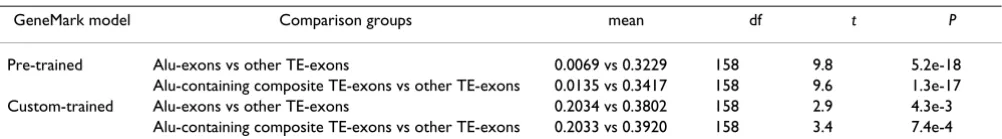
other TE-derived exons. Indeed, the average coding prob-abilities for Alu-derived exons are significantly lower than the averages for all other TE-derived exons (Table 7). This result holds under a number of different analytical condi-tions (see Methods), including the two different Gene-Mark models and the consideration of Alu-derived exons as only containing Alu sequences or containing Alu plus other TE sequences (composite TE-exons in Table 7).
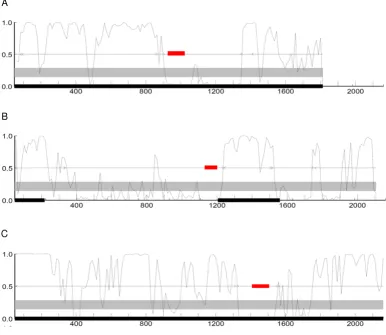
In addition to the global analysis of Alu-derived exon pro-tein coding potential, we also evaluated several docu-mented cases of Alu exonization events that are assumed to represent TE-CDS exaptations [41,42]. For these cases, the specific evolutionary scenarios giving rise to the Alu-derived exons are quite well documented, but the protein coding potential of the Alu-exons appears to be assumed. Here, the GeneMark web server [43], which runs both GeneMark and GeneMark.hmm [44] programs, was used to plot protein coding probabilities along the length of the CDS using a sliding window (Figure 5). This allowed the protein coding potential of the Alu-derived exons to be directly compared to that of the non TE-derived exons in the same genes. Consistent with their status as protein coding genes, the coding sequences analyzed tend to show uniformly high protein coding probabilities. How-ever, the Alu-derived exons show far lower protein coding potential than the rest of the gene sequences. The appar-ent low coding potappar-ential of Alu derived exons may also reflect the fact that these sequences have a relatively recent evolutionary origin as exons and thus have not had enough time to accumulate the kinds of changes that would yield periodicities that more closely resemble other coding sequences.
GC codon distribution for TE-derived exons
The distribution of GC content across codon positions can also be used to evaluate the protein coding potential of genomic sequences. This kind of analysis is based on the
fact that the GC level (%G+C) is distinctly lower in the second (GC2) than in the third (GC3) codon positions for protein coding sequences in species ranging from human to Escherichia coli [45,46]. Thus, for protein coding sequences, regression analysis of %GC2 × %GC3 should yield a trend line with a slope y << 1. Here, we used GC2/ GC3 regression analysis to compare the protein coding potential of TE-derived versus non TE-derived exons.
For the first analysis, GC2/GC3 trends were computed for entire genes that contain one or more TE-derived exons versus entire genes with no TE-derived exons (Figure 6A). In this case, the GC2/GC3 distributions are indistinguish-able and do not have significantly different slopes (t =
0.36, df = 14,798, P = 0.71). However, 27.93% of TE
asso-ciated genes were located outside the 95% confidence band of non-TE associated gene set. On the other hand, when TE-derived exons are considered alone (Figure 6B), the slopes of the TE-derived versus non TE-derived sets are
significantly different (t = 2.84, df = 14,384, P = 4.6e-3),
and 31.70% of TE-derived exons are found outside the 95% confidence interval for the non TE-derived set. Thus, while the GC2/GC3 analysis appears to suffer from a lack of resolution compared to the GeneMark coding potential analysis, it too points to a relatively low coding probabil-ity for TE-derived exons.
We also analyzed Alu-derived exons separately using GC2/GC3 codon analysis as was done with GeneMark. Visual inspection of the location of Alu-derived exons on the GC2/GC3 plot shows that they have relatively higher GC2, typical of non-coding sequence, and 41.79% fall outside the 95% confidence interval, all of which fall above the upper confidence interval boundary (See Addi-tional file 2). In addition, Alu-derived exons have average GC2/GC3 ratios that are significantly higher than the GC2/GC3 ratios for all other TE-derived exons and for the non TE-derived gene set (Table 8). In other words, the GC2/GC3 analysis also suggests that Alu-derived exons are less likely to encode protein sequences than other TE-derived exons.
Table 7: Comparison of protein coding potential for Alu-derived exons versus other TE-derived exons. Average protein coding potentials are compared between the specific pairs of groups indicated using the Student's t-test. Comparisons were done using two GeneMark models: pre-trained and custom-trained (see Methods).
GeneMark model Comparison groups mean df t P
Pre-trained Alu-exons vs other TE-exons 0.0069 vs 0.3229 158 9.8 5.2e-18 Alu-containing composite TE-exons vs other TE-exons 0.0135 vs 0.3417 158 9.6 1.3e-17 Custom-trained Alu-exons vs other TE-exons 0.2034 vs 0.3802 158 2.9 4.3e-3
Conclusion
The potential for TE sequences to become exapted as host protein coding sequences through the process of exoniza-tion has received a great deal of attenexoniza-tion as of late [47-51]. Implicit in much of this literature is the assumption
that exonized TE nucleotide sequences, i.e. TE sequences
that are spliced into mRNAs, actually encode protein sequences. However, this assumption has been chal-lenged on several different fronts [13,16,35,36]. In partic-ular, it is unclear whether non-autonomous TEs that do not encode any protein, such as Alu elements, actually provide protein coding sequences after becoming exonized [13]. Nevertheless, recent studies continue to turn up numerous apparent cases of TE-CDS exaptation [23,24]. So the matter of TE-CDS exaptation remains unsettled, and in this report we have tried to address the issue from two perspectives: i-with respect to the ascer-tainment biases that arise from the use of different
sequence similarity search methods and ii-in terms of the protein coding potential revealed by the probabilistic analysis of exonized TE nucleotide sequences.
Our use of profile-based (HMM) sequence similarity searches did allow for greater sensitivity than the more
widely used DNA-DNA (e.g. RepeatMasker) search
meth-ods when employed on a test set of well-characterized exa-pted TE-CDS (Table 5 and Table 6). Thus, ascertainment biases could explain the paucity of reliable examples of TE-derived protein coding sequences uncovered via the analysis of experimentally characterized protein sequence data sets [13,16]. However, when profile-based search methods are similarly applied to large-scale datasets of experimentally characterized proteins, they did not turn up many more cases than previously found (Tables 1, Table 2 and Table 4). In fact, the profile-based search method appeared to be less sensitive than all BLAST-based Coding probability of genes with Alu-derived exons
Figure 5
Coding probability of genes with Alu-derived exons. GeneMark protein coding probability analyses are shown for three genes with well-characterized Alu-derived exons: C-rel-2 [CCDS: CCDS1864.1] (A) MTO1-3 [CCDS: CCDS4979.1] (B) and PKP2b-4 [CCDS: CCDS8731.1] (C) [41]. Coding probabilities were calculated within windows sliding along the length of the genes. The locations of the Alu-derived exons are shown in red.
A
B
search methods – nucleotide, protein or translated (Table 1 and Table 2). This apparent lack of power can actually be attributed to the superior selectivity of the profile-based methods (Figure 1) and suggests that many of the putative TE-CDS exaptation events turned up in BLAST searches may be spurious. In other words, profile-based search methods possess a valuable combination of sensi-tivity, measured by their ability to recover positive control test cases, and selectivity than any of the other search methods used. Nevertheless, the different search methods are complementary to the extent that combined search approaches are needed to thoroughly check any data set for all potential TE-CDS associations. Different search methods will also be more or less appropriate depending on the kind of exonization event that is being analyzed; for instance, it will not be possible to search for the con-tribution of non-coding TEs to exapted protein domains using profile methods based on protein sequence align-ments.
The codon based analysis of exonized TE sequences sug-gests that many, if not most, of these sequences do not actually encode any protein. Non-coding TEs that are exonized, such as Alu, have particularly low protein cod-ing probabilities. The lack of protein codcod-ing potential does not mean that exonized TE sequences are necessarily non-functional. They may in fact play a role in post-tran-scriptional gene regulation. We hypothesize that many exonized TE sequences serve as natural anti-sense tran-scripts, which can function as double stranded RNA regu-lators of gene (protein) expression. The repetitive dispersed nature of exonized TE sequences may provide a mechanism by which they can serve as master regulators with influence over the expression of numerous genes throughout the genome.
Methods
Detection of TE-encoded protein fragments Sequence data sets
The set of functionally well characterized proteins was taken from two databases: Protein Data Bank (PDB) [14] (downloaded on 03/02/07) and Swiss-Prot Protein Data-base [15] (version 52.0). For the Swiss-Prot entries, only
Table 8: Comparison of GC2/GC3 ratios for different classes of TE-derived and non TE genes (exons). Average GC2/GC3 ratios are compared for pairs of groups indicated using the Students' ttest.
Comparison groups averages df t P
TE-genes vs non TE-genes 0.82 vs 0.76 14800 7.4 1.2e-13 TE-exons vs non TE-genes 0.96 vs 0.76 14386 9.4 6.8e-21 Alu-exons vs other TE-exons 1.01 vs 0.95 345 1.9 6.2e-2 Alu-exons vs non TE-genes 1.01 vs 0.76 14106 8.2 3.9e-16
The GC composition of human CCDS genes
Figure 6
The GC composition of human CCDS genes. The scat-ter plots of %G+C of second (GC2) versus third (GC3) codon positions for TE-associated genes (red) and non-TE associated genes (green) are shown. The light blue line repre-sents the linear regression line of non-TE associated genes while the blue lines show the 95% confidence interval. For the TE-associated group, the GC content for the whole sequence of TE-associated genes (A) and for TE-derived gene fragments only (B) are shown. The yellow line represents the linear regression line of these TE associated groups.
A
0 20 40 60 80 100
0 20 40 60 80 100
% GC3
%G
C
2
CCDS (w ithout TEs) CCDS (w ith TEs)
Linear regression: CCDS (w ithout TEs) 95% confidence band: CCDS (w ithout TEs) Linear regression: CCDS (w ith TEs)
B
0 20 40 60 80 100
0 20 40 60 80 100
% GC3
%G
C
2
CCDS (w ithout TEs) TE-derived fragments
directly sequenced proteins were included in the data set. These directly sequenced proteins are the proteins whose amino acid sequence has been partially or completely determined experimentally by Edman degradation or by mass spectrometry and can be found by searching the Swiss-Prot database with the keyword 'Direct Protein Sequencing'. The data set of experimentally characterized protein sequences from PDB and Swiss-Prot was then fil-tered to remove the sequences from viruses. The nucle-otide coding sequences (CDS) corresponding to the final set of protein sequences was obtained from EMBL CDS database [52]. It should be noted that PDB entries can contain more than one distinct protein sequence (chain) and the same protein sequence (chain) may be found in more than one PDB entry. A data set of protein sequences encoded by TEs and their corresponding CDS sequences were extracted from Repbase [21] version 12.02. The data set of all TE nucleotide sequences (including non-autono-mous TEs) was retrieved from Repbase website [53].
Identification of TE-related protein domains
Protein domains that are associated with TEs were identi-fied in version 21.0 of the Pfam database [20] and the associated InterPro annotation [54]. Pfam entries, both keywords and domain descriptions, were automatically searched using a set of related terms (e.g. transposon, ret-rotransposon, retroviral/retrovirus, transposase, reverse transcriptase, etc.) as in [24]. The resulting putative TE-related Pfam entries were then manually inspected to remove spurious hits corresponding to protein families that are not encoded by any TEs. Manual inspection was done using the Pfam domain descriptions and literature references. HMM profiles, representing the site-specific sequence variation, of the TE-related Pfam domains were used in searches with the HMMER program as described below.
Sequence similarity searches
The experimentally characterized PDB/Swiss-Prot protein sequence data sets described above were searched for the presence of the TE-related protein domains using version 2.3.2 of the HMMER program [55]. HMMER searches were run using a series of increasingly stringent threshold
E-values, from E-value ≤ 1 to E-value ≤ 0.00001, in
addi-tion to the gathering threshold (GA) and trusted cut-off (TC) threshold values (Table 1 and Table 2). The GA and TC threshold cut-offs are values that have been bench-marked by the developers of HMMER to ensure that a minimum number of false-positive hits are detected. The GA thresholds are empirically set for each Pfam model and correspond to the score used to collect all of the sequences included in the Pfam full alignment. In other words, the GA threshold corresponds to the complete absence of false-positives. The TC threshold is similar to GA in the sense that it corresponds to the lowest scoring
hit to any sequence included as a true member of a partic-ular Pfam domain. TE-associated PDB/Swiss-Prot proteins detected by HMMER were classified into five categories: i-potential TE-related proteins (the host proteins contain-ing TE-associated protein domains), ii-viral proteins (gen-uine viral proteins though the PDB source organism is not listed as a virus), iii-TE-encoded proteins found in TEs as opposed to cellular host proteins, iv-synthetic construct (synthesized protein sequences), and v-ubiquitous
non-specific TE-related protein domains (i.e. host protein
con-taining Pfam domains which are not specific to TE protein sequences but can be found in TEs as well).
Various BLAST programs [56] and the program Repeat-Masker [17] were used to search the protein sequence and CDS data sets described above for TE-related protein sequences and/or TE-related CDS. The specific program-query-database combinations used for each search are shown in Table 3. BLAST programs were run using a series
of E-value thresholds, from E-value ≤ 1 to E-value ≤
0.00001, with default parameters and without low-com-plexity filtering.
The fraction (f) hits shared between any two methods was
taken as the ratio of the number of hits retrieved in both searches to the total number of hits in both searches. For
two searches that return x and y numbers of hits
respec-tively:
All pairwise similarity values were calculated in this way, and the resulting matrix was clustered using hierarchical clustering. Matrix clustering and visualization were done using the programs Genesis [57] and Matrix2png [58] respectively.
Analysis of known cases of TE-derived proteins (genes)
Several well known cases of proteins (genes) derived from TEs were evaluated by the HMMER, BLAST and Repeat-Masker programs to determine the efficiency of different search methods in detecting TE-CDS exaptation events. The TE sequence data set sources as described in the previ-ous section were used for these searches. The Genbank sequence accessions for the known cases are Telomerase Reverse Transcriptase [RefSeq: NM_198253, NM_198255, NP_937983, NP_937986], Recombination Activating
Gene 1 (RAG1) [RefSeq: NM_000448, NP_000439],
Cen-tromere protein B (CENPB) [RefSeq: NM_001810,
NP_001801], SET domain and Mariner transposase
fusion gene (SETMAR) [RefSeq: NM_006515,
NP_006506].
fxy x y
x y x y =
+ − ∩
Evolutionary analysis of TE-associated protein domain
We used the THAP domain-containing protein, C. elegans
C-terminal binding protein (CtBP) [PDB: 2jm3], for a phylogenetic analysis of THAP domain shared between TE and cellular proteins. The position of the THAP domain in
C. elegans CtBP [RefSeq: NP_508983] was identified using HMMER program. The BLASTP program was used to search for the homologous sequences of CtBP THAP in other species, using the Genbank non-redundant data-base, and the sequence fragments corresponding to the THAP domain were extracted as "cellular THAP". The library of TE proteins sequences (described in the sub-sec-tion Detecsub-sec-tion of TE-encoded protein fragments: Sequence data sets) was searched for the THAP-containing entries by using HMMER program with gathering (GA) threshold cut-off. The sequence fragments corresponding to the THAP domain in TE proteins were extracted as "TE-THAP" sequences.
Phylogenetic analysis of THAP sequences was done using the neighbor-joining algorithm [59] implemented in the MEGA program [60]. Two sources of pairwise distances were used based on i-global sequence alignment of THAP domains with CLUSTALW [61] and ii-local alignment of THAP domains using all-against-all pairwise BLASTP. For the global THAP domain sequence alignments, Poisson distances were used, and for the local THAP domain com-parisons, p-values (proportion of differences) taken from the BLAST output were transformed into gamma distances
using α = 2.25 [62]. Bootstrap analysis, based on 1,000
replicates, was performed on the global THAP sequence alignment.
Codon based analysis of TE-derived exons
The UCSC Genome Brower [34] and Table Browser tools [63] were used to search for human protein coding sequences co-located with TEs. Genomic locations of the CCDS genes mapped to the hg17 (NCBI Build 35) version of the human genome sequence were compared to the locations of TEs annotated with the RepeatMasker pro-gram [17]. The CCDS gene data set [64] was chosen because it represents a highly reliable set of gene models that are built from multiple lines of evidence and undergo quality analysis across several genomic centers before being released. Two data sets were created in this way: i-genes containing TE-derived exon sequences and ii-i-genes without TE-derived exons.
Version 2.5f of the GeneMark program [33] was used to compare the protein coding probabilities of TE-derived and non TE-derived human exons. GeneMark uses three-periodic inhomogeneous Markov models to analyze pro-tein coding sequences and we used two models in our analysis. The first model is the GeneMark model pre-trained on validated coding and non-coding sequences of
the human genome. This model is made available with the program. We also trained a customized GeneMark model using protein coding exon sequences from the non TE-derived gene set for the coding training set and intron sequences from the same genes as the non-coding training set. Each training set was classified into five groups based on %GC content (<41, 41–47, 47–53, 53–59, >= 59) for separate training of the fifth order Markov chain models. Note that 100 non TE-derived genes of each GC level were randomly selected as a set of non TE test sequences and removed from the training set before model training. The GeneMark program was run on the set of genes with TE-derived exons using the custom made model parameters corresponding to the GC content of each gene. The sliding window size was chosen to be 96 nt long and the step size to be 3 nt. The average posterior probability, which char-acterizes the probability that the sequence encodes a pro-tein, was calculated for each TE-derived exon sequence fragments (>100 nt) using the following formula:
where x+W/2 <= i <= y-W/2, x = start position of TE
frag-ment, y = end position of TE fragment, n = # of sliding
windows for which the midpoint lies within the range of
x+W/2 to y-W/2, i = the midpoint of each sliding window,
P(cod1|F) = posterior probability of the event that given
the fragment F, it carries genetic code in frame 1 (starting
from the very first nucleotide), W = the width of sliding
window. The coding probability was calculated in the same way for the non TE test sequences. The analysis was repeated for the same test set using the pre-trained Gene-Mark models for human genome.
For the GC2/GC3 analysis, the GC level (%G+C) of sec-ond (GC2) and third (GC3) codon positions were calcu-lated for each coding sequence of both the TE-derived and non TE-derived gene data sets. In addition, %GC2 and %GC3 were calculated for TE-derived fragments that are at least 60 nt long.
Competing interests
The author(s) declare that they have no competing inter-ests.
Authors' contributions
JP participated in the design of the study, all of the analy-ses and the drafting of the manuscript. MTR and SP col-lected all TE-related Pfam domains and participated in the HMM searches. MB participated in the GeneMark analysis of protein coding sequences. IKJ participated in the design of the study and the drafting of the manuscript and coor-dinated all activities related to the study. All authors read and approved the final manuscript.
P(codx..y) P(cod |F)= 1
1
n i
Reviewers' comments
Reviewer's report 1
Itai Yanai, Harvard University
In this manuscript Piriyapongsa et al. report a systematic analysis of the potential for transposable elements (TE) to contribute to proteomes. This is an issue of recent contro-versy in the literature with estimates of proteins with TE's in an organism ranging from 0.1% to 4%. The authors point out that along with the variation of estimates, is also variation of the datasets used and the searches invoked to analyze them. Datasets used comprise either predicted or experimentally-characterized protein sequences. Search methods used are DNA sequence similarity methods such as RepeatMasker, protein based searches, or profile based searches. The latter two methods are expected to be more sensitive than DNA searches. One specific goal of this study is to test whether the number of detected TEs is low in the clean set of experimentally-characterized protein sequences despite the use of sensitive sequence similarity measures. Another is to analyze the translation potential by two additional codon-based methods.
The authors find that even the more sensitive protein and profile methods do not uncover too many more instances of translated TE instances. This provides strong evidence that the original result – TEs exapted in 4% of the human proteome – is roughly off by an order of magnitude, when examined with respect to validated protein sequences as opposed to predictions of protein sequences. However, the most dramatic evidence for the general non-transla-tion of TE's comes from Piriyapongsa et al.'s codon-based analysis which shows that they are as untranslated as ALUs. This dramatic lack of coding potential as estimated by the GeneMark program does however beg the question of why these have apparently maintained an open reading frame and did not accumulate non-sense mutations by drift.
One remaining open question now that the extent of TE exaptation is roughly estimated is the exact delineation of the TE proteins. One attractive method is the phylogenetic approach which Piriyapongsa et al. demonstrate for the THAP domain. Perhaps this approach can be applied glo-bally to achieve a final tally of TE's contribution to pro-teomes. The authors also hint at a second method: the integration of the 7 sequence comparison methods to increase confidence in TE exaptation predictions. The authors show a checkered pattern of success and failure of the 7 methods to detect previously identified TE-associ-ated proteins. From one aspect it is interesting to ask if the specific failures of some of the programs can be overcome by tuning the specific search parameter. And from another aspect, could this positive control set and the pattern of successes across the different methods be used to learn
how the different methods complement each other? This seems to be especially in demand given the very limited amount of overlap between many of the methods. Such integration may lead to a more accurate list of TE exapta-tions.
Authors' response: Dr. Yanai suggests an interesting point about the use of a combined search program approach and the adjustment of search parameters for more accurate identifica-tion of TE exaptaidentifica-tions. This is a good idea, although a larger positive control set may be needed in order to get more informa-tion on TE exaptainforma-tion signals. Several factors (e.g. age of TEs) that can affect search parameters have to be considered. As we show in Table 6, SETMAR, which represents an evolutionarily recent TE-CDS exaptation event that occurred during the pri-mate radiation, maintains very strong signal that could be detected by any program we used. The ancient TE-CDSs do not retain DNA sequence similarity to the TEs from which they are derived and complementary methods will be needed to capture all such events. Indeed, there is no one method that captures all of the events, and it is difficult to appreciate exactly which com-bination of search techniques would be needed to ensure maxi-mum coverage. In general, the more methods that can be used the better. Different methods will be more-or-less effective according to the type (e.g. element family and/or age) of exap-tation event that is being evaluated and the same probably holds for the tuning of specific search parameters (e.g. e-value thresh-olds).
Finally, the notion that many genes contain TE's that are not translated leads to the interesting question of how the organism protects itself against disruption by TE inser-tions. Surprisingly TE's may not promote creativity at the protein level but instead creativity at the level of new mechanisms to curb the disruption caused by proliferat-ing selfish elements.
Reviewers' report 2
Kateryna D. Makova, Pennsylvania State University and Melissa Wilson, Pennsylvania State University (nominated by Kateryna D. Makova)
The manuscript by Piriyapongsa et al. provides an investi-gation of a very interesting and recently debated issue, i.e. how much transposable elements contribute to protein-coding genes. The authors discuss previous research on this topic and provide a thorough analysis to reach their final conclusions. The manuscript is well written and will be of great interest to a broad audience. We have just a few minor suggestions for the authors to consider.
1. It is clear from table 4 that PDB and Swiss-Prot contain very different protein sets. We wonder how much these two sets overlap, is one more abundant for some species than the other, and how this disparity might affect the results.
Authors' response: The PDB and Swiss-Prot proteins are indeed quite different and that is one of the reasons that we analyzed these two data sets separately. The results are shown individually for PDB and Swiss-Prot proteins. We have checked for the overlap between PDB and Swiss-Prot data sets using BLAST program. 52.60% of Swiss-Prot protein (CDS) sequences have at least one PDB CDS hit with e-value <= 0.001. 72.07% of Swiss-Prot protein sequences have at least one PDB protein hit with e-value <= 0.001. So the two sets do overlap substantially. In addition, the results of most search methods, in terms of the fraction of hits obtained, were compa-rable across the two data sets (Table 1and Table 2). Only the results obtained from BLASTP and BLASTX program showed markedly lower percentages of PDB hits compared to Swiss-Prot data set. The lower fraction of TE-encoded sequences in PDB data set can be due to the redundancy of protein chains in PDB entries. The HMMER search, which used PDB/Swiss-Prot pro-teins as query sequences, also showed the difference of hit frac-tions between two protein data sets, though not as clearly as BLAST results. Having said all of that, the two most relevant points for our manuscript that hold for both the PDB and Swiss-Prot sets are 1-different search methods detect largely different sets of hits as described in the manuscript and 2-the different search methods show similar relative performances in terms of selectivity and sensitivity (Figure 1).
2. Under Results and Discussions, the first section titled, "Searching for TE-associated proteins," when discussing the BLAST searches, it might be clearer to describe the three TE databases as libraries, only because it is confusing to think of searching the CDS databases with another database.
Authors' response: The sentence has been edited to read "TE sequence libraries" as suggested.
3. How do you define selectivity?
Authors' response: Selectivity is defined in our manuscript as the strength of the effect of increasingly stringent E-value thresholds on the number of hits retrieved by the different search methods. This is measured in terms of the relative number (percentage) of hits retrieved at different E-value cut-off levels.
4. Under "Comparative analysis of cases of TE-CDS exap-tation", do you mean that you had the exact same hits (same proteins) for both the PDB and Swiss-Prot using GA and TC in HMMER? Please clarify.
Authors' response: We meant that the GA and TC methods yield the same number of hits when run on the same database (not between databases). This was confusing and we have mod-ified the confusing part of the sentence to clarify it.
5. What evidence do you have for the proposal that exonized TE sequences serve as natural anti-sense tran-scripts, or that they may be master regulators? Perhaps the word "hypothesize" would be better suited than "pro-pose" in the second to last sentence of the Conclusion.
Authors' response: We currently have several ongoing projects in the lab that are related to this open question. The 'proposal' that TE sequences serve as natural anti-sense tran-scripts is supported by some new unpublished data, but we need to evaluate this more before we can be certain. Therefore, the reviewers' point is well taken and we have changed the abstract and the conclusion to read 'hypothesize' as suggested.
6. In figure 3, if there is enough room, it would be benefi-cial to have the species names spelled out completely either in the figure or in the figure legend.
Authors' response: For the cellular proteins, the species names have been added to the figure as suggested.
Reviewer's report 3
Cedric Feschotte, University of Texas, Arlington (nominated by John M. Logsdon Jr.)