R E S E A R C H A R T I C L E
Open Access
Association among handgrip strength,
body mass index and decline in cognitive
function among the elderly women
Su-min Jeong
†, Seulggie Choi
†, Kyuwoong Kim
2, Sung Min Kim
2, Sujin Kim
3and Sang Min Park
1,2*Abstract
Background:The association between handgrip strength combined with body mass index (BMI) and cognitive
impairment has not been thoroughly examined. We aimed to investigate whether the relationship between handgrip strength and risk of cognitive impairment is altered by the presence of obesity in older women.
Methods:A total of 544 older women aged over 65 years without cognitive impairment from the Korean Longitudinal Study of Aging (KLoSA) were included in the study. Handgrip strength was classified in a binary manner (weak or strong) or in tertiles and obesity was defined as a BMI≥25 kg/m2, in accordance with the Asia-Pacific World Health Organization criteria. Incident cognitive impairment was defined as a Korean Mini-mental State Examination (K-MMSE) score of less than 24 after eight years of follow-up.
Results:Strong handgrip strength was associated with reduced likelihood of developing cognitive impairment compared to weak handgrip strength in obese women (adjusted odds ratio, aOR 0.23, 95% confidence interval, CI 0.08–0.66). The highest tertile of handgrip strength was associated with reduced risk of incident cognitive impairment (aOR 0.16, 95% CI 0.04–0.70), compared to the lowest tertile of handgrip strength in obese women, with a significant linear trend (pfor trend = 0.016). Furthermore, the highest tertile of handgrip strength was significantly associated with smaller decline in K-MMSE scores compared to the lowest tertile of handgrip strength in obese women (pvalue = 0.009). There was no association between handgrip strength and incident cognitive impairment in non-obese women.
Conclusions:Strong handgrip strength was associated with reduced risk of cognitive impairment among obese women, but not in non-obese women. Handgrip strength may be a simple and useful marker for predicting future cognitive impairment among obese women.
Keywords:Handgrip strength, Obesity, Cognitive function
Background
Cognitive decline may lead to mild cognitive impairment or dementia among older adults. A recent study has shown that the conversion rate to cognitive impairment is 6% per person-year among healthy adults [1]. Therefore, identifying and managing modifiable risk factors for cog-nitive decline are imperative. Previously, body mass index (BMI) and weight change has been shown to be associated
with cognitive decline [2, 3]. A recent meta-analysis re-ported that being underweight, overweight, and obese in mid-life were associated with increased risk of dementia [4]. However, in other studies, overweight in late-life was associated with lower risk of dementia [5]. In addition, decline in BMI was associated with reduced memory function.
The protective effect of high BMI on the risk of demen-tia may be affected by handgrip strength, a surrogate marker for muscle strength. Handgrip strength, which is positively correlated with BMI, is a valid and representa-tive measure of muscle strength that reflects total power from the upper limb muscles [6]. Previous studies have shown that handgrip strength is associated with mortality
* Correspondence:[email protected]
†Su-min Jeong and Seulggie Choi contributed equally to this work. 1
Department of Family Medicine, Seoul National University Hospital, 101 Daehak-ro, Jongno-gu, Seoul, South Korea
2Department of Biomedical Sciences, Seoul National University Graduate
School, 101 Daehak-ro, Jongno-gu, Seoul, South Korea Full list of author information is available at the end of the article
[7,8], cardiovascular disease [9,10] and cognitive function [11–13]. In terms of the temporal relationship between handgrip strength and cognitive function, many studies reported that cognitive decline preceded handgrip strength weakness [11, 14]. Moreover, handgrip strength could be a predictive value for cognitive decline [15]. Strong handgrip strength may imply that the intact neuro-muscular integrity is associated with reduced risk of de-mentia and cognitive decline. Although handgrip strength differs according to BMI [16], most previous studies have simply adjusted for height, weight [11] or BMI [12,13].
Therefore, we hypothesized that different associations may exist between handgrip strength and cognitive strength according to obesity. This study aimed to investi-gate whether the relationship between handgrip strength and risk of cognitive impairment is altered by the presence of obesity in older women.
Methods Study population
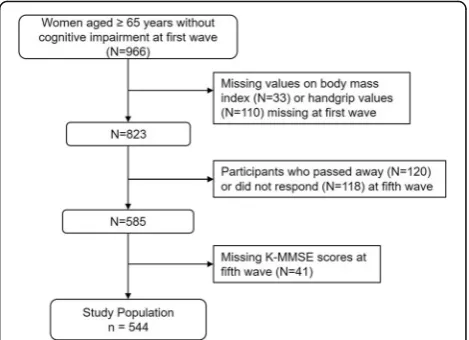
The study population was derived from a nationwide panel survey on individuals over the age of 45 years, called the Korean Longitudinal Study of Aging (KLoSA) [17]. The Korea Labor Institute sampled 6171 house-holds from 1000 enumeration districts since 2006 and obtained data on demographics, health status, family structure, income and employment status, and medical history via interviews with follow-up interviews every two years. Five waves are publicly available (2006, 2008, 2010, 2012, and 2014), among which we used the first (2006) and fifth (2014) waves. A total of 966 older women without cognitive impairment (24 points or more of the Korea Mini-mental State Examination, K-MMSE) aged 65 years or older were initially included during the first wave. Individuals without information on BMI or handgrip strength values (n= 143) at first wave, who passed away (n= 120) and did not respond at the fifth wave (n= 118) were excluded. After excluding individuals who lack K-MMSE scores during the fifth wave (n= 41), the final study population consisted 544 respondents (Fig.1).
Measurement of handgrip strength
Two primary exposure variables were used in this study: handgrip strength and BMI from the first wave. Hand-grip strength was measured by using a dynamometer (Model number: NO6103, Manufacturer: TANITA, Japan), which measures handgrip strength in units of 0.1 kgF and has been used in multiple previous studies that determined handgrip strength [18, 19]. Upon measure-ment, the participant was in a seated or standing pos-ition, her elbow at a right angle, and the wrist in neutral position. Two measurements for each hand were taken, with the maximum value from each hand were averaged
to determine the final handgrip strength. Handgrip strength was either classified in a binary manner as weak (lower half of handgrip strength, ≤18.5 kgF) or strong (upper half of handgrip strength, > 18.5 kgF), or into ter-tiles (4.5–17.5 kgF, 18.0–20.5 kgF, and 20.8–27.5 kgF).
Classification of handgrip strength and BMI
The other primary exposure variable, BMI, was calcu-lated by self-reported data on weight and height during the first wave. As the revised Asia-Pacific BMI criteria by the Western Pacific Region of the World Health Organization classified those with BMI of 25 kg/m2 or greater as obese [20], we divided the study population into non-obese (BMI of less than 25 kg/m2) and obese (BMI of 25 kg/m2 or greater). A previous study investi-gating the association between BMI calculated by self-reported weight and height data from KLoSA and BMI calculated by measured weight and height on the same study sample (from a sub-sample of 510 individuals from KLoSA) revealed acceptable Pearson’s correlation coefficients (0.865) and specificity (98.0%), but low sensi-tivity (60.1%) for obesity diagnosis among women [21].
We combined handgrip strength and BMI by first div-iding the population into non-obese and obese individ-uals. Then, the population was further divided according to handgrip strength (lower half and upper half ). The population was ultimately divided into: 1) non-obese and weak (lower half ) handgrip strength, 2) non-obese and strong (upper half ) handgrip strength, 3) obese and weak handgrip strength, and 4) obese and strong hand-grip strength.
Assessment of cognitive impairment and cognitive decline
Incident cognitive impairment was determined by the K-MMSE score on the fifth wave. K-MMSE is used to
determine cognitive function by questions designed to assess various categories of cognitive function, such as time and place, orientation, registration, attention and calculation, memory recall, language, and visual con-struction [22, 23]. The validity of K-MMSE scores has been verified in a previous study [22], in which decreas-ing scores from a perfect score of 30 indicate declindecreas-ing cognitive function. As K-MMSE scores of 24 or greater are considered normal [22,23], we defined cognitive im-pairment as a change of K-MMSE score into 23 or less. Furthermore, we calculated the degree of cognitive func-tion decline by subtracting the K-MMSE scores in 2014 by those in 2006 for each individual.
Covariates
The covariates considered in this study are age, marital status (married and unmarried), education (elementary, middle school, high school, and college or higher), in-come (divided into quartiles), insurance (Medicaid and National Health Insurance), area of residence (urban and rural), smoking status (never smoker, ex-smoker, and current smoker), drinking (no and yes), physical activity (self-reported questionnaire of none and at least once per week of exercise), weight change determined by the change in BMI between the fifth and first waves (loss of less than 1 kg/m2, no change, and gain of more than 1 kg/m2), activities of daily living (0 and 1 or more), de-pression (the Dede-pression 10-item Scale of 4 or less and more than 4, the Center for Epidemiologic Studies), co-morbidity (none among cardiovascular disease, stroke, hypertension, and diabetes, and at least one), and base-line K-MMSE score from the first wave.
Statistical analysis
The analysis of variance (ANOVA) method for continu-ous variables and χ2 test for categorical variables were performed to compare differences in baseline variables according to BMI and handgrip strength. We first
deter-mined the association between baseline handgrip
strength and BMI values in the first wave (2006) and cognitive decline in the fifth wave (2014), resulting in an eight-year follow-up period. This was carried out in two ways. We performed logistic regression analyses between the four groups categorized according to BMI and hand-grip strength and cognitive decline. Then, the study population was divided into tertiles of increasing hand-grip strength and logistic regression analyses was con-ducted in non-obese and obese groups. The P for interaction was calculated to determine whether obesity was a significant factor in the association between hand-grip strength and cognitive impairment. Furthermore, the association between baseline handgrip strength and BMI values and degree of cognitive function decline was investigated by linear regression analyses between
handgrip strength tertiles and change in K-MMSE scores. Finally, the association between change in hand-grip strength and cognitive impairment among those with strong handgrip strength during the first wave was determined by logistic regression analysis to confirm the causality. Among those with strong handgrip strength in the first wave, those with strong handgrip strength (maintained handgrip strength) and weak handgrip strength (weakened handgrip strength) during the fifth wave were compared for development of cognitive decline.
For logistic and linear regression analyses, covariates were adjusted for in a sequential manner: model 1 (age), model 2 (additionally marital status, education, income, insurance, and area of residence), model 3 (additionally smoking status, drinking, and physical activity), and model 4 (additionally activities of daily living, depression, comor-bidity, and baseline K-MMSE score). Statistical signifi-cance was defined as a p value of less than 0.05 in a two-sided manner. All statistical analyses were conducted via Stata version 13.0 (College Station, TX; StataCorp LP).
Results
Baseline characteristics
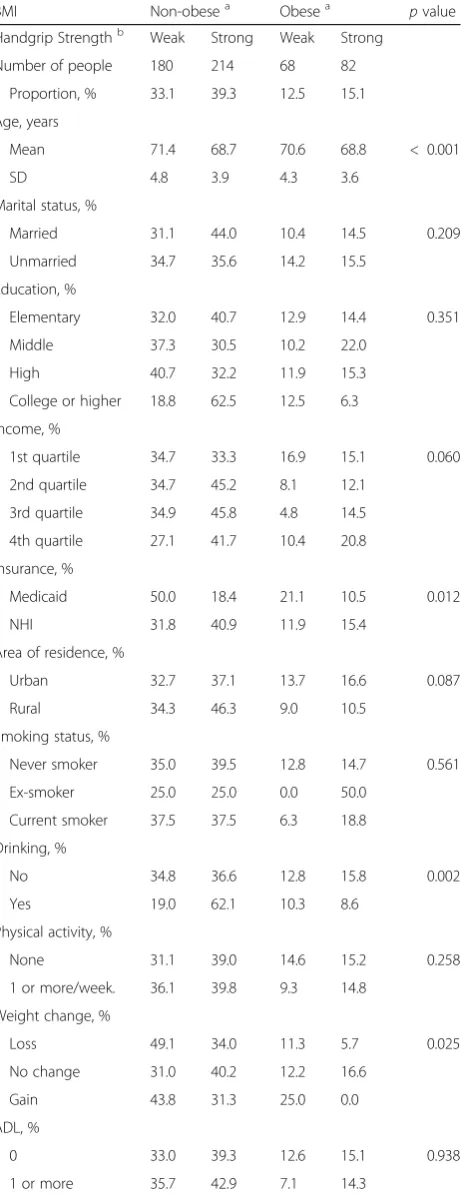
The descriptive characteristics of the study population dur-ing the first wave in 2006 are presented in Table1. The dis-tribution of individuals according to BMI and handgrip strength was 33.1% for non-obese with weak handgrip strength, 39.3% for non-obese with strong handgrip strength, 12.5% for obese with weak handgrip strength and 15.1% for obese with strong handgrip strength. Among the four groups divided by BMI and handgrip strength, those with strong handgrip strength were younger compared to those with weak handgrip strength. Non-obese and obese women with strong handgrip were younger than those with weak handgrip strength. Mean ages were 68.7 and 68.8 years in non-obese and obese women with strong handgrip strength, while 71.4 and 70.6 years in non-obese and obese women with weak handgrip strength, respectively. Obese women with strong handgrip strength were likely to be less depres-sive and more physically active than obese women with weak handgrip strength. There was no significant difference in baseline K-MMSE score at baseline according to the handgrip strength and obesity. Furthermore, a sensitivity analysis of the characteristics between study participants and non-participants are shown in (Additional file1: Table S1) There was a significance difference in age, area of residence, activities of daily living, and baseline K-MMSE score among participants and non-participants (allpvalues < 0.05).
Association between handgrip strength with BMI and development of cognitive impairment
(pvalue = 0.013 in model 4) (see Additional file2). Strong handgrip strength was associated with reduced likelihood of developing cognitive decline compared to weak hand-grip strength in obese women (adjusted odds ratio, aOR 0.23, 95% confidence interval, CI 0.08–0.66) (Table 2). Strong handgrip strength in non-obese women did not show the significant association with cognitive decline (aOR 1.26, 95% CI 0.75–2.13).
Association between handgrip tertiles according to BMI and cognitive impairment
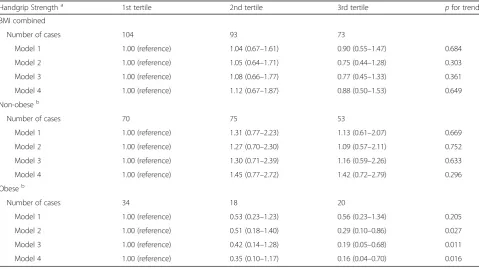
The risk for cognitive impairment was not significantly different according to tertiles of handgrip strength in the total study population (Table3). However, among obese women, those with the highest tertile of handgrip strength had reduced likelihood of developing cognitive impairment compared to the lowest tertile of handgrip strength (aOR 0.16, 95% CI 0.04–0.70). Furthermore, there was a significant linear trend between handgrip strength and the risk of cognitive decline among obese women (p for trend 0.016). Such associations were not observed in non-obese women.
Association between handgrip strength with BMI and change in K-MMSE score
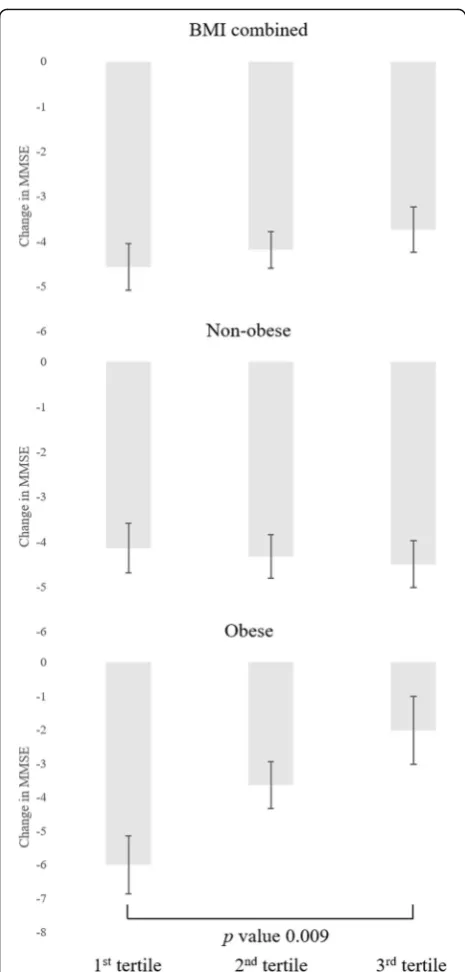
The association between handgrip strength with BMI and the degree of cognitive function decline calculated by difference in K-MMSE scores were presented in Fig.2. The highest tertile handgrip strength was significantly associated with smaller declines in K-MMSE scores compared to the lowest tertile handgrip strength in obese women (pvalue 0.009), while the highest tertile of handgrip strength did not in non-obese women. Further-more, there was a notable linear trend between the de-gree of cognitive function decline and handgrip strength among obese women (pfor trend 0.048).
Table 1Descriptive characteristics of study participants divided by BMI and handgrip strength
BMI Non-obesea Obesea
pvalue Handgrip Strengthb Weak Strong Weak Strong
Number of people 180 214 68 82 Proportion, % 33.1 39.3 12.5 15.1 Age, years
Mean 71.4 68.7 70.6 68.8 < 0.001 SD 4.8 3.9 4.3 3.6
Marital status, %
Married 31.1 44.0 10.4 14.5 0.209 Unmarried 34.7 35.6 14.2 15.5
Education, %
Elementary 32.0 40.7 12.9 14.4 0.351 Middle 37.3 30.5 10.2 22.0
High 40.7 32.2 11.9 15.3 College or higher 18.8 62.5 12.5 6.3 Income, %
1st quartile 34.7 33.3 16.9 15.1 0.060 2nd quartile 34.7 45.2 8.1 12.1
3rd quartile 34.9 45.8 4.8 14.5 4th quartile 27.1 41.7 10.4 20.8 Insurance, %
Medicaid 50.0 18.4 21.1 10.5 0.012 NHI 31.8 40.9 11.9 15.4
Area of residence, %
Urban 32.7 37.1 13.7 16.6 0.087 Rural 34.3 46.3 9.0 10.5
Smoking status, %
Never smoker 35.0 39.5 12.8 14.7 0.561 Ex-smoker 25.0 25.0 0.0 50.0
Current smoker 37.5 37.5 6.3 18.8 Drinking, %
No 34.8 36.6 12.8 15.8 0.002 Yes 19.0 62.1 10.3 8.6
Physical activity, %
None 31.1 39.0 14.6 15.2 0.258 1 or more/week. 36.1 39.8 9.3 14.8
Weight change, %
Loss 49.1 34.0 11.3 5.7 0.025 No change 31.0 40.2 12.2 16.6
Gain 43.8 31.3 25.0 0.0 ADL, %
0 33.0 39.3 12.6 15.1 0.938 1 or more 35.7 42.9 7.1 14.3
Table 1Descriptive characteristics of study participants divided
by BMI and handgrip strength(Continued)
BMI Non-obesea Obesea
pvalue Depression, %
No 28.0 43.7 10.5 17.8 0.001 Yes 41.4 32.3 15.2 11.0
Comorbidity, %
0 31.3 43.5 11.8 13.4 0.273 1 or more 34.8 35.5 13.1 16.7
Baseline K-MMSE
Mean 26.3 26.7 26.5 26.8 0.072 SD 1.7 1.7 1.6 1.6
a
non-obese, BMI < 25 kg/m2
; obese, BMI≥25 kg/m2 b
Handgrip strength: weak, lower half, < 18.5 kgF; strong, upper half,≥18.5 kgF Acronyms:BMIbody mass index,K-MMSEKorea Mini-mental state examination,
Change in handgrip strength and cognitive impairment We evaluated the association weakened handgrip strength and cognitive impairment at fifth wave among those who had strong handgrip strength at first wave (n= 137) re-gardless of obesity (Table4). Weakened handgrip strength was associated with increased risk of cognitive impairment (aOR 2.28, 95% CI 1.23–4.24) compared to maintained handgrip strength.
Discussion
In this longitudinal study, we have demonstrated that strong handgrip strength was associated with lower risk of cognitive impairment compared to weak handgrip strength among obese women. Meanwhile, strong handgrip strength was not associated with lower risk of cognitive impairment in non-obese women. Moreover, decline in handgrip strength was significantly associated with cognitive impairment. Table 2Associations between handgrip strength with BMI and cognitive decline
BMIa Non-obese Obese Pinteraction
Handgrip Strengthb Weak Strong Weak Strong Number of cases 94 105 39 32
Model 1 1.00 (reference) 1.15 (0.71–1.84) 1.00 (reference) 0.66 (0.32–1.38) 0.065 Model 2 1.00 (reference) 1.04 (0.63–1.73) 1.00 (reference) 0.39 (0.17–0.92) 0.029 Model 3 1.00 (reference) 1.13 (0.67–1.88) 1.00 (reference) 0.28 (0.11–0.72) 0.025 Model 4 1.00 (reference) 1.26 (0.75–2.13) 1.00 (reference) 0.23 (0.08–0.66) 0.013
a
non-obese, BMI < 25 kg/m2
; obese, BMI≥25 kg/m2 b
Handgrip strength: weak, lower half, < 18.5 kgF; strong, upper half,≥18.5 kgF
Model 1: odds ratio by logistic regression analysis adjusted for age (95% confidence interval) Model 2: additionally adjusted for marital status, education, income, insurance, and area of residence Model 3: additionally adjusted for smoking status, drinking, physical activity, and weight change
Model 4: additionally adjusted for activities of daily living, depression, comorbidity, and baseline K-MMSE score
Pfor interaction of BMI and handgrip strength for cognitive impairment Acronyms: BMI, body mass index
Table 3Associations between handgrip strength with BMI and cognitive decline according to handgrip strength tertiles and obesity
Handgrip Strengtha 1st tertile 2nd tertile 3rd tertile
pfor trend BMI combined
Number of cases 104 93 73
Model 1 1.00 (reference) 1.04 (0.67–1.61) 0.90 (0.55–1.47) 0.684 Model 2 1.00 (reference) 1.05 (0.64–1.71) 0.75 (0.44–1.28) 0.303 Model 3 1.00 (reference) 1.08 (0.66–1.77) 0.77 (0.45–1.33) 0.361 Model 4 1.00 (reference) 1.12 (0.67–1.87) 0.88 (0.50–1.53) 0.649 Non-obeseb
Number of cases 70 75 53
Model 1 1.00 (reference) 1.31 (0.77–2.23) 1.13 (0.61–2.07) 0.669 Model 2 1.00 (reference) 1.27 (0.70–2.30) 1.09 (0.57–2.11) 0.752 Model 3 1.00 (reference) 1.30 (0.71–2.39) 1.16 (0.59–2.26) 0.633 Model 4 1.00 (reference) 1.45 (0.77–2.72) 1.42 (0.72–2.79) 0.296 Obeseb
Number of cases 34 18 20
Model 1 1.00 (reference) 0.53 (0.23–1.23) 0.56 (0.23–1.34) 0.205 Model 2 1.00 (reference) 0.51 (0.18–1.40) 0.29 (0.10–0.86) 0.027 Model 3 1.00 (reference) 0.42 (0.14–1.28) 0.19 (0.05–0.68) 0.011 Model 4 1.00 (reference) 0.35 (0.10–1.17) 0.16 (0.04–0.70) 0.016
a
Handgrip strength: 1st tertile (≤17.5 kgF), 2nd tertile (18.0 to 20.5 kgF), and 3rd tertile (≥20.8 kgF) b
non-obese, BMI < 25 kg/m2
; obese, BMI≥25 kg/m2
Model 1: odds ratio by logistic regression analysis adjusted for age (95% confidence interval) Model 2: additionally adjusted for marital status, education, income, insurance, and area of residence Model 3: additionally adjusted for smoking status, drinking, physical activity, and weight change
Our results are in agreement with previous studies that have shown that strong handgrip strength was pro-tectively associated with cognitive decline [12, 13]. In a cross-sectional study, mild cognitive impairment was
associated with weak handgrip strength [12]. A longitu-dinal study among 2160 Mexican Americans aged over 65 years have also shown that the highest handgrip strength quartile was associated with better cognitive function over 7 years [13]. A study from the Rush Mem-ory and Aging Project has also reported that strong muscle strength was associated with decreased risk of Alzheimer’s disease and mild cognitive impairment [24]. The Rush Memory and Aging Project assessed compre-hensive muscle strength with measurement of nine muscle groups including handgrip strength. However, both longitudinal studies adjusted for BMI as a covariate and did not stratify the subjects according to obesity.
Several possible mechanisms may explain the associ-ation between handgrip strength and cognitive function. First, weak handgrip strength may be an early sign of cog-nitive impairment, as handgrip strength could be reflected by change of nervous system activity or white matter in-tegrity [25]. A prospective study among 555 subjects aged 85 years at baseline revealed that better cognitive perform-ance for attention and processing speed was significantly associated with both stronger and slower decline in hand-grip strength [11]. The authors suggested that cognitive function may precede muscle weakness, which could be explained by the fact that strong handgrip strength needs better neuromuscular coordination under well-operated executive functions, especially in the frontal lobe [25]. In our study, weakened handgrip strength was associated with cognitive impairment compared to sustained strong handgrip strength, suggesting that weakened handgrip strength could precede cognitive impairment. Therefore, handgrip strength could be a simple and useful marker in predicting future cognitive impairment.
Second, weak muscle strength and cognitive impairment may share common pathophysiological pathways such as systemic inflammation, insulin resistance and oxidative Fig. 2Adjusted means of change in K-MMSE scores according to
handgrip tertiles and obesity. Non-obese, BMI < 25 kg/m2; obese,
BMI≥25 kg/m2.Handgrip strength: 1st tertile (
≤17.5 kgF), 2nd tertile (18.0 to 20.5 kgF), and 3rd tertile (≥20.8 kgF). Adjusted mean values adjusted for age, marital status, education, income, insurance, area of residence smoking status, drinking, physical activity, activities of daily living, depression, comorbidity, and baseline K-MMSE score,p-value calculated by linear regression analysis. Black bar indicates standard error. Acronyms: BMI, body mass index
Table 4Associations between change in handgrip strength and cognitive decline among those with strong handgrip strength
Change in Handgrip Strengtha Maintained Weakened Number of cases 68 69
Model 1 1.00 (reference) 2.15 (1.29–3.61) Model 2 1.00 (reference) 2.13 (1.19–3.81) Model 3 1.00 (reference) 2.07 (1.13–3.79) Model 4 1.00 (reference) 2.28 (1.23–4.24)
a
Change in handgrip strength: maintained, strong handgrip strength in fifth wave; weakened, weak handgrip strength in fifth wave
Model 1: odds ratio by logistic regression analysis adjusted for age (95% confidence interval)
Model 2: additionally adjusted for marital status, education, income, insurance, and area of residence
Model 3: additionally adjusted for smoking status, drinking, physical activity, and weight change
stress, all of which may contribute to both weak muscle strength and cognitive impairment [26, 27]. Furthermore, factor related to sociodemographics [28], depressive symp-toms, health behavior or nutritional state may also affect the risk of cognitive impairment according to muscle strength. Specifically, increased physical activity is highly associated with handgrip strength [29], while also attenuating cognitive decline by the promotion of increased neuroplasty and cere-bral blood flow [30]. Previous studies have shown that under-nutrition is associated with weak handgrip strength as well as cognitive impairment in older adults [31].
Our study showed that strong handgrip strength was associated with lower risk of cognitive impairment in obese women, but not in non-obese women. This dis-crepancy in association of handgrip strength and cogni-tive impairment according to obesity could be explained by differences of body composition [32]. Participants with high BMI who have strong handgrip strength may have greater muscle mass and less fat mass compared to those with weak handgrip strength. On the other hand, obese participants with weak handgrip strength may have low muscle mass and high fat mass, a state referred to sarcopenic obesity. Excess body fat has previously been shown to be associated with brain atrophy [33] and reduction of hippocampal function through alteration in deoxyribonucleic acid methylation of memory-associated genes [34]. Sarcopenia may also aggravate the risk of cognitive impairment via decreased secretion of cyto-kines such as insulin-like growth factors [35].
Several limitations must be considered upon interpreting out results. First, the number of subjects was relatively small and may thus lack sufficient statistical power. Our re-sults cannot be generalized to men as the study population was limited to women. Second, selection bias of the study population may exist considering of different baseline char-acteristics between participants and non-participants. People with poor health conditions are more likely to have passed away or not respond during the fifth wave. Third, BMI was measured using self-reported height and weight. Particularly, as obesity determined by self-reported values yielded high specificity but low sensitivity, there may have been an underestimation of obese individuals. In a previ-ous study using the National Health and Nutrition Exam-ination Survey, there was an average−0.67 (SD, 0.04) kg/ m2 in difference between self-reported and measured BMI values in women. However, there were no difference in the association between self-reported BMI-defined obesity and obesity-related markers compared to associ-ation between measured BMI-defined obesity and obesity-related markers, suggesting that self-reported BMI is sufficiently acceptable for epidemiological studies [36]. In addition, we could consider applying high BMI threshold for obesity in older adults because of the low risk of cogni-tive decline [24] and mortality [37] in overweight groups
or due to height reduction [38]. Moreover, other measures of body composition, particularly the proportions of fat and muscle mass, would be useful in further investigating the association between obesity and cognitive function.
Fourth, although the modality of exercise may be an important factor in the association between handgrip strength and cognitive function, we could not adjust for this potential confounder due to the lack of information. Fifth, while MMSE is a widely used cognitive test, it is insensitive detecting early stages of cognitive decline [39], and thus other measurements of cognitive impair-ment in future studies would be beneficial. Sixth, al-though measurement of handgrip strength is a useful and simple method to assess upper extremity muscle strength, we could not reflect other aspects of muscle strength, such as quadriceps strength [40] due to the lack of data. Seventh, confounding factors that affect handgrip strength over time such as nutritional state or presence of arthritis in hand could not be considered [41]. Finally, handgrip strength was determined by the maximum value of two measurements rather than three. Future studies using handgrip strength measured by the best of three measurements are needed.
Despite these limitations, to our knowledge, this is first study to elucidate the association between handgrip strength and cognitive function stratified by obesity. In addition, we used a national representative survey. KLoSA is conducted by the Ministry of Labor of Korea from 2006 enrolled participants who randomly selected by a multistage, stratified probability sampling among of community-dwelling Koreans aged ≥45 years after con-sideration of age, sex, and geographic area [42].
Conclusions
In conclusion, strong handgrip strength in obese women was associated with reduced risk of cognitive impairment. Handgrip strength may be a simple and useful marker for predicting future cognitive impairment among obese women. Further research is needed to determine why the relationship between grip strength and cognitive function was more prominent in obese groups.
Additional files
Additional file 1:Table S1.Sensitivity analysis of the descriptive characteristics between study participants with non-participants. (DOCX 16 kb)
Additional file 2:Figure S1.Predictive margins for cognitive impairment according to handgrip strength and obesity. Predictive margins calculated by logistic regression analysis after adjustments for age, marital status, education, income, insurance, area of residence, smoking status, drinking, physical activity, weight change, activities of daily living, depression, comorbidity, and baseline K-MMSE score. Obesity: non-obese, BMI < 25 kg/m2; obese, BMI≥25 kg/m2. Handgrip strength:
Abbreviations
BMI:Body mass index; KLoSA: Korean Longitudinal Study of Aging; K-MMSE: Korean Mini-Mental State Examination
Availability of data and materials
The datasets generated and analyzed during the current study are available from the corresponding authors on reasonable request.
Authors’contributions
SM-J and SG-C contributed study concept and design, analysis and interpret-ation, drafting and critical revision of the manuscript. SM-J and SG-C designed statistical analysis. SJ-K, KW-K and SM-K critically revised and approved the manuscript. SM-P had full access to all of the data in the study and takes re-sponsibility for this study. All authors read and approved the final manuscript.
Ethics approval and consent to participate
This study was approved by Seoul National University Hospital’s Institutional Review Board (IRB number: 1508–079-695) and consent to participate is not applicable since all data was derived from the publicly available KLoSA database [17].
Consent for publication
Not applicable.
Competing interests
The authors declare that they have no competing interests.
Publisher’s Note
Springer Nature remains neutral with regard to jurisdictional claims in published maps and institutional affiliations.
Author details
1Department of Family Medicine, Seoul National University Hospital, 101
Daehak-ro, Jongno-gu, Seoul, South Korea.2Department of Biomedical Sciences, Seoul National University Graduate School, 101 Daehak-ro, Jongno-gu, Seoul, South Korea.3Korea Institute for Health and Social Affairs, Sejong, South Korea.
Received: 12 November 2017 Accepted: 13 September 2018
References
1. Chen Y, Denny KG, Harvey D, Farias ST, Mungas D, DeCarli C, et al. Progression from normal cognition to mild cognitive impairment in a diverse clinic-based and community-based elderly cohort. Alzheimers Dement. 2017;13:399–405.
2. Kim S, Kim Y, Park SM. Body mass index and decline of cognitive function. PLoS One. 2016;11(2):e0148908.https://doi.org/10.1371/journal. pone.0148908.
3. Tolppanen AM, Ngandu T, Kareholt I, Laatikainen T, Rusanen M, Soininen H, Kivipelto M. Midlife and late-life body mass index and late-life dementia: results from a prospective population-based cohort. J Alzheimers Dis. 2014; 38(1):201–9.https://doi.org/10.3233/JAD-130698.
4. Anstey KJ, Cherbuin N, Budge M, Young J. Body mass index in midlife and late-life as a risk factor for dementia: a meta-analysis of prospective studies. Obes Rev. 2011;12(5):e426–37. https://doi.org/10.1111/j.1467-789X.2010.00825.x.
5. Suemoto CK, Gilsanz P, Mayeda ER, Glymour MM. Body mass index and cognitive function: the potential for reverse causation. Int J Obes. 2015; 39(9):1383–9.https://doi.org/10.1038/ijo.2015.83.
6. Roberts HC, Denison HJ, Martin HJ, Patel HP, Syddall H, Cooper C, Sayer AA. A review of the measurement of grip strength in clinical and
epidemiological studies: towards a standardised approach. Age Ageing. 2011;40(4):423–9.https://doi.org/10.1093/ageing/afr051.
7. Leong DP, Teo KK, Rangarajan S, Lopez-Jaramillo P, Avezum A, Orlandini A, Seron P, Ahmed SH, Rosengren A, Kelishadi R, et al. Prognostic value of grip strength: findings from the prospective urban rural epidemiology (PURE) study. Lancet. 2015;386(9990):266–73. https://doi.org/10.1016/S0140-6736(14)62000-6.
8. Ling CH, Taekema D, de Craen AJ, Gussekloo J, Westendorp RG, Maier AB: Handgrip strength and mortality in the oldest old population: the Leiden 85-plus study. CMAJ 2010, 182(5):429–435.
9. Xu L, Hao YT. Effect of handgrip on coronary artery disease and myocardial infarction: a Mendelian randomization study. Sci Rep. 2017;7(1):954. 10. Lawman HG, Troiano RP, Perna FM, Wang CY, Fryar CD, Ogden CL. Associations of relative handgrip strength and cardiovascular disease biomarkers in U.S. adults, 2011-2012. Am J Prev Med. 2016;50(6):677–83.
https://doi.org/10.1016/j.amepre.2015.10.022.
11. Taekema DG, Ling CH, Kurrle SE, Cameron ID, Meskers CG, Blauw GJ, Westendorp RG, de Craen AJ, Maier AB. Temporal relationship between handgrip strength and cognitive performance in oldest old people. Age Ageing. 2012;41(4):506–12.https://doi.org/10.1093/ageing/afs013. 12. Jang JY, Kim J. Association between handgrip strength and cognitive
impairment in elderly Koreans: a population-based cross-sectional study. J Phys Ther Sci. 2015;27(12):3911–5.https://doi.org/10.1589/jpts.27.3911. 13. Alfaro-Acha A, Snih SA, Raji MA, Kuo Y-F, Markides KS, Ottenbacher KJ. Handgrip strength and cognitive decline in older Mexican Americans. J Gerontol A Biol Sci Med Sci. 2006;61(8):859–65.https://doi.org/10.1093/ gerona/61.8.859.
14. Fritz NE, McCarthy CJ, Adamo DE. Handgrip strength as a means of monitoring progression of cognitive decline - a scoping review. Ageing Res Rev. 2017;35:112–23.https://doi.org/10.1016/j.arr.2017.01.004.
15. Rijk JM, Roos PR, Deckx L, van den Akker M, Buntinx F. Prognostic value of handgrip strength in people aged 60 years and older: a systematic review and meta-analysis. Geriatr Gerontol Int. 2016;16(1):5–20.https://doi.org/10. 1111/ggi.12508.
16. Liao K-H. Hand grip strength in low, medium, and high body mass index males and females. Middle East J Rehabil Health. 2016;3(1).https://doi.org/ 10.17795/mejrh-33860.
17. Korea Labor Institute. User Guide for. KLoSA. In: 2007; 2007. 18. Kim K-N, Lee M-R, Choi Y-H, Hwang H, Oh S-Y, Park C, Hong Y-C.
Association between phthalate exposure and lower handgrip strength in an elderly population: a repeated-measures study. Environ Health. 2016;15(1):93.
19. Iinuma T, Arai Y, Fukumoto M, et al. Maximum occlusal force and physical performance in the oldest old: the Tokyo oldest old survey on Total health. J Am Geriatr Soc. 2012;60(1):68–76.https://doi.org/10.1111/ j.1532-5415.2011.03780.x.
20. Consultation WHOE. Appropriate body-mass index for Asian populations and its implications for policy and intervention strategies. Lancet. 2004; 363(9403):157–63.https://doi.org/10.1016/S0140-6736(03)15268-3. 21. Yoon K, Jang SN, Chun H, Cho SI. Self-reported anthropometric information
cannot vouch for the accurate assessment of obesity prevalence in populations of middle-aged and older Korean individuals. Arch Gerontol Geriatr. 2014;59(3):584–92.https://doi.org/10.1016/j.archger.2014.08.008. 22. Kang YND, Hahn S. A validity study on the Korean mini-mental state
examination (K-MMSE) in dementia patients. J Korean Neurol Assoc. 1997; 15(2):300–8.
23. Thomas F, Bean K, Pannier B, Oppert JM, Guize L, Benetos A. Cardiovascular mortality in overweight subjects: the key role of associated risk factors. Hypertension. 2005;46(4):654–9.https://doi.org/10. 1161/01.HYP.0000184282.51550.00.
24. Boyle PA, Buchman AS, Wilson RS, Leurgans SE, Bennett DA. Association of muscle strength with the risk of Alzheimer disease and the rate of cognitive decline in community-dwelling older persons. Arch Neurol. 2009;66(11): 1339–44.https://doi.org/10.1001/archneurol.2009.240.
25. Choudhary AK, Jiwane R, Alam T, Kishanrao SS. Grip strength and impact on cognitive function in healthy kitchen workers. Achiev Life Sci. 2016;10(2):168–74.
26. Weaver JD, Huang MH, Albert M, Harris T, Rowe JW, Seeman TE. Interleukin-6 and risk of cognitive decline: MacArthur studies of successful aging. Neurology. 2002;59(3):371–8.https://doi.org/10.1212/WNL.59.3.371. 27. Mangialasche F, Polidori MC, Monastero R, Ercolani S, Camarda C, Cecchetti
R, Mecocci P. Biomarkers of oxidative and nitrosative damage in Alzheimer's disease and mild cognitive impairment. Ageing Res Rev. 2009;8(4):285–305.
https://doi.org/10.1016/j.arr.2009.04.002.
29. Dodds R, Kuh D, Aihie Sayer A, Cooper R. Physical activity levels across adult life and grip strength in early old age: updating findings from a British birth cohort. Age Ageing. 2013;42(6):794–8.https://doi.org/10.1093/ageing/aft124. 30. Carvalho A, Rea IM, Parimon T, Cusack BJ. Physical activity and cognitive
function in individuals over 60 years of age: a systematic review. Clin Interv Aging. 2014;9:661–82.https://doi.org/10.2147/CIA.S55520.
31. Shawky Khater M, Fawzy Abouelezz N. Nutritional status in older adults with mild cognitive impairment living in elderly homes in Cairo, Egypt. J Nutr Health Aging. 2011;15(2):104–8.https://doi.org/10.1007/s12603-011-0021-9. 32. Levine ME, Crimmins EM. Sarcopenic obesity and cognitive functioning: the
mediating roles of insulin resistance and inflammation? Current Gerontology and Geriatrics Research. 2012;2012:7.
33. Gustafson D, Lissner L, Bengtsson C, Bjorkelund C, Skoog I. A 24-year follow-up of body mass index and cerebral atrophy. Neurology. 2004;63(10):1876– 81.https://doi.org/10.1212/01.WNL.0000141850.47773.5F.
34. Heyward FD, Gilliam D, Coleman MA, Gavin CF, Wang J, Kaas G, Trieu R, Lewis J, Moulden J, Sweatt JD. Obesity weighs down memory through a mechanism involving the Neuroepigenetic dysregulation of Sirt1. J Neurosci. 2016;36(4): 1324–35.https://doi.org/10.1523/JNEUROSCI.1934-15.2016.
35. Ashpole NM, Sanders JE, Hodges EL, Yan H, Sonntag WE. Growth hormone, insulin-like growth factor-1 and the aging brain. Exp Gerontol. 2015;68:76– 81.https://doi.org/10.1016/j.exger.2014.10.002.
36. A. MM, M. DR, B. HF: Comparison of self-reported and measured BMI as correlates of disease markers in U.S. adults. Obesity 2007, 15(1):188–188. 37. Flicker L, McCaul KA, Hankey GJ, Jamrozik K, Brown WJ, Byles JE, Almeida
OP. Body mass index and survival in men and women aged 70 to 75. J Am Geriatr Soc. 2010;58(2):234–41.
38. Han TS, Tajar A, Lean MEJ. Obesity and weight management in the elderly. Br Med Bull. 2011;97(1):169–96.https://doi.org/10.1093/bmb/ldr002. 39. Tombaugh TN, McIntyre NJ. The mini-mental state examination: a
comprehensive review. J Am Geriatr Soc. 1992;40(9):922–35.
40. Chen W-L, Peng T-C, Sun Y-S, Yang H-F, Liaw F-Y, Wu L-W, Chang Y-W, Kao T-W. Examining the association between quadriceps strength and cognitive performance in the elderly. Medicine. 2015;94(32):e1335.https://doi.org/10. 1097/MD.0000000000001335.
41. Granic A, Davies K, Jagger C, Kirkwood TB, Syddall HE, Sayer AA. Grip strength decline and its determinants in the very old: longitudinal findings from the Newcastle 85+ study. PLoS One. 2016;11(9):e0163183.https://doi. org/10.1371/journal.pone.0163183.
42. Jang SN, Kawachi I, Chang J, Boo K, Shin HG, Lee H, Cho SI. Marital status, gender, and depression: analysis of the baseline survey of the Korean longitudinal study of ageing (KLoSA). Soc Sci Med. 2009;69(11):1608–15.