70
Vibration Analysis Of Rotating Machines With
Case Studies
Sagar Sutar, Vilas Warudkar, Rajendra Sukathankar
Abstract: In recent trends the industries are transforming from preventive maintenance to predictive maintenance. It essentially involves human sensory with mixture of sophisticated instruments to inspect the machines while running. Vibration analysis is the one of the most effective tool used to check the health of plant machinery and diagnose the causes. The health of machine is checked by routine or continuous vibration monitoring with sophisticated instruments, which will give you early indication of the failure and can take countermeasures to avoid catastrophic failure.In this thesis work I have studied the common causes that produce vibrations in rotating machines. Every machinery problem produces specific spectrum pattern, these problems are identified with frequency and phase analysis. Here I have explained in details about frequency analysis, phase analysis, unbalancing and procedure of Balancing. Also the vibration measurement and data collection equipments as well as acceptance standards are discussed. The different case studies that I carried out at different industries contains the Balancing problems, misalignment issues and Resonance, which we removed by Balancing, alignment across coupling and dynamic vibration absorbers. In one of the case study we made the decision for location of CMM machine through vibration analysis.
Index Points: Predictive maintenance, condition monitoring, vibration monitoring and analysis, frequency analysis, vibration analysis instrumentation, Acceptance criteria, case studies
————————————————————
1
INTRODUCTION
Vibration monitoring reveals knowledge of machines condition and its rate of change, which can be ascertained by selecting a suitable parameter for measuring deterioration and recording its value at on a routine or continuous basis. The values are measured strictly while the machine is running. The data obtained may then be analyzed to give a warning on failure. This activity is called as condition monitoring. Most of the defects encountered in the rotating machinery give rise to a distinct vibration pattern (vibration signature analysis techniques).Vibration Monitoring has the ability to record and identify vibration “Signatures” which makes the technique so powerful for monitoring rotating machinery. Vibration analysis is normally applied by using transducers to measure acceleration, velocity or displacement. The choice largely depends on the frequencies being analyzed. The vibration analysis consists of Vibration monitoring and Analysis. Vibration monitoring: The vibration monitoring usually consists of Transducers attached at specific location and at specific direction. These are contact or non-contact type and works on principle of electromagnet or capacitive or strain gauge. From different monitoring technique, vibration monitoring has gaining a large importance due to following fundamental factors
1) All rotation and reciprocating machines vibrate due to some defect
2) When there is problem the vibration get changed
Therefore vibration monitoring shows the health of the machine.
Vibration Analysis: Different mechanical and electrical faults produce different vibration signature. Careful scrutiny and deep study eliminates different possibilities and concludes to single fault. A logical and systematic approach has proved successful in diagnosing the basic causes.
2
ACCEPTANCE
CRITERIA
FOR
VIBRATIONS
The following general principles are commonly used to evaluate overall vibration measurement values
2.1 ISO 10816-1 standard comparison
Figure 2-1 ISO 10816-1 standards chart
For evaluation of machine problems the ISO 10816-1 standard provides guidelines for machines operating in the frequency range of 10 to 10000 Hz (600 to 60,000 cpm) .These guidelines consists of machines which are small, medium, large, direct coupled, motors, pumps, generators ,turbomachinery fans and compressors. Some machines are directly coupled to motor or some through gear boxes. Some machines shafts are inclined or horizontal or vertical, some are rigidly mounted or some are mounted on flexible mounts.
2.2 Trend Comparison
71
2.3 Baseline Comparison
Measurement records include a Baseline reading. Machinery baselines are established on machines during acceptance testing or Machine overhaul. If there is no machine history or machine type knowledge acceptance should be upon the relevant standards for that class or type of machine.
2.4 Comparison with other machinery
Whenever there are several identical machines operating under the same operating conditions, Vibration measurement severity must be carried out by comparing vibration amplitudes taken at the same location and direction on each machine.
2.5 Manufacturers Limit
Some of the OEM provides the Machines specific commissioning) levels. The measured vibration values can be compared with the acceptable overall vibration values provided by the manufacturer and the severity of the vibration is decided.
2.6 Mutual comparison
Measure several machines of a similar type under the same condition and judge the results by mutual comparison.
3
VIBRATION
MEASUREMENT
INSTRUMENTATION
The types of measurement devices used include accelerometers, velocity and displacement transducers .Read out devices include vibration meters, spectrum analyzers as well as on line and protection systems.
3.1 Transducers
Transducers are the device that converts the mechanical signals into electrical signals. These transducers use the principle of piezoelectric, electromagnetism, capacitance or strain gauge. Mostly the vibration signals are converted into the voltage which is amplified and calibrated. Following are the basic types of transducers.
Accelerometers: Accelerometers are the most widely used transducer for vibration measurement because of their relative simplicity, Robustness and Reliability. As the acceleration increases by square of frequency, accelerometers are used for higher frequency measurement like Bearing, Gear Box.
Velocity Transducers: This relative movement produces voltage which is proportional to the velocity of the object on which it is mounted.
Displacement Transducers: These are generally known as proximity probes, these transducers are limited in application but wherever applicable they are extremely useful and important. They are generally used where a smooth running of rotor is very critical.
3.2 FFT Analyser:
FFT is most commonly tool used for vibration analysis. As we measure the real time data in which the plot is against amplitude Vs. time, FFT converts this into Frequency Vs
Amplitude. Amplitude shows the severity of the fault and frequency shows the origin of the fault.
4
CASE STUDY 1
Mallak specialties are manufacturers and exporters of dyes and pigments .They have manufacturing plant located in Mahad, Maharashtra. The hammer mill here used to make powder form of pigments. After replacement of Hammers with new one they found that the machine is vibrating. Hence they called SVAR associates for consultation.
4.1 Observation Table
MEASUREMENT OVERALL VIBRATION
LEVELS VELOCITY (mm/sec) RMS
POINT POSITION
Before Balancing After Balancing A
V 11.3 3.23
H 12.92 2.59
A 7.28 1.81
B
V 5.2 2.47
H 6.67 1.76
A 9.61 1.21
C
V 54.79 7.42
H 44.35 7.29
A 38.49 6.86
D
V 19.65 3.23
H 20.65 2.84
A 50.23 2.91
Figure 4-2 FFT graph at Point C (Vertical) before balancing
Mill
A
B C
D
72
Figure 4-3 FFT graph at Point C (Horizontal) before
balancing
Figure 4-4 FFT graph at Point D (Vertical) before balancing
Figure 4-5 FFT graph at Point D (Horizontal) before
balancing
4.2 Conclusion
From the FFT graph it is found that the peak is observed at 1X RPM in vertical and horizontal direction. This shows that there is unbalance in the rotor. When checking the impeller of blower on ABRO balancing machine it is found that there is unbalance of 192 Gms.
4.3 Problem Rectification
Figure 4-6 Actual photograph during Balancing
Figure 4-7 FFT graph at Point C (Vertical) after balancing
Figure 4-8 FFT graph at Point C (Horizontal) after balancing
Figure 4-9 FFT graph at Point D (Vertical) after balancing
Figure 4-10 FFT graph at Point D (Horizontal) after balancing
4.4 Results
1. The Overall Vibration Levels were initially Unacceptable as per ISO 10816-1 standard. 2. There was an Unbalance in Hammer Wheel, which
was corrected by adding 192 Gms.
3. The overall vibration levels came down thereafter as tabulated above & are now ACCEPTABLE As per standard ISO-10816-1
5
CASE STUDY 2
Uttam Galva steel ltd, Khopoli (Maharashtra) is a manufacturer and supplier of Galvanized plain sheet, Light weight and high quality steel sheet and Pre painted steelcoil.MVRE blower is used in steel plant for creating vacuum in system for condenser vapour recovery. This works on variable speed drive to create desired vaccum in the system .Hence speed needs to vary as per demand.
73
5.1 Observations
Figure 5-2 FFT graph Bearing D before Balancing
5.2 Conclusion
From the FFT graph it is found that the peak is observed at 1X RPM in vertical and horizontal direction. This shows that there is unbalance in the rotor. When checking the impeller of blower on ABRO balancing machine it is found that there is unbalance of 91 gms.
5.3 Balancing of Rotor
Figure 5-3 Actual photograph of Balancing
Figure 5-4 FFT graph of Bearing D in Vertical After balancing
5.4 Results
Initially the overall vibration levels were on the Higher Side. It is to be strictly noted that operator should be instructed for critical speed of 2000 rpm. Hence Fan should never be allowed to run in the range of 1900 to 2100 rpm for long duration as this leads to slowly increase in vibrations. The overall vibration levels are now ACCEPTABLE as per ISO 10816-1 standard after balancing.
6
CASE STUDY 3
A Godrej industry manufactures soaps and detergents in their plant at Ambernath, Maharashtra. In one of their cooling tower pump they had high axial vibration problem, which was observed by their vibration monitoring cell. In spite of changing motor and replacing pump vibrations remained same .Hence we were called to identify the root cause.
Figure 6-1 General arrangement of system
6.1 Observation
Figure 6-2 FFT graph at A before Balancing
Figure 6-3 FFT graph at A before Balancing
6.2 Conclusion
The overall vibration levels are UNACCEPTABLE as per ISO-10816-1. As there is Axial peaks, there is severe Misalignment in Coupling between Motor & Pump. Structure below Motor is on channels and angle which is prone to soft foot resonance and Misalignment. This should be rectified first. Phase data shows that axial phase at bearing C and D are 1500 out of phase. This confirms that there is Angular misalignment in coupling between motor & pump. Check levelling of motor on base frame properly. Correct alignment with dial gauge.
Figure 6-4 FFT graph at A after Balancing
74 Table 6-1 Overall vibration levels after Alignment
MEASUREMENT OVERALL VIBRATION LEVELS VELOCITY (mm/sec) RMS
Point Position 25.04.18 05.05.18 08.05.18 Before rectification After rectification
V 2.93 3.31 1.27
A H 1.22 0.93 1.68
A 14.56 21.43 0.98
V 3.25 4.27 1.45
B H 2.56 3.36 1.89
A 12.69 19.20 0.89
V 0.87 0.84 0.67
C H 1.78 1.83 1.32
A 0.49 1.04 0.56
V 0.74 0.74 0.58
D H 1.03 0.96 0.71
A 0.74 1.18 0.67
6.3 Results and Recommendations
The overall vibration levels are now ACCEPTABLE as per ISO-10816-1. There was severe Misalignment in Coupling between Motor & Pump, which was corrected. Structure below Motor is on channels & angle had welding cracks which was rectified. There was considerable improvement in machine vibrations after rectification.
7
CASE STUDY 4
Syndicate wiper is the largest manufacturers of windshield wiper arms and Blades in India .They have manufacturing unit in Mahape, Mumbai. They wanted to install CMM machine at their manufacturing location .For that they had two locations viz LAB area on first floor and CNC machine area on ground floor and they wanted to select one of those areas for installation of CMM on the basis of vibrations
Figure 7-1 General arrangement of locations
7.1 Observations
Table 7-1 Overall Vibration levels at LAB area
MEASUREMENT OVERALL VIBRATION LEVELS
Point Direction Acceleration „G‟ Peak to Peak
1 Z 0.0039
2 Z 0.0065
3 Z 0.0099
4 Z 0.0072
5 Z 0.0067
6 Z 0.0065
7 Z 0.0031
8 Z 0.0094
9 Z 0.0141
Figure 7-2 Vibrations at Point 1 LAB area
Figure 7-3 Vibrations at Point 2 LAB area
Figure 7-4 Vibrations at Point 3 LAB area
Figure 7-5 Vibrations at Point 4 LAB area
75 Figure 7-7 Vibrations at Point 6 LAB area
Figure 7-8 Vibrations at Point 7 LAB area
Figure 7-9 Vibrations at Point 8 LAB area
Figure 7-10 Vibrations at Point 9 LAB area
7.2 Permissible vibration levels
Figure 7-11 Permissible vibration levels VDI-2057 graph
7.3 Conclusion
LAB area
The spectras at all points in lab area are attached below. When we compare values at different frequencies of these spectra with VDI 2057 graph, You will notice that
acceleration is higher than VDI 2057 limits at points 2, 5 & 6. Issue of installing machine on first floor is not advisable, as possibility of vibrations from surrounding machines, with floor slab resonance is high & can even hamper Accuracy of CMM.
7.4 Observation
Table 7-2 Overall vibration levels at CNC machine area
MEASUREMENT OVERALL VIBRATION LEVELS Point Direction Acceleration „G‟ Peak to
Peak
1 Z 0.0047
2 Z 0.0002
3 Z 0.0026
4 Z 0.0044
5 Z 0.0050
6 Z 0.0019
Figure 7-12 Vibrations at Point 1 CNC area
Figure 7-13 Vibrations at Point 2 CNC area
Figure 7-14 Vibrations at Point 3 CNC area
76
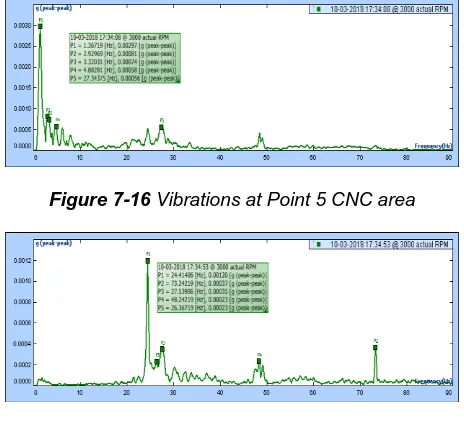
Figure 7-16 Vibrations at Point 5 CNC area
Figure 7-17 Vibrations at Point 6 CNC area
7.5 Conclusions
CNC Area
The spectras at all points in lab area are attached above. When we compare values at different frequencies of these spectra with VDI 2057 graph, you will notice that acceleration is higher than VDI 2057 limits at point 1. You can install the machine in this area by using isolation pads with natural frequency around 8 Hz. Air membrane spring type pads will take care of machine in future.
8
REFERENCES
[1]. G. Suresh Babu, Dr. V. Chittaranjan Das Condition Monitoring and Vibration Analysis of Boiler Feed Pump “International Journal of Scientific and Research Publications” Volume 3, Issue 6, June 2013
[2]. LINARAJU. a paper on “condition monitoring and vibration analysis of rotating equipment” [NCCM-2006] December 2006 page no 209-215
[3]. A.V.Barkov, N.A.Barkova, and A.Yu. Azovtsev, “Condition Monitoring and diagnostics of Rotating Machines Using Vibration", Vast, Inc., St. Petersburg, Russia, 1997.
[4]. Simmons G (1992) “Journal of Mechanical Energy Science” I Mech E, Vol.206, No.1.
[5]. R.K.Biswas “vibration based condition monitoring of rotating machines” national conference on condition monitoring [NCCM-2006] December 2006 page no 34-40.
[6]. Vyas, R. K., & Pophaley, M. (2010). Plant maintenance management practices in automobile industries: A retrospective literature review. Journal of Industrial Engineering and Management, 512-541.
[7]. E.Downham, „Vibration monitoring and wear prediction‟ proceeding of 2nd International conference on vibration in rotary machinery, IMechE, pp. 29-33, 1980.
[8]. N. Tandon and A. Choudhury, „A theoretical model to predict vibration response of rolling bearings to distributed defects under radial load‟ Journal of Vibrations and Acoustics, Vol. 120, pp. 214-20, 1998.
[9]. Ali, M. K., Youssef, M. H., Hammad, M. A., Alaa, A., & Butch, E. (2009). A study on fault diagnosis by vibration analysis at different loading and speeding conditions. Aerospace science and aviation technology, SAT-13. Cairo: Military Technical College
[10]. G. Suresh Babu, Dr. V. Chittaranjan Das,‟ Condition Monitoring and Vibration Analysis of Boiler Feed Pump‟ International Journal of Scientific and Research Publications, Volume 3, Issue 6, June 2013, ISNN 2250-3153
[11]. http://nptel.ac.in/courses/112107088/module1/lectu re37/lecture37.pdf
[12]. www.lifetime-reliability.com
free-articles/maintenancemanagement/Fundamentals_o f_Vibration_Measurement_and_Analysis_Explaine d
[13]. https://www.pcb.com/techsupport/docs/vib/TN_17_ VIB-0805.pdf
[14]. http://www.pcb.com/techsupport/tech_accel
[15]. https://www.endevco.com/news/newsletters/2012_ 07/tp327.pdf
[16]. http://nptel.ac.in/courses/112104040/pdf/lecture16. pdf
[17]. S.S. Rao, “Mechanical Vibration”, 4th edition prentice, Hall 2003.page 611-613
[18]. N. Tandon and A. Choudhury, „An analytical model for the prediction of the vibration response of rolling element bearings due to a localized defect‟ Journal of Sound and Vibration, Vol. 205, No. 3, pp. 275-92, 1997.
[19]. Broch.J.T(1984)“Mechanical Vibrations and Shock Measurement” Bruel & Kjaer, 2nd edition.
[20]. www.vibrationschool.com
[21]. Vibrationanalysis.co.uk