Publisher: Asian Economic and Social Society
Logistic Regression Model For Primary School Dropout Children Of Chitwan District Of Nepal
Naresh Manandhar (Assistant Professor, Department of Community Medicine, Collage of Medical Sciences, Bharatpur, Chitwan, Nepal)
A. B. Sthapit (Chairman and Professor, Central Department of Statistics, Tribhuvan University, Kirtipur, Kathmandu, Nepal)
Citation: Naresh Manandhar, A. B. Sthapit (2012): “ Logistic regression model for primary
146 Introduction
Education is the basic requirement for human development and survival of the society. It is necessary and a universal feature of society by which every generation transmits social heritage to the next generation1. Education is the principal instrument in awakening the child to cultural values and thus is the strongest force in the development and growth of a child in preparing him to be responsible, intelligent, strong and healthy citizen. Education is the means through which a society perpetuates and spreads its own culture. Education is a fundamental human right as well as a catalyst
for economic growth and human development2.
Any children after enrolment in the school left without completing the primary level education for any reason is consider as primary school dropout children. In Nepal, primary level education is from grade I to grade V. There are more than 31,000 primary schools. According to the Department of Education of Nepal in
2009, the dropout rate is 9.9% in grade I. In grades II, III, IV, and V, dropout rates are 4.4%, 4.6%, 3.9%, and 7.4%, respectively. Grade repetition rate is also high in the Primary grades, which is about 26% in grade I, and around 10% in the remaining Primary school
grades in 20093. The primary school dropout
rate is very high and highest in grade I in Nepal. At present about 80% of primary school age children are enrolled in school and 45.4% of the children enrolled in primary levels leave
schools without completing grade five4.
Methodology
The present study used a descriptive cross-sectional tracer design to identify the primary school dropout children. Children identified as dropouts in the sampled schools during one academic year were traced to their current location, and then they and their parents were interviewed to determine causes of the dropout. Sample design is one of the crucial parts of research survey, which is expected to be statistically representatives for the variables. To determine the sample size, 95% confidence
Logistic regression model for primary school dropout children of Chitwan district of Nepal
Abstract
Author (s)
Naresh Manandhar Assistant Professor, Department of Community Medicine, Collage of Medical Sciences, Bharatpur, Chitwan, Nepal. E- mail:[email protected]
A. B. Sthapit Chairman and Professor, Central Department of Statistics, Tribhuvan University, Kirtipur, Kathmandu, Nepal
Education is the principal instrument in awakening the child to cultural values and thus is the strongest force in the development and growth of a child in preparing him to be responsible, intelligent, strong and healthy citizen. In the present study, 460 sample dropout children were interviewed. The objective of the study is to find out the current dropout rates trend according to grade, age & sex and to construct a model. The maximum dropout rates 9.10% and 17.17% were observed in grade I and in the age eight years respectively. To reduce dropout rate of primary school age children, the parents should be make literate through adult literacy program and made aware & motivated regarding the importance of education.
147
interval is set with the marginal standard error of estimate at 4%. Moreover, the coefficient of variation set at 20% is used for sample size estimation.
n =
Where, no= (Z α/2 π / Φ)2
n= sample size
N= Total number of schools,
Z α/2 = normal value at 95%
π = Coefficient of variation
Φ= Standard margin of error
56 Government and 23 private schools were selected by using stratified random sampling technique from thirteen resource centers of Chitwan district of Nepal. The total of 460 dropout children, 249 boys and 211 girls, were interview by using pre-designed and pre-tested questionnaire from the selected schools. For the comparative study, same numbers of non-dropout children were also interviewed by using same questionnaire. The collected data were entered and analyzed by using SPSS software program in the computer. The objective of the study is to find out the current dropout rates trend according to grade, age and sex and to construct a model that could be useful to predict the chances of primary school dropout.
Results
In the present study, 460 sample dropout children were interviewed and for comparative study same numbers of non-dropout children were also interviewed. The maximum dropout rate (9.10%) was observed in grade I followed by grade II, III, IV and V with 6.70%, 5.49%, 5.17% and 5.03% respectively. According to age, the highest dropout rate (17.17%) was observed in age eight year followed by 15.43%, 14.35%, 13.48%, 11.09%, 10.43%, 10.00%, 5.00% and 3.04% in ages seven, six, nine, ten, eleven, twelve, thirteen & more than thirteen and five years respectively. In the present study,
drop out children of boys (54.1%)
predominated girls (45.9%).
The normal age of Primary school children is ranged from five to nine years for the grades I to V respectively. Ideally, the mean age of primary school children is supposed to be seven years. The mean age of dropout children of Primary school was 9.01 years with standard deviation of 1.95 years. The present research found that 8.0% of dropout children were due to not interest in study and more boys showed not interested in their study than girls. The present study revealed that 29.3% of parent showed apathy towards their children education. In education status of parent’s, 37.2% of father and 41.1% of mother of dropout children were illiterate. The mean number of children per parent was 2.97. The mean number of boys (2.93) was less than girls (3.01).
The univariate analysis was performed to
identify the independent association of
dependent variable dropout with independent variables individually, with the objective of testing and fitting the best model. Chi-square test was used and odds ratio and 95% confidence interval were calculated for each of the independent variables.
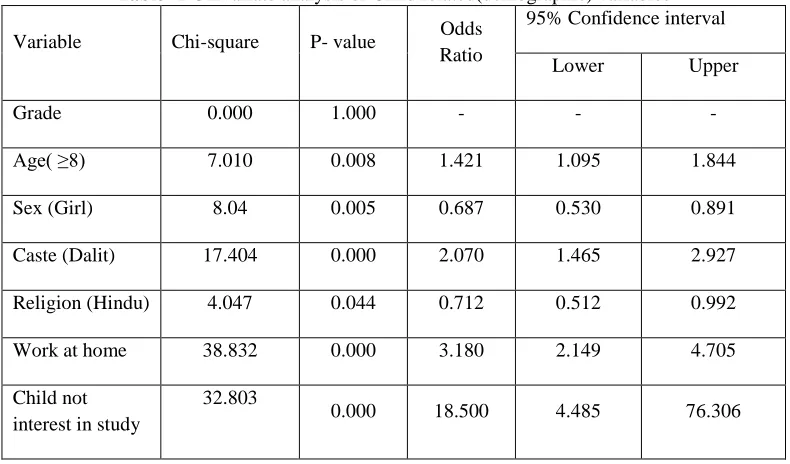
The odds ratio of the child related variables age, caste, work at home and child not interest in study were greater than one which means there was positive association with drop out. Higher the odds ratio there was more chances of dropout. The child will have more chances of dropout who have work at home since it have highest odds ratio (18.5) followed by child not interest in study (3.18) and Dalit caste (2.07). The odds ratio of child related variables sex and religion were less than one. The girl child and Hindu by religion of child will have less chance of dropout with compared to boy and non-Hindu by religion. (Table no. 1)
148
parents unaware of education were most likely dropout from primary school. (Table no. 2)
The logistic regression analysis was carried out in the present research for fitting the models since the dependent variable school dropout is dichotomous. The logistic regression analysis was carried out for child and family related variables separately.
Model Summary: The model Log likelihood of chi-square was 162.232 at 7degree of freedom and p-value was 0.000. Nagelkerke R Square was 0.176. From, Hosmer and Lemeshow Test, Chi-square was 16.512 at 8 degree of freedom and p value was 0.036.
The Wald statistics was used to test the statistical significant of estimated coefficients. From logistic regression analysis of dropout with child related variables, work at home was found to be highest significant variable at 1% level of significance followed by child not interest in study, grade and Dalit caste. Religion was found to be significant at 5% level of significant. Sex was found to be insignificant at 5% level of significant. (Table no. 3)
The conditional backward logistic regression analysis was carried out by eliminating the insignificant variable sex and the fitted model of drop out(Y) for child related variable was given by the equation (1)
Logit (Y) = 4.29 –0.776 Age+ 0.568Caste - 0.394 Religion -1.435Work at home - 3.215 Child not interest in study …..(1)
From the Wald statistics of logistic regression analysis of dropout with family related variables, parents’ apathy toward their children education was found to be highest significant variable at 1% level of significance followed by father education status, family poverty. Number of children per parent was found to be significant at 5% level of significant. The variables father occupation, mother education and mother occupation status were found to be insignificant at 5% level of significant with primary school dropout. (Table no. 4)
Model Summary: The model Log likelihood chi-square was 184.8 at 7 degree of freedom
and p-value was 0.000. Nagelkerke R Square was 0.243. From, Hosmer and Lemeshow Test, Chi-square was 42.69 at 8 degree of freedom and p value was 0.000.
The conditional backward logistic regression analysis was carried out by eliminating the
insignificant variables father occupation,
mother education & mother occupation and the fitted model of drop out(Y) for family related variable was given by the equation (2),
Logit (Y) = 1.385 - 1.19 Poverty -
1.595Parent apathy+0.897 Father education + 0.202 No. of child …..(2)
Discussion
Education is the basic need of human beings. It is also very important for the development of any country. Education is the responsibility of the state and government who should make every possible effort to provide it on an ever interesting and increasing scale in accordance with the national resources. The community should also realize its role in the development
of education5.
The dropout rate of current study revealed 9.10%, 5.49% and 5.03% in grades I, III and V respectively. These results were consistent with
the result of Karki Vishnu 6 where these rates
were 14%, 11% and 6% in grades I, III and V respectively.
The mean age of boys (9.02 years) was higher than girls (8.69 years). This difference may be due to more boys were enrolled in primary level of school and they were enrolled even overage also. The numbers of boy’s dropout were more than girls but this difference was no significant difference.
The age of a child is one of the most important variables to be considered when analyzing
dropout from primary school. More
149
education7 (UNESCO). Most of the primary
school dropout observed in young age. This result was consistent with present study result as the grade of primary school children increased by one, there will be the probability of decreased in drop out. Most of the primary school dropout found in grade one and then gradually decreased with increase in grade.
There was no significant difference between the boys and girls in dropout from primary school level since the p-value was more than 0.05.Sex was not significantly associated with the probability of being out of school in 29
countries of the 68 countries7 (UNESCO,
Institute of statistics, 2007).
In consideration of caste, the Dalit (untouchable ) caste had higher probability of drop out with compared to other castes Brahamin / Chhetry and Janajati. There was higher chance of drop out of Dalit caste from the primary level with compared to other castes.
The educational level of a child’s parent is often related to the child’s own participation in schooling. The mean of father education status was 2.9 which higher than the finding of Thapa
Bijay 8 where it was 1.42. This difference may
be due to different study time period. In this study, the education status of parent’s was inversely proportion to the primary school drop. As the father education status increased by one unit the chances of dropout will be reduced by 7.5% where as it will be decreased by 5.4% in case of mother education. This showed that the father education was more influenced than mother education in reducing the primary school dropout. The father’s education status was higher than mother’s education status which was consistent with the national literacy rate where literacy rate of male (65%) was higher than female (43%) according to 2001
census of Nepal 9.
The occupation of parents also effect on the drop out of children. Parents who were farmers and labors needed helping hands in the agricultural field and at home respectively when they went for work. There were more chances of drop out if the Parent’s occupation was
agricultural and labor. The factor came into the picture of primary school dropout in the form that there were more chances of dropout who were having younger brother or sister because they had to look after their young siblings when their parents go for work.
To fit an appropriate model, Logistic regression analysis is the appropriate statistical technique for the present study because dropout is binary variable. First we applied the enter method to find out the initial significant variables and then the conditional backward elimination procedure was used. To estimate the model parameters, their standard error along with likelihood of the model & the odd ratios and 95% confidence interval for odd ratio were used. Grade was significant at 5% level of significance. Caste, Father education and number of children were significant at 1% level of significant. These results were consistent with the result of Atta
Ur Rahaman & Salah Uddin 5.
Conclusion
150 Table -1 Univariate analysis of Child related(demographic) variables
Variable Chi-square P- value Odds
Ratio
95% Confidence interval
Lower Upper
Grade 0.000 1.000 - - -
Age( ≥8) 7.010 0.008 1.421 1.095 1.844
Sex (Girl) 8.04 0.005 0.687 0.530 0.891
Caste (Dalit) 17.404 0.000 2.070 1.465 2.927
Religion (Hindu) 4.047 0.044 0.712 0.512 0.992
Work at home 38.832 0.000 3.180 2.149 4.705
Child not interest in study
32.803
0.000 18.500 4.485 76.306
Table - 2 Univariate analysis of family related variables
Variable Chi
square P value
Odds Ratio
95% Confidence interval
Lower Upper
Poverty 79.984 0.000 7.133 4.221 12.055
Parents apathy towards education 109.4 0.000 7.105 4.474 11.284
Father education (Illiterate) 61.902 0.000 2.895 2.214 3.785
Father occupation (Agriculture &Labor) 24.744 0.000 1.945 1.495 2.531
Mother education (Illiterate) 13.664 0.000 1.709 1.285 2.273
Mother occupation (House wife,
Agriculture &Labor) 0.332 0.570 0.891 0.599 1.326
151 Table-3 Logistic regression analysis of dropout with child related (demographic) variables
Variables b S.E. Wald P value Odds
Ratio
95.0% C.I. for
Odds Ratio
Lower Upper
Grade -0.327 0.096 11.691 0.001 0.721 0.598 0.870
Age 0.160 0.062 6.674 0.010 1.174 1.039 1.325
Sex 0.214 0.144 2.225 0.136 1.239 .935 1.641
Religion 0.373 0.186 4.012 0.045 1.453 1.008 2.094
Caste -0.581 0.196 8.812 0.003 0.559 0.381 0.821
Work at home 1.196 0.236 25.659 0.000 3.307 2.082 5.254
Child not
interested 2.908 0.742 15.340 0.000 18.319 4.275 78.506
Constant -0.242 0.508 0.226 0.635 0.785
References
1. Ruchita Sharma, Shubhangna Sharma and Shipra Nagar (2007)
“Extent of Female School Drop outs in Kangra District of Himachal Pradesh” Journal of Social Science, Vol.15 No.3, pp. 201-204
2. Okumu, Ibrahim M., Nakajjo, Alex and Isoke, Doreen (2008) “Socioeconomic determinants of primary school dropout: the logistic model analysis” Economic Policy
Research Center, Makerere
University, February 2008, Online
at
http://mpra.ub.uni-muenchen.de/7851/ MPRA Paper No. 7851, posted 20. March 2008 / 08:53
3. School Level Education Statistics of Nepal, Government of Nepal (2009) Ministry of Education and Sports, Department of Education, Kathmandu, Nepal.3-9
4. Flash I Report 2064 (2007-08)
Department of Education,
Sanothimi, Bhaktapur, Nepal,
December, 2007, pp. 48-52
5. Atta Ur Rahaman and Salah Uddin
(2009) “Statistical Analysis Of The Different Socio-economic Factors Affecting The Education Of N-W.F.P (PAKISTAN)” Journal of Applied Quantitative Methods, Vol. 4. No.1,pp. 88-94
6. Karki Vishnu B., Perceived
Antecedents and Subsequent
Activities of Primary School
Children in Nepal, 1997, pp.43- 55. 7. Child out of school (2007)
Measuring exclusive from primary education, UNESCO, Institute of statistics, Vol.28, pp. 36-45. 8. Thapa, Bijay (1984) Determinants
152
Educational Innovation and
Development (CERID),
Kathmandu, Nepal, pp.75-78 9. Statistical Pocket Book (2002)
Government of Nepal, National
Planning Commission Secretariat,
Central Bureau of Statistics,
Ramshahpath, Kathmandu, Nepal, pp. 3-4.
Table-4 Logistic regression analysis of dropout with family related variables
Variables b S.E. Wald P value Odds
Ratio
95.0% C.I. for Odds Ratio
Lower Upper
Poverty -1.196 0.326 13.458 0.000 0.302 0.160 0.573
Parents apathy -1.577 0.286 30.413 0.000 0.207 0.118 0.362
Father education 0.763 0.174 19.313 0.000 2.146 1.526 3.016
Mother
education 0.144 0.174 0.687 0.407 1.155 0.822 1.623
Father
occupation 0.220 0.169 1.696 0.193 1.246 0.895 1.736
Mother
occupation -0.473 0.233 4.106 0.043 0.623 0.395 0.985
No. of child 0.189 0.074 6.497 0.011 1.208 1.045 1.398