1393
A
N
E
FFICIENT
C
ONTENT
B
ASED
D
ATA
C
LUSTERING
A
ND
P
REPROCESSING
F
OR
B
IG
D
ATA
Sumit Vashishtha, Dr Pradeep Chouksey
Abstract: In this paper an efficient framework has been developed which is capable of integrating data mining concepts efficiently along with the preprocessing concept which can handle data efficiently. Our proposed work is divided into four parts. In the first phase the data preprocessing is applied based on the content which can efficiently classify the data based on the content. The content based categorization is used for the clustering purpose in the second phase using k-means and fuzzy c-means. In the third phase data is preprocessed according to the operations performed. Finally the time based on the overall operational process is calculated. The results obtained suggest that the k-means and FCM both perform well in those data and the categorization is done through simple adaptive weight process. But in comparison to both fuzzy c-means is better k-means as the ranking category obtained is high..
Index Terms: Big data, clustering, processing time, simple adaptive process, Big Data Mining, Data Processing, Adaptive Process Mining —————————— ——————————
1.
INTRODUCTION
In current scenario there are huge amount of data in the digital world. There are overwhelming data and the fast transmission rates arise the need of big data [1]. Big data drive the utility in all the areas of the current society. It includes the business processing along with the technological aspects. Different areas are now being easily handled through big data [2−9]. So the need to collaborate big data with different technological aspects has been already in progress for the betterment [10, 11]. As there are different way of analyzing the data and handling it in the way that the efficient data storage and retrieval may be performed. As innovation advances, especially with the coming of Next Generation Sequencing, the size and number of trial information sets accessible is expanding exponentially [12]. Enormous Data can possibly alter research, as well as instruction [13]. Envision a world in which we have admittance to a tremendous database where we gather each definite measure of each understudy's scholarly execution. The above outliers can be helpful in different way to pursue it better [14−17]. It is a long way from having entry to such information; however there are intense patterns in this bearing. Specifically, there is an in number pattern for gigantic Web organization of instructive exercises, and this will create an inexorably huge measure of definite information about understudies' execution and security [15-20]. The main objective of our approach is to ease in data collection process along with the efficiency in data preparation process and efficiently analysis the data. These three objectives are fulfilled with the concept of content and operation based preprocessing, clustering mechanism for data handling and simple adaptive weight process for data analysis for using based on the ranking
.
2 RELATED WORK
In 2012, Xin Luna Dong et al. [21] propose that Big Data time is upon us: information is being produced, gathered and broke down at an uncommon scale, and information driven choice making is clearing through all parts of society. Since the estimation of information blasts when it can be connected and combined with other information, tending to the big data integrator(BDI) test is basic to understanding the guarantee of Big Data. BDI contrasts from customary information reconciliation in numerous measurements: (i) the quantity of information sources, notwithstanding for a solitary space, has become in the several thousands, (ii) a large number of the information sources are exceptionally progressive, as an immense measure of recently gathered information are constantly made accessible, (iii) the information sources are to a great degree heterogeneous in their structure, with extensive
mixture notwithstanding for generously comparative
substances, and (iv) the information sources are of broadly varying qualities, with noteworthy contrasts in the scope, exactness and convenience of information gave. In 2012, Aditya B. Patel et al. [22] reports the test chip away at enormous information issue and its ideal arrangement utilizing Hadoop group, Hadoop Distributed File System (HDFS) for capacity and utilizing parallel preparing to process expansive information sets utilizing Map Reduce programming structure. They have done model usage of Hadoop group, HDFS stockpiling and Map Reduce structure for preparing expansive information sets by considering model of huge information application situations. The outcomes acquired from different trials demonstrate great consequences of above way to deal with location enormous information issue. In 2012, Rini T. Kaushik et al. [23] propose State-of-the-workmanship cooling vitality administration systems depend on warm mindful computational occupation arrangement/relocation and are naturally information position rationalist in nature. It takes a novel, information driven way to deal with diminish cooling vitality costs and to guarantee warm unwavering quality of the servers. T is conscious of the uneven warm profile and contrasts in warm unwavering quality driven burden limits of the servers, and the distinctions in the computational employments landing rate, size, and development life compasses of the Big Data put in the group. Taking into account this learning, and combined with its prescient record models and bits of knowledge, T does proactive, thermalaware
document situation, which verifiably brings about
————————————————
Sumit Vashishtha is currently pursuing Phd degree program in Computer Science engineering in Mewar University, chittorgarh Rajasthan India Ph-9977303113. E-mail: [email protected] Dr Pradeep Chouksey is currently Associate Professor in Computer
thermalaware work position in the Big Data investigation register model. Assessment results with one-month long certifiable Big Data investigation creation follows from Yahoo! appear to 42% decrease in the cooling vitality costs with T politeness of its lower and more uniform warm profile and 9x preferable execution over the best in class information freethinker cooling strategies. In 2012, EdmonBegoli et al. [24] recommend that Big information wonder alludes to the act of gathering and preparing of expansive information sets and related frameworks and calculations used to examine these gigantic datasets. Architectures for huge information generally extend over different machines and groups, and they normally comprise of various extraordinary reason sub-frameworks. Combined with the information disclosure process, huge information development offers numerous one of kind open doors for associations to advantage (as for new bits of knowledge, business improvements, and so forth.). In any case, because of the trouble of investigating such extensive datasets, huge information presents one of kind frameworks designing and structural difficulties. They introduce three framework plan rule that can educate associations on compelling logical and information gathering procedures, framework association, and information spread practices. The standards introduced get from our own innovative work encounters with enormous information issues from different government organizations, and they delineate every rule with our own particular encounters and suggestions. In 2012, Gueyoung Jung et al. [25] address the previously stated tradeoff, to decides: (a) what number of and which figuring hubs in united mists ought to be utilized for parallel execution of enormous information examination; (b) entrepreneurial allotting of huge information to these processing hubs in a manner to empower synchronized finishing, best case scenario exertion execution; and (c) arrangement of allocated, diverse sizes of huge information pieces to be registered in every hub so that exchange of a lump is covered however much as could reasonably be expected with the reckoning of the past lump in the hub. They proposed Overlapped Bin-pressing driven Bursting (MOBB) calculation, which enhance the execution by up to 60% against existing methodologies. In 2013, Antonia Azzini et al. [26] infer that every nearby source is tasked of applying a semantic lifting method for communicating the neighborhood information in term of the normal model. Semantic heterogeneity is then conceivably presented in information. They show a procedure intended to the execution of reliable procedure mining calculations in a 'Major Data' connection. Specifically, we misuse two unique strategies. The first is gone for registering the befuddle among the information sources to be coordinated. The second uses bungle qualities to stretch out information to be handled with a conventional guide diminish calculation. In 2013, Du Zhang et al. [27] first examine the measurements in huge information and enormous information examination, and afterward center our consideration on the issue of irregularities in huge information and the effect of irregularities in huge information investigation. They offer characterizations of four sorts of irregularities in huge information and call attention to the utility of irregularity instigated adapting as an apparatus for huge information examination. In 2013, Xin Cheng et al. [28] recommend an information advancement model of Virtual DataSpace (VDS) for dealing with the huge information lifecycle. Firstly, the idea of information development cycle is characterized, and the lifecycle procedure of huge information
administration is depicted. In view of these, the information development lifecycle is broke down from the information relationship, the client necessities, and the operation conduct. Also, the characterization and key ideas about the information advancement procedure are depicted in point of interest. As indicated by this, the information development model is built by characterizing the related ideas and breaking down the information relationship in VDS, for the catch and following of element information in the information advancement cycle. At that point they examine the expense issue about information spread and change. At last, as the application case, the administration procedure of element information in the field of materials science is portrayed and broke down. In 2013, SerefSagiroglu et al. [29] recommend the procedure of exploration into huge measures of information to uncover shrouded examples and mystery relationships named as large
information investigation. These valuable data's for
organizations or associations with the assistance of increasing wealthier and more profound bits of knowledge and getting preference over the opposition. Thus, huge information usage should be investigated and executed as precisely as could be expected under the circumstances. They displays a review of huge information's substance, degree, tests, systems, focal points and challenges and talks about security concern on it. In 2014, Xindong Wu et al. [30] present a HACE theorem that characterizes the features of the Big Data revolution, and proposes a Big Data processing model, from the data mining perspective. This data-driven model involves demand-driven aggregation of information sources, mining and analysis, user interest modeling, and security and privacy considerations. They analyze the challenging issues in the data-driven model and also in the Big Data revolution.
3 PROPOSED
METHOD
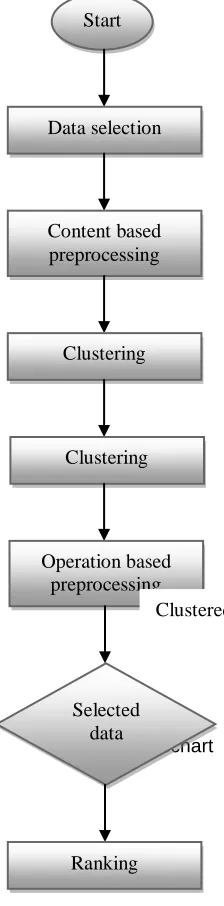
A In this paper an efficient hybrid framework have been proposed for data preprocessing, data clustering and data selection for the efficient data management in big data. The four phases of this approach are as follows:
1. Preprocessing based on the content
2. Clustering
3. Preprocessing based on the operations
4. Ranking
1395 Figure 1: Flowchart
Preprocessing based on the content
First the data in this framework are categorized based on the content specializations. It helps in better clustering the data. The data points are given according to the matching factors. Total points are distributed between 1-10. Four attributes should be alike for one point. Maximum points are 10 and minimum point is 1.
Clustering
For efficient handling of data the obtained preprocessed data is clustered through means and FCM algorithms. First k-means algorithm has been applied.
K-means algorithm:
Step 1: For creating an initial partition need to select the initial centroids.
Step 2: The remaining sets are examined based on the initial centroids.
Step 3: Find the nearer cluster means based on the Euclidean
distance.
dist((x, y), (a, b)) = √(x - a)² + (y - b)²
Step 3: The new member is added till the end of file is not reached and mean value is recalculated in each newly item add.
Step 4: Based on the above the data is assigned to the closest centroid.
Step 5: Own cluster mean is recalculated and compared with each individual distance so that right cluster has been assigned.
Step 6: This process is repeated until the changes are static. Step 7: Final clusters have been obtained.
Fuzzy c-means algorithm:
Step 1: The membership matrix let U has been generated based on the below formula:
c
i
ij j n
u
1
,..., 1 , 1
Step 2: Dissimilarity has been generated next using the below equation:
c
i n
j ij m ij c
i i
c J u d
c c c U J
1 1
2
1 2
1, ,..., )
, (
uij is between 0 and 1;
ci is the centroid of cluster i;
dij is the Euclidian distance between ith centroid(ci) and jth data
point;
m є [1,∞] is a weighting exponent.
Step 3: It should be minimum of dissimilarity function using the below equation:
n
j m
ij n
j j
m
ij
i
u x u c
1 1
c k
m
kj ij ij
d d u
1
) 1 /( 2
1
Step 4: The iteration is then stopped till the epsilon value is lower than the retrieved iteration condition.
Step 5: Finish.
Ranking
The above values are used for assigning the ranking based on simple adaptive weight process.
4
RESULT
ANALYSIS
The results based on our approach are discussed in this section. First the data is selected and uploaded in the hybrid framework. The result based on the content based preprocessing is shown in table 1. This preprocessing is generated automatically by our approach according to the data categorization and the scale considered is 1-10.
Table 1: Content based preprocessing
Field1 Field 2
Field 3
Field 4
Field 5
Field 6
Field 7
Field 8
Field 9
Field1 0
Field1 1 cloud.
txt
0 0 1 0 5 0 2 0 1 1
cloud1.tx 5 2 10 5 10 6 10 2 8 10
Start
Data selection
Content based preprocessing
Clustering
Clustering
Operation based preprocessing
Selected data
Ranking
Field1 Field 2
Field 3
Field 4
Field 5
Field 6
Field 7
Field 8
Field 9
Field1 0
Field1 1 t
cloud2.tx t
5 2 10 4 10 5 10 1 9 10
cloud4.tx t
10 0 10 10 10 10 10 10 4 10 cluster.txt 1 0 0 0 0 0 1 0 0 0 cluster4.t
xt
10 5 10 10 1 10 10 0 0 10 cyber1.tx
t
2 0 5 2 0 3 10 10 5 4
cyber3.tx t
10 1 10 10 10 10 10 10 5 10 data1.txt 10 7 10 10 0 10 10 1 10 10 encry1.tx
t
6 3 10 6 2 7 10 2 10 10
encry2.tx t
10 0 10 10 10 10 10 6 6 10
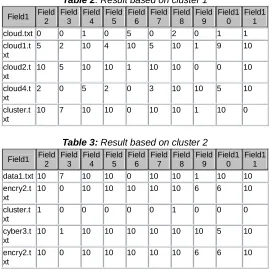
Then data clustering is applied on the above data using k-means and fuzzy c-k-means both. The results based on cluster 1 and cluster 2 is shown in table 2 and 3. Then complete data is preprocessed according to the operations performed. It is shown in table 4. The ranking based on the SAW operation is shown in table 5 and 6 for k-means. Table 7 and 8 shows the ranking for fuzzy c-means. The comparison based on time is shown in table 9.The overall results obtained suggest that the k-means and FCM both perform well in those data and the categorization is done through simple adaptive process. But in comparison to both fuzzy c-means is better k-means as the ranking category obtained is high.
Table 2: Result based on cluster 1
Field1 Field 2
Field 3
Field 4
Field 5
Field 6
Field 7
Field 8
Field 9
Field1 0
Field1 1 cloud.txt 0 0 1 0 5 0 2 0 1 1 cloud1.t
xt
5 2 10 4 10 5 10 1 9 10
cloud2.t xt
10 5 10 10 1 10 10 0 0 10 cloud4.t
xt
2 0 5 2 0 3 10 10 5 10
cluster.t xt
10 7 10 10 0 10 10 1 10 0
Table 3: Result based on cluster 2
Field1 Field 2
Field 3
Field 4
Field 5
Field 6
Field 7
Field 8
Field 9
Field1 0
Field1 1 data1.txt 10 7 10 10 0 10 10 1 10 10 encry2.t
xt
10 0 10 10 10 10 10 6 6 10 cluster.t
xt
1 0 0 0 0 0 1 0 0 0
cyber3.t xt
10 1 10 10 10 10 10 10 5 10 encry2.t
xt
10 0 10 10 10 10 10 6 6 10
Table 4: Data preprocessing based on the operations
filename read write update send rec
cloud 6 6 4 5 1
cloud1 3 1 5 5 2
cloud2 6 2 5 3 5
cloud3 6 2 4 5 8
cloud4 3 9 8 5 5
cluster 6 2 3 3 2 cluster4 1 4 6 1 9 compare 1 1 3 1 3
cyber1 2 8 2 6 5
cyber2 3 5 8 6 9
cyber3 6 7 5 3 4
data1 3 8 4 1 7
encry1 5 6 5 4 6
encry2 8 8 1 5 9
encry4 7 1 8 4 7
encry7 8 4 8 8 6
encryption 8 5 2 8 4 histroy 6 4 3 2 7
intro 4 8 6 4 7
multi 1 9 4 7 7
Table 5: K-means based ranking for K1 cluster
File status cloud2.txt 6.375 cloud.txt 5.25 cluster.txt 3.875 cloud4.txt 3.375 cloud1.txt 2.5
Table 6: K-means based ranking for K2 cluster
File File status cluster.txt 6.75 encry2.txt 6.75 cyber3.txt 6.125 cloud1.txt 5.125 encry2.txt 3.25
Table 7: Fuzzy c-means based ranking for K1 cluster
File File status cloud.txt 7.125 cyber1.txt 6.75 cyber3.txt 5.625 cluster.txt 5.25 cluster4.txt 3.875 cyber3.txt 2.875 cloud1.txt 2.375
Table 8: Fuzzy c-means based ranking for K2 cluster
1397
Table 9: comparison based on time
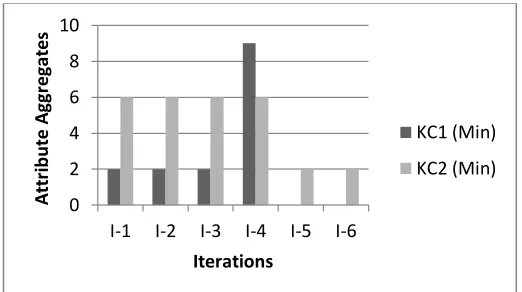
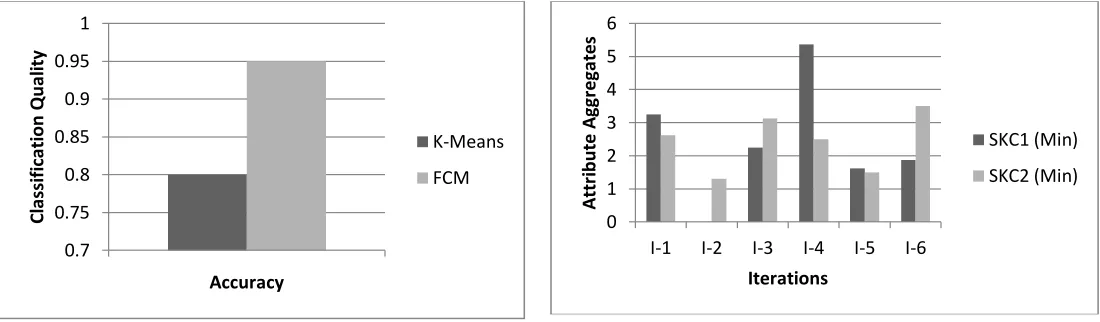
FileSize Sending_Time Update_Time 1 Bytes 0.029038188351299406 0.02001337010111139 1 KBytes 29.73510487173059 20.493690983538063 1 MBytes 30448.747388652126 20985.539567142976 1 GBytes 3.1179517325979777E7 2.1489192516754407E7 1 TBytes 3.192782574180329E10 2.2004933137156513E10 1 PBytes 3.269409355960657E13 2.253305153244827E13 Now the comparison has been shown based on clustering of data. The results are compared based on two clusters of k-means and FCM. In this the aggregate values shows the total value of a single file obtained through the cluster. Iterations show the number of times it is repeated to perform the comparison. Max shows the considerations are the highest value and min shows the consideration is minimum value. Figure 2 shows the max attribute aggregation value obtained through k-means clustering. Figure 3 shows the min attribute aggregation value obtained through k-means clustering. Figure 4 shows the max attribute aggregation value obtained through FCM clustering. Figure 5 shows the min attribute aggregation value obtained through FCM clustering. Figure 6 shows the classification quality comparisons. It is clear from the results that the clustering based classification performed by FCM is better in comparison to the k-means algorithm. The results also depicted that the misclassification rate of FCM is low in comparison to k-means algorithm
Figure 2 Max attribute aggregation value obtained through
k-means clustering
Figure 3 Min attribute aggregation value obtained through
k-means clustering
Figure 4 Max attribute aggregation value obtained through
FCM clustering
Figure 5 Min attribute aggregation value obtained through
FCM clustering
0 20 40 60 80 100
I-1 I-2 I-3 I-4 I-5 I-6
A
tt
ri
b
u
te
A
gg
re
ga
te
s
Iterations
KC1 (Max)
KC2 (Max)
0 2 4 6 8 10
I-1 I-2 I-3 I-4 I-5 I-6
A
tt
ri
b
u
te
A
gg
re
ga
te
s
Iterations
KC1 (Min)
KC2 (Min)
0 20 40 60 80 100
I-1 I-2 I-3 I-4 I-5 I-6
A
tt
ri
b
u
te
A
gg
re
ga
te
s
Iterations
FC1 (Max)
FC2 (Max)
0 10 20 30 40 50 60
I-1 I-2 I-3 I-4 I-5 I-6
A
tt
ri
b
u
te
A
gg
re
ga
te
s
Iterations
FC1 (Min)
Figure 6 Classification Quality comparisons
Now the comparison and analysis has been presented based on the SAW ranking with k-means and FCM algorithm. SKC1 and SKC2 shows SAW cluster 1 and 2 with k-means. SFCM1 and SFCM2 shows SAW cluster 1 and 2 with FCM algorithm. Figure 7 shows the max attribute aggregation score rank obtained through Saw-Kmeans. Figure 8 shows the min attribute aggregation score rank obtained through Saw-Kmeans. Figure 9 shows the max attribute aggregation score rank obtained through Saw-FCM. Figure 10 shows the min attribute aggregation score rank obtained through Saw-FCM. The results clearly depict the strength of FCM algorithm in case of minimization and maximization. The variations are marginal but in some times it are large. But overall efficiency in ranking data FCM is better in comparison to k-means algorithm.
Figure 7 Max attribute aggregation score rank obtained
through Saw-Kmeans
Figure 8 Min attribute aggregation score rank obtained
through Saw-Kmeans
Figure 9 Max attribute aggregation score rank obtained
through Saw-FCM
Figure 10 Min attribute aggregation score rank obtained
through Saw-FCM
6
CONCLUSION
In this paper an efficient data preprocessing, data handling and analysis technique has been proposed for big data. This mechanism support data preprocessing based on content and operations used. It is useful in data creation and capable in handling large set of data. Then data clustering help in data preparation for the analysis and ranking purpose. K-means and fuzzy c-means are used for clustering. Ranking is done
0.7 0.75 0.8 0.85 0.9 0.95 1
C
la
ssi
fi
ca
ti
on
Q
u
al
it
y
Accuracy
K-Means
FCM
0 2 4 6 8 10
I-1 I-2 I-3 I-4 I-5 I-6
A
tt
ri
b
u
te
A
gg
re
ga
te
s
Iterations
SKC1 (Max)
SKC2 (Max)
0 1 2 3 4 5 6
I-1 I-2 I-3 I-4 I-5 I-6
A
tt
ri
b
u
te
A
gg
re
ga
te
s
Iterations
SKC1 (Min)
SKC2 (Min)
0 2 4 6 8 10
I-1 I-2 I-3 I-4 I-5 I-6
A
tt
ri
b
u
te
A
gg
re
ga
te
s
Iterations
SFCM1 (Max)
SFCM2 (Max)
0 1 2 3 4 5 6 7
I-1 I-2 I-3 I-4 I-5 I-6
A
tt
ri
b
u
te
A
gg
re
ga
te
s
Iterations
SFCM1 (Min)
1399 through simple adaptive weight process for assigning the
operations. The results indicate that the performance of k-means and fuzzy c-k-means are same but in some extent fuzzy c-means are better in ranking allocation.
REFERENCES
[1] B. Ratner, Statistical Modeling and Analysis for
Database Marketing: Effective Techniques for Mining Big Data, CRC Press, 2003.
[2] T. Craig and M.E. Ludlof, Privacy and Big Data: The
Players, Regulators, and Stakeholders, O’Reilly
Media, 2011.
[3] R. Clarke, ―Human Identification in Information
Systems: Management Challenges and Public Policy Issues,‖ Information Technology & People, vol. 7, no. 4, 1994, pp. 6-37.
[4] M.R. Wigan, ―Owning Identity-One or Many-Do We
Have a Choice?‖ IEEE Technology and Society, vol. 29,no. 2, 2010, pp. 33-38.
[5] E.W.T. Ngai, L. Xiu, and D.C.K. Chau, ―Application of
Data Mining Techniques in Customer Relationship Management: A Literature Review and Classification,‖ Expert Systems with Applications, vol. 36, no. 2, 2009, pp. 2592-2602.
[6] Ruchita Gupta, C.S.Satsangi, " An Efficient Range
Partitioning Method for Finding Frequent Patterns from Huge Database " , International Journal of Advanced Computer Research (IJACR), Volume-2, Issue-4, June-2012 ,pp.62-69.
[7] Z. Bellahsene, A. Bonifati, and E. Rahm, editors.
Schema Matching and Mapping. Springer, 2011.
[8] J. Bleiholder and F. Naumann. Data fusion. ACM
Computing Surveys, 41(1):1–41, 2008.
[9] M. J. Cafarella and A. Y. Halevy. Web data
management. In Sigmod, pages 1199–1200, 2011.
[10]M. J. Cafarella, A. Y. Halevy, D. Z. Wang, E. Wu, and
Y. Zhang. Webtables: exploring the power of tables on the web. In PVLDB, pages 538–549, 2008.
[11]Debopam De, Deblina Banerjee, Sneha Mukherjee
and JayatiGhoshDastidar, " A Simplistic Mechanism for Query Cost Optimization " , International Journal of Advanced Computer Research (IJACR), Volume-5, Issue-19, June-2015 ,pp.205-211.
[12]K. C.-C. Chang, B. He, and Z. Zhang. Toward large
scale integration: Building a metaquerier over databases on the web. In CIDR, pages 44–55, 2005.
[13]N. N. Dalvi, A. Machanavajjhala, and B. Pang. An
analysis of structured data on the web. PVLDB, 5(7):680–691, 2012.
[14]U.Chandrasekhar, Sandeep Kumar. K, Yakkala Uma
Mahesh, " A Survey of latest Algorithms for Frequent Itemset Mining in Data Stream" , International Journal of Advanced Computer Research (IJACR), Volume-3, Issue-9, March-2013 ,pp.60-65.
[15]X. Dong and A. Y. Halevy. Indexing dataspaces. In C.
Y. Chan, B. C. Ooi, and A. Zhou, editors, SIGMOD Conference, pages 43–54. ACM, 2007.
[16]X. Dong, A. Y. Halevy, and C. Yu. Data integration with
uncertainties. In VLDB, 2007.
[17]X. L. Dong, L. Berti-Equille, and D. Srivastava.
Integrating conflicting data: the role of source dependence. PVLDB, 2(1), 2009.
[18]Ramesh R and Divya G, ―Dynamic Security
Architecture among E-Commerce Websites‖,
International Journal of Advanced Computer
Research (IJACR), Volume-5, Issue-19, June-2015, pp.184-191.
[19]X. L. Dong, L. Berti-Equille, and D. Srivastava. Truth
discovery and copying detection in a dynamic world. PVLDB, 2(1), 2009.
[20]X. L. Dong and F. Naumann. Data fusion–resolving
data conflicts for integration. PVLDB, 2009.
[21]Dong, X.L.; Srivastava, D., "Big data integration,"
Data Engineering (ICDE), 2013 IEEE 29th
International Conference on , vol., no., pp.1245,1248, 8-12 April 2013.
[22]Patel, A.B.; Birla, M.; Nair, U., "Addressing big data
problem using Hadoop and Map Reduce,"
Engineering (NUiCONE), 2012 Nirma University International Conference on , pp.1,5, 6-8 Dec. 2012.
[23]Kaushik, R.T.; Nahrstedt, K., "T*: A data-centric
cooling energy costs reduction approach for Big Data analytics cloud," High Performance Computing, Networking, Storage and Analysis (SC), 2012 International Conference for , app.1,11, 10-16 Nov. 2012.
[24]Begoli, E.; Horey, J., "Design Principles for Effective
Knowledge Discovery from Big Data," Software Architecture (WICSA) and European Conference on Software Architecture (ECSA), 2012 Joint Working IEEE/IFIP Conference on , pp.215,218, 20-24 Aug. 2012.
[25]Gueyoung Jung; Gnanasambandam, N.; Mukherjee,
T., "Synchronous Parallel Processing of Big-Data Analytics Services to Optimize Performance in Federated Clouds," Cloud Computing (CLOUD), 2012 IEEE 5th International Conference on, pp.811,818, 24-29 June 2012.
[26]Azzini, A.; Ceravolo, P., "Consistent Process Mining
over Big Data Triple Stores," Big Data (BigData Congress), 2013 IEEE International Congress on, pp.54, 61, June 27 2013-July 2 2013.
[27]Du Zhang, "Inconsistencies in big data," Cognitive
Informatics & Cognitive Computing (ICCI*CC), 2013 12th IEEE International Conference on, pp.61, 67, 16-18 July 2013.
[28]Xin Cheng; Chungjin Hu; Yang Li; Wei Lin; HaoleiZuo,
"Data Evolution Analysis of Virtual DataSpace for Managing the Big Data Lifecycle," Parallel and Distributed Processing Symposium Workshops & PhD Forum (IPDPSW), 2013 IEEE 27th International, pp.2054,2063, 20-24 May 2013.
[29]Sagiroglu, S.; Sinanc, D., "Big data: A review,"
Collaboration Technologies and Systems (CTS), 2013 International Conference on, pp.42,47, 20-24 May 2013.
[30]Xindong Wu; Xingquan Zhu; Gong-Qing Wu; Wei