IJSRR, 8(2) April. – June., 2019 Page 4275
Research article Available online www.ijsrr.org
ISSN: 2279–0543
International Journal of Scientific Research and Reviews
Comparative Study on Agricultural and Non-Agricultural Labors
Shivakumar
Guest Faculty, Dept of Studies in Economics, Vijayanagara Sri Krishnadevaraya University, P.G Centre, Koppal, Karnataka
Email id: [email protected]. Cell No: 09036789235
ABSTRACT:
In India agricultural labor constitutes the most significant single pleasant among the gainfully employed population. The 228.3 millions labors are earned by income by functioning on agricultural farms (FICCI, 2015). Agricultural sector is plays a one of the most significant role in overall socio-economic development. Present study measures socio-socio-economic status of agricultural and non-agricultural labours. Study collected data from primary survey by using questionnaire method based on selecting convenience random methodology. The results revealed that majority 35.58 respondents is illiterate and 46.98 percent have completed primary level of education and second important issue is that majority 77.65 percent of the respondents annual income is less than 11000 only. The study finds some very crucial issue is that 40 percent of the households do not have own latrine facility and 62 percent of the households are still using firewood for cooking for preparing food and 60 percent of the households are doesn’t not access any family insurance. it means still they are very poor in the society.
KEY WORDS:
Agricultural, Non-Agricultural, Economic, Living & Health Condition*Corresponding author:
Dr. Shivakumar
Guest Faculty, Dept of Studies in Economics,
Vijayanagara Sri Krishnadevaraya University,
P.G Centre, Koppal, Karnataka
IJSRR, 8(2) April. – June., 2019 Page 4276
INTRODUCTION:
Despite some industrialization, India remained primarily an agricultural economy at the
beginning of the century. The share of the factories in total national income barely exceeded 6
percent in normal year. The primary sector that is agriculture contributed 60 percent or more of the
total income and two-third of people employed were in the agricultural sector. Agricultural sector
square measure those sector that square measure concerned within the principles of political
economy to the assembly of crops and livestock-a discipline is aware of as agronomics. Agronomics
as a branch of economics that specifically deals with land usage. It targeted on maximizing the crop
yield whereas maintaining a decent soil scheme. Throughout the 20th century the discipline is much
broader. Agricultural political economy nowadays includes a range of applied areas, having
considerable overlap with conventional economics.
Non-agricultural sectors includes economic activities like households and non-households
producing handicrafts, processing, repairs, construction, mining and quarrying, government
employee, busyness, transport, trade, communication etc. in rural areas. The economic census of
India is measures that around 89 million rural people are employed on non-agricultural
establishments which registered a growth rate 4.56 percent during 1998 to 2005. However, the world
has been competitive with variety of things like electricity and communication facility, lack of
sufficient skilled labor and adequate access to credit, information and training facilities etc. The pace
of structural transformation in favour of non-agricultural activities in the rural areas in the country
picked up markedly during the post-Green Revolution period. However, the rate of rural
diversification was not uniform across different states and regions. Nor were the factors associated
with this process identical. The impact of the process of diversification on rural incomes and poverty
levels was also uneven. Rural India is home to 65.0 per cent1 of the nation’s population and about the
same proportion of the poor in the country. The gap between variety the amount the quantity of
recent rural staff and therefore the number of recent jobs in agriculture is growing however
agriculture alone won't meet the agricultural employment challenge.
In India, the trend has not been limited to just declining share of agriculture in total
employment but also has led to a significant decline in absolute number of people employed in the
agricultural sector. The number of agricultural workforce is reduced by 56.7 percent to 48.7 percent.
In Karnataka has also decline agricultural labours is 17.60 percent to 12.91 percent from 2004-05 to
2011-12 (FICCI, 2015). Agricultural and allied sector is one of the major platform is achieving an
overall 8 percent of the GDP growth rate in 12th five year plan and attractive income and support
livelihood for rural population, which presently is extremely less. As per 2011 census, home
IJSRR, 8(2) April. – June., 2019 Page 4277 employed in agricultural sector, 110.7 millions are engaged in secondary sector and 127.8 millions
are tertiary sector respectively. Meanwhile, 743 million Rest of population.
OBJECTIVES:
To understand the present status of agricultural and non-agricultural laboures in India.
To analysis socio-economic conditions of agriculture and non-agricultural laboures in study area.
DATA AND METHODOLOGY:
The research work is based on primary data. Primary data are collected from responses of
agricultural and non-agricultural labour to a structured questionnaire. The data were collected by
using questionnaire method of selecting convenience random methodology. A questionnaire;
constituting more than 25 questions, framed for evaluating social-economics status, households
living and health conditions of the respondents. This study designed as assessing a comparative
analysis of agricultural and non-agricultural labors in Kolur village of Koppal district of Karnataka
by making a total sample is (5 percent) collected questionnaire from 85 respondents. The tools used
for analysis of data are tabular analysis based on percentage, and simple averages.
RESULTS AND DISCUSSION:
Part- I: General Information of the Respondents
Table 1: Gender of the Respondents
Gender Respondents Percent
Male 70 82.35
Female 15 17.65
Total 85 100%
Source: Computed by field survey
Above table 1 is shown that, general information of the respondents in the study was a total
number of 70 (82 percent) out of 85 respondents are Male respondents and 15 (18 percent) out of 85
respondents are Female respondents sampled are collected from selected village of the study area.
Table 2: Age category of the Respondents
Age category Respondents Percent
< 25 01 1.18
26-35 15 17.65
36-45 38 44.71
> 45 31 36.47
Total 85 100%
Source: Computed by field survey
From table 2 shows that, second important general information of the respondents it can also
be noted that majority of the respondents (45 percent) were aged between 36-45 years followed by
36 percent respondents (31 respondents) are more than 45 age, 18 percent (15 respondents) are
IJSRR, 8(2) April. – June., 2019 Page 4278
Table 2: Religions of the Respondents
Religions Respondents Percent
GM 5 5.88
OBC 64 75.29
SC 3 3.53
ST 5 5.88
Minorities 8 9.41
Total 85 100%
Source: Computed by field survey
Above table 3 reveals that, study classified religion wise respondents. Whereas, higher the
proportion of the respondents from Other Backward Classes (OBC) that is 75 percent, the second
majoring of the respondents is Minorities is 9 percent, followed by General Merit and Scheduled
Tribes are 6 percent and Scheduled Caste is only for 4 percent of the respondents respectively.
Part- II: Economic Status of the Respondents
Table 4: Occupation of the Respondents
Type of Employment Respondents %
Own Cultivation 33 39.76
Agricultural Labour 19 22.89
Casual Labour 14 16.87
Government Employ 5 06.02
Self Employed/Business 7 08.43
Other Work 5 06.02
Total 83 100%
Source: Computed by field survey
Above table 4 reveals that occupation of the respondents. The Occupation is the major factor
of the population. Because of occupation is provides better life, to maintain luxury life, to maintain
good health and well-being. The study classified occupation of the respondents, whereas, majority of
the respondents (40 percent of the population) are working in their own cultivation. The second
higher the respondents (23 percent) are working as agricultural labour, followed by 16.87 percent of
the respondents are working as a Casual Labour, 8.43 percent of the respondents are Self Employed/
Business, 6.02 percents are Government employed and 6.02 of the respondents are working their
other jobs.
Table 5: Type of Occupation of the Respondents
Type of Occupation Respondents Percent
Agricultural Labour 66 77.65
Non-Agricultural Labour 19 22.35
Total 85 100
Source: Computed by field survey
Above table 5 exhibits that, study categorized type of the occupation. The study classified
Agricultural Labour i.e., Own Cultivation, Agricultural Labour and Casual Labour and Non-Agricultural
IJSRR, 8(2) April. – June., 2019 Page 4279 77.65 percent (66 respondents) are Agricultural Labour and 22.35 percent (19 respondents) are
Non-Agricultural Labour.
According to Nelson Mandela “Education is the most powerful weapon which you can
use to change the world”. The education is important for the personal, social and economic
development of the nation and it is personal & professional life and it’s provides us various types of
knowledge and skills.
Table 6: Occupation & Education Level
Education Level Agricultural Labour Non-Agricultural Labour
Illiterate 24 (36.36%) 2 (10.52%)
Primary 35 (53.04%) 4 (21.05%)
Secondary 7 (10.06%) 4 (21.05%)
Higher Education 0 5 (26.33%)
Technical Education 0 4 (21.05%)
Total 66 (100%) 19 (100%)
Source: Computed by field survey
Above table 6 shows that, general education level of the respondents. The study is finds that
Non-Agricultural labour is better educated as compare to the Agricultural labour. Whereas, 39.39
percent (24 respondents) agricultural labors are illiterate followed by 53.03 percent (35 respondents)
are studied Primary education and 10.60 (7 respondents) are studied secondary education but in the
agricultural labour households there is no one of the respondents are studied above the secondary
education i.e., higher and technical education. Meanwhile, in non-agricultural labour whereas, finds
that10.52 percent (2 respondents) are illiterate followed by 4 respondents are Primary, 4 respondents
are secondary, 5 respondents are higher and 4 respondents are technical educated.
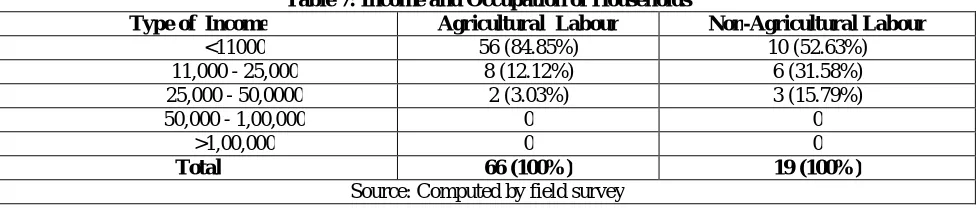
Table 7: Income and Occupation of Households
Type of Income Agricultural Labour Non-Agricultural Labour
<11000 56 (84.85%) 10 (52.63%)
11,000 - 25,000 8 (12.12%) 6 (31.58%)
25,000 - 50,0000 2 (3.03%) 3 (15.79%)
50,000 - 1,00,000 0 0
>1,00,000 0 0
Total 66 (100%) 19 (100%)
Source: Computed by field survey
Above table 7 is reveals that, annual income of the agricultural and non-agricultural labor
households. The study finds that majority of the agricultural labors are very poor as and their annual
income is less that Rs.11,000/- as compare to non-agricultural labor. Meanwhile, in agricultural
labour were reveals 84.84 percent (56 respondents) of agricultural labors households annual income
is less than Rs.11,000/- followed by 12.12 percent (8 respondents) is between Rs.11,000 to
Rs.25,000 and 3.03 percent (only 2 respondents) annual income is between Rs.25,000 to Rs.50,000
IJSRR, 8(2) April. – June., 2019 Page 4280 of the non-agricultural labour household annual income is below Rs.11000/- followed by 6
respondents (31.57 percent) is between Rs.11,000 to Rs.25,000 and only 3 respondents (15.78) is
between Rs.25,000 to Rs.50,000 but in non-agricultural labor households also annual income is not
more than Rs.50,000.
Part- III: Households Living Condition of the Respondents
Table 8: Living Condition of Households
Category Agricultural Labour Non-Agricultural Labour
Own House 59 (89.39%) 17 (89.47%)
Rent House 7 (10.61%) 02 (10.53%
Total 66 (100%) 19 (100%)
Source: Computed by field survey
House is one of the basic need is required for the every people their live. Above table 8 shows that,
89.39 percent of the agricultural labor their own house and remaining 10.61 percent of the
respondents are living in rent house. Meanwhile, among the non-agricultural labor were 89.47
percent their live in own house and remaining 10.53 percent of the respondents are living in rent
house.
Table 9: Households Latrine Facility
Agricultural Labour Non-Agricultural Labour
Yes 43 (65.15%) 8 (42.10%)
No 23 (34.85%) 11 (57.90%)
Total 66 (100%) 19 (100%)
Source: Computed by field survey
The important basic necessity for human dignity and self-respect is availability of latrine
facility. Above table 9 shows that, the study finds that 65.15 percent of the agricultural labor
households have separate latrine facility and 34.85 percent of households do not have separate latrine
facility. Meanwhile, among the non-agricultural labor households were found 42.10 percent of the
households have latrine facility but still there is 57.90 percent of the households do not have access
to the toilet/latrine facility. So it indicates that, in Kolur village approximately 40 percent of the
households do not have access to the toilet/latrine facility.
Table 10: Occupation & Households Cooking Fuel
Types Agricultural Labour Non-Agricultural Labour
Gas 02 (3.03%) 9 (47.36%)
Kerosene 01 (1.51%) 0
Electricity 01 (1.51%) 0
Firewood 32 (48.48%) 6 (31.57%)
Gas & Firewood 23 (34.84%) 3 (15.78%)
Kerosene & Firewood 07 (10.60%) 1 (5.26%)
Total 66 (100%) 19 (100%)
IJSRR, 8(2) April. – June., 2019 Page 4281 Above table 10 reveals that, the use and type of modern cooking fuel is another major parameter to
assess status of households. In terms if this study finds that 48.48 percent of agricultural labour
households are using traditional fuels is firewood followed by 34.84 percent households are use both
Gas and Firewood, 10.60 percent households were use Kerosene and firewood. Whereas, only 3.03
percent of the agricultural households use modern cooking fuel is Gas. Meanwhile, among the
non-agricultural labor households were finds that majority of the households are use Gas and Firewood.
The number highlights the scarcity and living standards which significantly affects human
development.
Table 11: Occupation & Types of Ratio Card
Types Agricultural Labour Non-Agricultural Labour
BPL 60 (90.90%) 12 (63.15%)
APL 1 (1.51%) 3 (15.78%)
Antyodaya 2 (3.03%) 2 (10.52%)
No Card 3 (4.54%) 2 (10.52%)
Total 66 (100%) 19 (100%)
Source: Computed by field survey
Above table 11 shows that, the survey finds that 90.90 percent of the agricultural labor households
have a BPL ration card followed by 3.03 percent of households possess Antyodaya cards, 1.51
percent possess APL card and 4.54 percent of households doesn’t have ration card. Meanwhile, the
households of non-agricultural labor were finds 63.15 percent have a BPL ration card followed by
15.78 percent of APL cards, 1.052 percent possess Antyodaya card and 10.52 percent of households
doesn’t have ration card.
Part- V: Households Health Conditions of the Respondents
Table 12: Type of Diseases affected by Family Member since last 3 Months
Types Agricultural Labour Non-Agricultural Labour
Cold 9 (13.63%) 3 (15.78%)
Fever 17 (25.75%) 4 (21.06%)
Diabetes 2 (3.03%) 0
Other 5 (7.58%) 0
No Disease 33 (50%) 12 (64.15%)
Total 66 (100%) 19 (100%)
Source: Computed by field survey
Above table 12 exhibits that, the study also collected data of health conditions (diseases affected by
last 3 months) of agricultural and non-agricultural labour households. The study finds 13.63 percent
of agricultural labors are affected often cold followed by 25.75 percent fever, 3.03 percent diabetes,
7.58 affected by other disease but 50 percent of households’ member are not affected any disease or
fit for work. Meanwhile, among the non-agricultural labor are 15.75 percent affected by cold
IJSRR, 8(2) April. – June., 2019 Page 4282
Table 13: Family Secured Insurance
Type Agricultural Labour Non-Agricultural Labour
Yes 25 (37.88%)) 9 (47.36%)
No 41 (62.12%) 10 (52.64%)
Total 66 (100%) 19 (100%)
Source: Computed by field survey
Above table 13 reveals and study finds 37.88 percent of the agricultural labor households are secured
family insurance and 62.12 percent of the households non secured any family insurance. Whereas,
non-agricultural labour 52.64 percent of the households are not secures family insurance and 47.36
percent are secured their insurance. Study reveals that majority of the agricultural and
non-agricultural labors are not secured any type of households insurance.
CONCLUSION:
Agriculture plays a significant role in overall socio-economic development. In India, the
trend has not been limited to just declining share of agriculture in total employment but also has led
to a significant decline in absolute number of people employed in the agricultural sector. The results
revealed that majority 35.58 respondents is illiterate and 46.98 percent have completed primary level
of education and second important issue is that majority 77.65 percent of the respondents annual
income is less than 11000 only. The study finds some very crucial issue is that 40 percent of the
households do not have own latrine facility and 62 percent of the households are still using firewood
for cooking for preparing food. 60 percent of the households do not have access any family
insurance. Whereas, 84.71 percent households are secured BPL card, it means still they are very poor
in the society.
REFERENCES
1. Census of India, Economic characteristics of Indian Population, Office of the Registrar
General, Government of India Report, New Delhi, 2011.
http://www.censusindia.gov.in/2011Census/pes/Pesreport.pdf
2. Alkire, S., & Foster, J. Designing the Inequality-Adjusted Human Development Index
(HDI).2010 OPHI: Working Paper, (37).
3. Agriculture Statistics at a Glance, sourced from Registrar General of India, New Delhi: 2001
& 2011
4. Basu, D.N., Kashyap, S.P. Rural Non-agricultural Employment in India - Role of
Development Process and Rural-Urban Employment Linkages, Economic and Political
IJSRR, 8(2) April. – June., 2019 Page 4283 5. Government Report, Labour in Indian Agriculture: A Growing Challenge: Federation of
Indian Chambers of Commerce & Industry (FICCI): 2015
6. R.R.Biradar. Effect of Non-farm Income on poverty Evidence from Punjab province
Pakistan. 2010
7. Sardana P K, Manocha V and Gangwar A C. Nature and pattern of changes in rural non-farm
employment in Haryana. Indian J agrie. Eeon: 1995; (50): 417-421.
8. Thoms Reardon Links Between Nonfarm Income and farm Investment in African
Households: Adding the Cappaital Market Perspective.” American Journal of Agricural
Economics: Staff paper No. 1994; 76(5): 9490.
9. Unni, J. Diversification of economic activities and non-agricultural employment in rural
Gujarat, Economic and Political Weekly 1996; 31(33): 2243- 2251.
10.Venue B. N.; Yeah K.B.and Gaddi GM. Agricultural Labours migration and remittance in