1
Sosio-Economic Determinants Of
Multidimensional Poverty In The Rural And
Urban Areas Of East Java
Abdus Salam, Devanto Shasta Pratomo, Putu Mahardika Adi Saputra
Abstract— Multidimensional poverty measurement arises from dissatisfaction with measuring poverty using only a monetary perspective, where the measurement of monetary poverty is not enough to adequately reflect the situation that actually occurs in poor households. Using Susenas March 2018 and Podes 2018, this study aims to look at the effect of household socioeconomic characteristics on multidimensional poverty status in urban and rural areas. From the analysis using logistic regression, households with female household heads are more likely to experience multidimensional poverty in rural areas and vice versa in urban households with female household heads more likely to not experience poverty. Road infrastructure in villages is still a powerful factor in multidimensional poverty in rural areas, but this does not apply in urban areas. Working as a formal worker in urban areas will reduce the chance of experiencing multidimensional poverty, but in rural areas this does not apply. Other variables that have a strong influence on multidimensional poverty in urban and rural areas are household head job status, household head age, dependency ratio, families with disabilities, household head education and access credit. From this result, the government can focus on poverty alleviation programs according to significant variables in each region, such as asphalt development in rural areas, improvement of women's skills in rural areas, expansion of formal employment in urban areas, special assistance for families with disabilities and education in all areas both urban and rural.
Keyword: Multidimensional Poverty, Susenas, Podes, Alkire-Foster Methods, Logit Regression.
—————————— ——————————
1.
INTRODUCTION
In January 2015, a proposal for Sustainable Development Goals (TPB) was finally formed which had 17 main objectives including poverty eradication, fighting hunger, healthy and prosperous community life, quality education, gender equality, proper water and sanitation, environmentally friendly energy, economic growth and decent work, industry, innovation, infrastructure, decreasing inequality, urban planning and housing with a sustainable concept, consumption and production, climate change, marine ecosystems, terrestrial ecosystems, peace, justice and strong institutions, and partnerships to achieve goals . The first goal of the SDGs / TPB is to end poverty anywhere and in any form in the year 2030. In this context there are two objectives, namely eradicating poverty in terms of quantity and eradicating poverty in terms of the dimension (form) of poverty.To achieve the goal of alleviating poverty in all its forms it is not enough to just look at poverty by looking at someone's inability to get a decent income every day. Sen said that we would lose another basic social problem when we looked at poverty in terms of income only [1]. Sen explicitly wanted to say that poverty is not unidimensional, but poverty is multidimensional or complex. Sen revealed the importance of completing monetary poverty analysis by using multidimensional poverty measurement, one of which is the way the income conversion received by someone in spending their consumption goods is not all the same so that high income does not guarantee that someone is able to fulfill his basic needs [2]. The ability to convert a certain amount of income into a function varies according to demographic characteristics, socioeconomic characteristics, geographical conditions and other individual conditions such
as disability or in other words the conversion factor of people varies. Furthermore, basic access services that can be accessed by households or individuals can vary such as water, health, and education which are often not provided through the market. Poverty is a multidimensional problem not just a matter of income but also expressed by Bourguignon that not everyone can spend their income appropriately to improve their quality of life, this is why there are still people who are deprived in terms of education, nutrition and daily life where in fact they are not poor people who are measured in monetary terms [3]. This research was conducted in East Java, Indonesia. The highest absolute number of poor people in Indonesia is still held by East Java Province in the amount of 4,332,590 people (10.98 percent). Poverty disparity in East Java is also still very high between urban and rural areas. This is indicated by the release of the Official Statistics of BPS in March 2018 that 7.06 percent or 1,457,610 people in urban areas are poor [4]. While the percentage of poor people in rural areas is much greater by 15.30 percent or as many as 2,874,970 poor people. Urban and rural disparities are still quite high at around twice. This study aims to examine the influence of household socioeconomic characteristics on multidimensional poverty status in each urban and rural area. This research wants to see the diversity of poverty problems that may not be the same between urban and rural areas. There is a lot of research on poverty, but each one rarely uses the concept of multidimensional poverty to understand poverty in an area. Megbowon in 2018 conducts research on multidimensional poverty in South Africa [5]. The result is that there are different variables that affect multidimensional poverty in urban and rural areas. Adeoti in 2014 also examines multidimensional poverty in rural Nigeria [6]. Livelihoods in agriculture, women household, big size family increase the chances of experiencing poverty. Likewise with Adepoju in 2018, the higher the education, the opportunity to experience multidimensional poverty decreases [7].
————————————————
Abdus Salam is currently pursuing masters degree program in
Economics in University of Brawijaya, Indonesia E-mail:
abdussalam@bps.go.id
Devanto Shasta Pratomo is one of the professors at The Faculty of
Economics and Business at University of Brawijaya, Indonesia.
Putu Mahardika Adi Saputra is the lecturer at The Faculty of Economics
1446
2
L
ITERATURER
EVIEWMultidimensional Poverty
Measurement of poverty with a multidimensional perspective is different from measurements that have existed so far, namely using expenditure or consumption. MPI views poverty more holistically and more deeply covers health issues, education is also about the quality of life, or not just from the perspective of income or expenditure. Looking at poverty from various things have been conveyed by Sen that poverty has a multidimensional nature which includes health, education, quality of life, democracy, freedom of economic access [1]. Study development concerning poverty has been through quite significant shifting in Human Development Report (HDR) analysis proposed by United National Development Program (UNDP) and Oxford Poverty and Human Development Initiative (OPHI). Since 2010, UNDP and OPHI agrees a new poverty measurement through Multidimensional Poverty Index (MPI) contained in HDR 2010. Multidimensional poverty measurement is first developed by OPHI and UNDP in 2010. The aim is to describe holistic poverty condition. Multidimensional poverty measurement employs 3 types of dimensions, those are health, education, and life standard. There are 10 indicators in this methods.
3 R
ESEARCHM
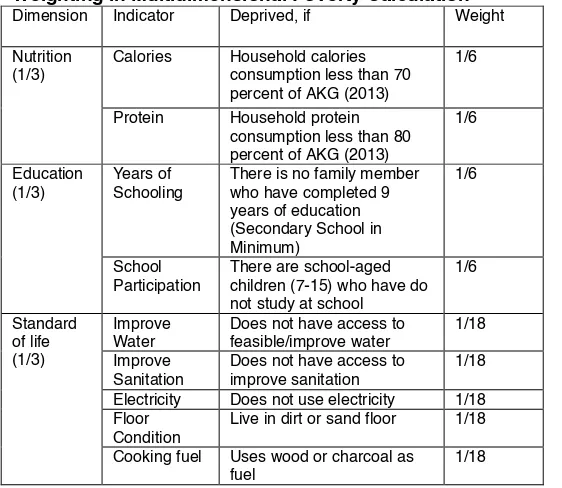
ETHODOLOGYData used in this research is raw data of Survei Sosial Ekonomi Nasional (Susenas) March 2018 East Java and Pendataan Potensi Desa (Podes) 2018 East Java. Susenas Data was obtained from BPS-Statistics Indonesia (BPS) which is an official statistics office in Indonesia where the survey was performed twice a year in March and September. There were 29.780 household samples used in this research. As explained in the table below, this research used Alkire-Foster Methods in determining multidimensional poverty using several modified indicators [8]. The component in multidimensional poverty measurement consists of three dimensions which have the same weight of 1/3.
Table 1. Dimension, Indicator, Cut off Deprivation and Weighting in Multidimensional Poverty Calculation
Dimension Indicator Deprived, if Weight
Nutrition (1/3)
Calories Household calories consumption less than 70 percent of AKG (2013)
1/6
Protein Household protein consumption less than 80 percent of AKG (2013)
1/6
Education (1/3)
Years of Schooling
There is no family member who have completed 9 years of education (Secondary School in Minimum)
1/6
School Participation
There are school-aged children (7-15) who have do not study at school
1/6
Standard of life (1/3)
Improve Water
Does not have access to feasible/improve water
1/18
Improve Sanitation
Does not have access to improve sanitation
1/18
Electricity Does not use electricity 1/18 Floor
Condition
Live in dirt or sand floor 1/18
Cooking fuel Uses wood or charcoal as fuel
1/18
Assets Does not have car or motorboat and does not have more than one of the following asset, such as motorcycle, cycle, boat, cable television, AC, water heater, 12 kg gay cylinders or more, refrigerator and telephone.
1/18
Source: Alkire et al (2011), Modified.
Based on this AF Methods, a household which experiences poverty deprivation is more than 0.33 or 33.33%. the measurement stages are as follow:
Choosing analysis unit. The analysis unit is household. Choosing poverty dimension
Choosing the indicator from each dimension Determining cut off deprivation of each indicator
Determining the weight (𝑤) of each dimension/indicator Calculating deprivation score (∑ 𝐶) experienced by a
household
∑ 𝐶 = 𝑤𝐼 + 𝑤𝐼 + 𝑤𝐼 + … + 𝑤 𝐼
where 𝐼 = 1 if a household is deprived at indicator of i and
𝐼 = 0 if a household is not deprived at indicator of i.
Determining the poor and not-poor household using total deprivation score. A household is multidimensional poor if the total deprivation score (∑ 𝐶)is more than or equal to 0.33. However, if the score is less than 0.33, then it is defines as not poor and its deprivation score is change by zero (deprivation censor). If a household is deprived in all indicators, then ∑ 𝐶 = 1, if a household is not deprived in all indicators, then ∑ 𝐶 = 0.
Further analysis is to analyze the determinants of household socioeconomic characteristics on multidimensional poverty status in each region, namely urban and rural areas. This analysis use a logit regression. The equation of the logistic regression function is as follows:
= (
1 )
= + + + + + + +
+ + + +
Where,
Y = household poverty status (multidimensional poor=1, non-multidimensionally poor=0)
X1 = household head sex / HHH_sex (women=1, others=0)
X2 = household headfield job (agriculture=1, others=0)
X3 = dependency ratio (numerik)
X4 = familiy with disability (yes=1, no=0)
X5 = main village road (asphalt=1, other=0)
X6 = HHH_elementary school (yes=1, others=0)
X7 = HHH_secondary and senior high school (yes1, others=0)
X8 = HHH_collage (yes=1, others=0)
X9 = receive formal credit access (yes=1, others=0)
X10 = receive nonformal credit access (yes=1, others=0)
X11 = household head job status (formal worker=1, others=0)
4 R
ESULT4.1. Descriptive Research Data
1447
rural areas more heads of households have less education. This shows that the majority of people in rural areas do not really consider education as a component in improving the quality of human capital. In urban areas, most household heads work as formal workers and vice versa in rural areas more work in the informal sector. Table 2 also shows that the condition of road infrastructure in urban areas is better than in rural areas.
Table 2. Descriptive sample data
Variabel
Urban Rural
Poor Not
poor Poor Not Poor HHH_sex Women Man 449 1783 2462 10947 915 2599 1634 8991 HHH Field job
Agriculture Others 516 1716 2069 11340 2210 1304 5454 5171 Dependency ratio mean=36,40 mean=39,68 Family with disability
Yes No 320 1912 1100 12309 508 3006 916 9709 Main village road
Asphalt No 2200 32 13203 206 3118 396 9783 842 HHH Education Never schooling Elementary school 2nd & Senior High School Collage 797 669 664 102 2565 3185 6053 1606 2071 1209 217 17 3272 3909 3095 349 Credit access Not have access Formal credit Nonformal credit 1622 486 124 8570 4138 701 2827 481 206 7161 2898 566 HHH Job status
Formal worker Others 722 1510 5858 7551 601 2913 2779 7846 Total 2232 13409 3514 10625
15641 14139
Source: Processed from Susenas March 2018 and Podes 2018.
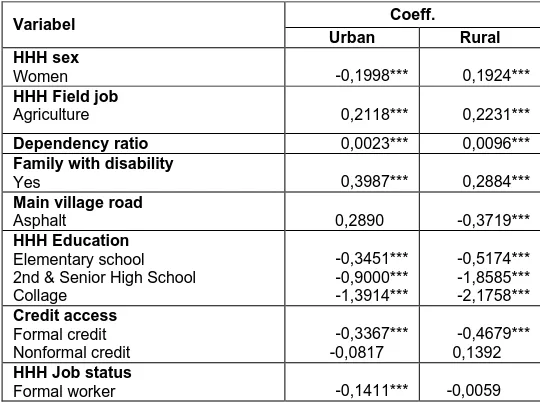
4.2. Determinants of Multidimensional Poverty
This section presents the results of logistic regression estimates from the determinant model of household socioeconomic characteristics of multidimensional poverty status, both in urban and rural areas. Two logistic regression models with estimated coefficients are presented in table 3 below. The sex of the household head has a significant effect on all multidimensional poverty models, both in urban and rural areas. But interestingly, the direction of the relationship between the sex of the household head and the poverty status differs in each region. In rural areas, female household heads are more likely to experience multidimensional poverty. There is still discrimination against women in employment opportunities, income, education, and productive capital assets that are more dominated by men in rural areas [6] [9] [10]. This has caused female headed households in rural areas to be more likely to experience poverty. Unlike in rural areas, women in urban areas are more empowered or households headed by a woman have a lower chance of experiencing multidimensional poverty than men. This is certainly contrary to the phenomenon of "feminization of poverty". Most female household heads in urban areas have better education compared to female household heads in rural
areas, so this can be a human capital for participation in the world of work. Female household head has the freedom to decide whether to enter the workforce or not. Some of the women who become heads of these ouseholds because their husband migrating for work, so that the contribution of remittances to spending their daily needs is quite large.
Table 3. Estimation Logit Regression Determinants of Household Multidimensional Poverty In Urban and Rural Areas.
Variabel Coeff.
Urban Rural HHH sex
Women -0,1998*** 0,1924***
HHH Field job
Agriculture 0,2118*** 0,2231***
Dependency ratio 0,0023*** 0,0096*** Family with disability
Yes 0,3987*** 0,2884***
Main village road
Asphalt 0,2890 -0,3719***
HHH Education Elementary school 2nd & Senior High School Collage -0,3451*** -0,9000*** -1,3914*** -0,5174*** -1,8585*** -2,1758*** Credit access Formal credit Nonformal credit -0,3367*** -0,0817 -0,4679*** 0,1392 HHH Job status
Formal worker -0,1411*** -0,0059
Source: Processed from Processed from Susenas March 2018 and Podes 2018 with STATA.
1448
However, this variable is not significant in the urban model. The condition of road infrastructure in urban areas, which are mostly asphalted, causes this variable to be less relevant in urban areas. People in urban areas have no problems with roads. The higher the education, the less chance to experience poverty. Education is an important human capital to expand employment opportunities and to live a better life so as to avoid poverty in any form [16] [17] [7]. This variable is significant in all models.
Households that receive formal credit services, this will be beneficial to reduce the chances of experiencing poverty compared to those who do not get. Formal access to credit is generally related to household productive consumption. This productive household expenditure can be in the form of business credit so that it is closely related to increasing income. Credit funds received can also be used to improve the quality of life such as improving housing facilities, adding assets such as vehicles and so on. The household who gets access to credit services will reduce the opportunity to experience poverty, especially households that get credit from formal institutions [11] [18]. But the results are different on non-formal loans. There is no difference between households that receive non-formal credit and those who do not. Non-formal credit has no effect because most of the funds obtained from personal are only used for consumption expenditures that are not productive. The employment status of household heads has a significant effect only in urban areas, whereas in rural areas this variable is not significant. The formal worker household head are less likely to fall into poverty [19]. But interestingly this variable is only significant in urban areas but not significant in rural areas. Most formal workers are found in urban areas. Whereas in rural areas the percentage of people working in the formal sector is only half the value of urban areas. So that the influence of this employment status is more influential in urban areas.
5 C
ONCLUSIONA
NDS
UGGESTIONFrom the analysis in the previous section, we have conclusions and suggestions as follows:
1. Female household heads in rural areas are more likely to experience poverty, whereas in urban areas female household heads are more empowered. The government can provide job training to improve skills to enter the workforce. The government needs to intensify the family planning program (Keluarga Berencana Program) in rural areas, in addition to reducing the household dependency ratio but also so that women do not spend time on domestic affairs but can enter the workforce.
2. The results showed that the presence of family members with disabilities would burden the family. The government can provide social assistance incentives in the form of expanding social assistance (Program Keluarga Harapan Plus) in Indonesia specifically for disabilities.
3. The condition of road infrastructure is very influential in rural areas but not in urban areas. The government is expected to be able to construct road infrastructure with the quality of asphalt roads in rural areas.
4. Education is a key factor if you want to be free from poverty anywhere, both in urban and rural areas. The government can provide cheap education up to high school level so that education can be enjoyed by the lower classes.
5. Higher education makes it easier for someone to enter
formal sector employment. Formal workers are influential in urban areas. The government is expected to provide more formal sector employment in urban areas so that opportunities to experience poverty can be reduced.
6 A
CKNOWLEDGEMENTWe are thankful to Indonesian Ministry of National Development Planning (BAPPENAS) for Funding this project.
R
EFERENCES[1] Prakarsa, “Indeks Kemiskinan Multidimensi Indonesia,” Jakarta: Prakarsa. 2014.
[2] S. Alkire and M. E. Santos, “Measuring Acute Poverty in the Developing World : Robustness and Scope of the Multidimensional Poverty Index,” World Dev., vol. 59, pp. 251–274, 2014.
[3] Bourguignon et al., “Millennium Development Goals at Midpoint : Where do we stand and where do we need to go?,” Eur. Rep. Dev., pp. 1–74, 2008.
[4] BPS, “Profil Kemiskinan di Indonesia Maret 2018,” Badan Pus. Stat., pp. 1–8, 2018.
[5] E. T. Megbowon, “Multidimensional Poverty Analysis of Urban and Rural Households in South Africa,” Stud. Univ.
Babeș-Bolyai Oeconomica, vol. 63, no. 1, pp. 3–19, 2018.
[6] A. I. Adeoti, “Trend and determinants of multidimensional poverty in rural Nigeria,” J. Dev. Agric. Econ., vol. 6, no. 5, pp. 220–231, 2014.
[7] A. Adepoju, “Determinants of poverty among rural households in Nigeria,” Int. Assoc. Agric. Econ. July
28-August 2, 2018, Vancouver, Br. Columbia 276027, vol. 18,
no. 1, pp. 47–61, 2018.
[8] S. Alkire and J. Foster, “Counting and multidimensional poverty measurement,” J. Public Econ., vol. 95, pp. 476– 487, 2011.
[9] Eclac, Understanding poverty from a gender perspective. Women and Development Unit of the Economic
[10]Commission for Latin America and the Caribbean (ECLAC). 2004.
[11]Z. H. Javed and A. Asif, “Female households and poverty: A case study of Faisalabad District,” Int. J. Peace Dev. Stud., vol. 2, no. 2, pp. 37–44, 2011.
[12]L. Baiyegunhi and G. Fraser, “Determinants of Household Poverty Dynamics in Rural Regions of the Eastern Cape Province, South Africa,” 3rd African Assoc. Agric. Econ. 48th Agric. Econ. Assoc. South Africa Conf. Cape Town, South Africa, pp. 3–33, 2010.
[13]A. Abufhele and E. Puentes, “Poverty Transitions : Evidence for Income and Multidimensional Indicators,”
Work. Pap. wp333, Univ. Chile, Dep. Econ., 2011.
[14]J. Braithwaite and D. Mont, “Disability and poverty: A survey of World Bank Poverty Assessments and implications,” Alter, Eur. J. Disabil., vol. 3, no. 3, pp. 219– 232, 2009.
[15]M. Pinilla and Roncancio, “Disability and poverty: Two related conditions. A review of the literature,” Rev. Fac. Med., vol. 63, no. 3, pp. S113–S123, 2015.
[16]D. R. P. Artha and T. Dartanto, “The multidimensional approach to poverty measurement in Indonesia: Measurements, determinants and its policy implications,”
J. Econ. Coop. Dev., vol. 39, no. 3, pp. 1–38, 2018. [17]Bautista, “Explaining Multidimensional Poverty: A
1449
3, pp. 30–58, 2018.
[18]E. H. Jacobus, P. . Kindangen, and E. N. Walewangko, “Analisis Faktor-Faktor Yang Mempengaruhi Kemiskinan Rumah Tangga Di Sulawesi Utara,” J. Pembang. Ekon. Dan Keuang. Drh., vol. 19, no. 7, pp. 1–16, 2019.
[19]T. Das, “Does credit access lead to expansion of income and multidimensional poverty? A study of rural Assam,”
Int. J. Soc. Econ., vol. 46, no. 2, pp. 252–270, 2018. [20]N. Taufiq, “Pengaruh Dinamika Sektor Pekerjaan