2501
Common Metrics For Object – Oriented Software
Maintainability Model
Dr. N.V. Syma Kumar Dasari
Abstract: In object-oriented (OO) software maintainability improvement, design phase plays crucial role in the form of various Unified Modeling Language (UML) diagrams. Generally the software maintainability is the non functional requirement in the nature. So, this paper mainly concentrates on the non-linear behavior of the maintainability and its factors. To find out the common metrics for the OO software Maintainability factors i.e., Understandability, Modifiability and Analyzability exponential model is used with the help of regression technique. These common sub factors are placed in the form of the four multivariate models to measure the OO software maintainability. The developed models were also statistically validated and applied on some sample values of the maintainability factors to attain the good results.
Index terms: Analyzability, Analyzability model, Maintainability model, Maintainability, Modifiability, Modifiability model. OO Software , Software Metrics, UML Class Diagrams, Understandability, Understandability model,
————————————————————
1 INTRODUCTION
The quality of the software plays vital role in judging the capability of the software. Software maintainability is the strongest parameter among the various software quality parameters [1] as per preference given by the most of the software developers. The maintainability can be defined as the software system must adapt to change environment and improve the performance by correct the faults in easy manner. Maintainability depends on the several factors due to its non-functional behavior in nature. In these several factors of maintainability Modifiability, Understandability and Analyzability are the most important factors and they play an important role in judging the maintainability of the software product.Maintainability depends on the several factors due to its non-functional behavior in nature. In these several factors of maintainability Modifiability, Understandability and Analyzability are the most important factors and they play an important role in judging the maintainability of the software product. The Understandability factor gives pleasure to the user to know about the software product whether it is suitable for specified tasks and conditions. Modifiability factor provides the information to the user regarding to the improvements, corrections and any other changes are placed in the software system. The Analyzability factor deals about the developer‘s effort on the software product changes and causes for the failures in the detailed analysis manner. This paper is organized in following manner. Section-2 gives the detailed literature survey on the estimation of various OO maintainability models. The used Metrics and Data tables are explained Section-3. Model estimation with the statistical significance and validation of the proposed models for the maintainability and its three important factors are placed in Section-4. Section-5 deals about the conclusion of this paper in simple manner. The future works which are not solved till now are discussed in Section6.
2 LITERATURE SURVEY
Previously several researchers are tried to measure the maintainability of the software system because there is no proven measure for the maintainability which leads to software poor management [2]. In the early stage of predicting the maintainability some estimation models[3], [4], [5] were developed based on the Lines of Code(LOC), Cyclomatic Complexity, Difference Lines of Code(DLOC) and number of modification requests. But, these developed models were not focused on the important factors of the OO software system Maintainability. Muthanna et al. [6] used the polynomial linear regression to develop the Maintainability model. Malhotra and Jain[7] proposed Maintainability model based on nonlinear logistic regression technique based on the various datasets. The above two developed models were not applicable to OO software systems because those were developed for the purpose of finding the Maintainability of the procedural language oriented systems. Hayes and Zhao [8] developed maintainability model based on only two levels i.e., one is easy to maintain and the other level is not easy to maintain the software system. The above two levels are not sufficient to judge the maintainability in good manner for the software system. Kiewkanya et al. [9] developed Modifiability, Understandability and Maintainability include the huge amount of metrics in this models. In the development of these models UML diagrams were not used. Several maintainability models were developed based on the Genero‘s et al. [10] developed 7 levels of sample data set for the Understandability, Modifiability and Analyzability factors by considering the different UML structural class diagrams. Genero et al. [11], [12], [13] estimated OO software maintainability models with the help of their own developed metrics [26] and data set[10]. These models include variety of metrics and more in number. Nazir et al. [14] developed only understandability model for maintainability with the help of MATLAB simulation. This model also includes the more number of metrics in the development. Rizvi and Khan [15] developed Understandability, Modifiability and Maintainability models based on different data sets [9],[10] with the help of backward stepwise regression of the Statistical Package for Social Sciences (SPSS) package. In here also developed ————————————————
models include different and number of metrics in model estimation especially for the modifiability factor. Anfal A. Fadil [16] measured the Understandability, Modifiability and Maintainability by using the Neural Network based Cuckoo Search and Back Propagation (CSBP) algorithm. In this development he did not measured the Analyzability factor and preferred different metrics in different manner. D.N.V.Syma Kumar and R.Satya Prasad [17],[18] proposed various non-linear maintainability estimation models with the help of non-linear exponential and log-linear standards. In the developed models the used dataset contains more number of samples which has class diagrams similar to dataset [10].The levels of Understandability, Analyzability, Modifiability and Maintainability are increased from previous 7 levels to 9 levels by including the Trivial and Consequential levels namely. Here 2-tailed t-test was used to identify the less and most significant sub factors for the Maintainability factors. But, these models contain the different metrics for every estimated model. It is also difficult to user to remember the estimated models in simple manner. Based on the above circumstances there is necessity to simplify the OO software maintainability model like same sub factors (same metrics) for the factors of Maintainability models of the software product.
3 METRICS AND DATASET SELECTION
The design phase of the software life cycle is the early step of finding the maintainability that helps the developers to develop the good software product. In the prediction of OO software system maintainability in design phase UML class diagrams play the important role. Based on the OO software structural behavior previously several authors [19], [20], [21], [22], [23], [24], [25] proposed various metrics to quantify the system maintainability. In developing the estimation models Generoe ‗s et al. [26] developed UML class diagram based metrics for Maintainability factors was preferred in this paper. The categorized metrics [26] are mainly divided into 3 size based metrics and 8 structural metrics. Number of Classes (NC), Number of Methods (NM) and Number of Attributes (NA) are the size metrics. The structural metrics are developed based on the 4 structural properties of the class diagrams namely Association, Dependency, Aggregation and Generalization. The association based metric is Number of Associations (NAssoc). Number of dependencies (NDep) is the dependency property based metric. Based on the Aggregation property three metrics are developed namely Number of Aggregations (NAgg), Number of Aggregation Hierarchies (NAggH) and Maximum Hierarchy Aggregations (MaxHAgg). The last and most important Generalization property based metrics are Number of Generalizations (NGen), Number of Generalization Hierarchies (NGenH) and Maximum Depth of Inheritance (MaxDIT). Two different data sets are preferred to study the maintainability and its factors in developing the non-linear estimation models for Maintainability.To quantify the Understandability, Modifiability and Analyzability factors used the data set developed by Genero et al.[10]. In the model estimation process non-linear exponential standard was applied on the taken dataset. In the maintainability model prediction Understandability, Modifiability and Analyzability values are taken from the Genero et al.[10] developed data set and
identified the maintainability levels by using the weighted sum method[9],[18]. The non-linear exponential standard again applied on the maintainability dataset to quantify the maintainability in proper manner.
4 MODELS ESTIMATION
In this paper model estimation purpose exponential standard was utilized. The exponential standard is the non-linear method to estimate the models in another way rather than linear method. The multivariate exponential standard is in the form of
-) -dY4 + CY3 + bY2 + aY1 + e(1 =
X (1)
Convert the non-linear exponential standard into linear model by applying the log normal (Ln) form on both the sides of the equation(1).
--)) -dY4 + CY3 + bY2 + aY1 + Ln(e(1 =
Ln(X) (2)
The above equation (2) is simplified as in the following equation (3).
-+ Y4 * d + Y3 * c + Y2 * b + Y1 * a + 1 =
Ln(X) (3)
The above equations are applied on the datasets of the Understandability, Modifiability, Analyzability and Maintainability individually. In the consideration of the model estimation 23(80%) of the total 28 class diagrams data was used. Remaining 5 samples are used for the purpose of validation. In the maintainability factors models estimations SPSS backward step wise regression technique.
4.1 Understandability Model
The Understandability (Und) model contains the model estimation with the statistical significance and validation of the actual and proposed values with the model also placed in the following section.
4.1.1 Statistical Significance and validation of the proposed model
TABLE 4.1.1
Constant and Coefficients of Model
Coeff. S.Error t Sig. (Constant) 0.44 0.085 4.755 0
NC 0.071 0.013 5.428 0 NGen -0.041 0.02 -2.029 0.057 MDIT 0.121 0.058 2.097 0.05
2503
here and other 11 structural and size metrics are the normal values in the prediction of the model.
MaxDIT * 0.121 +
NGen * 0.041 -NC * 0.071 + 0.404 = Ln(Und)
(4)
In the identification of the statistical significance of the proposed model along with the t-values Analysis of Variance (ANOVA) and model summary are also measured and placed in the Table 4.1.2 and Table 4.1.3 respectively.
TABLE 4.1.2 ANOVA of Model
Sum of Squares df
Mean
Square F Sig. Regression 4.714 3 1.571 44.85 .00
Residual 0.666 19 0.035
Total 5.38 22
TABLE 4.1.3 Model Summary
R R2 AdjR2 Std. Error
0.936 0.876 0.857 0.18717
The actual values of the understandability factor need to compare to the calculated values (measured with the help of estimated model) after developing the Understandability model. The actual and calculated values are placed in Table 4.1.4. The correlation between the actual and calculate values of understandability are identified with 99% level of confidence levels shown in Table 4.1.5. Actual and calculated values of Understandability are indicated in the tables as UA and UC.
TABLE 4.1.4
Actual and calculated values of Model
1 2 3 4 5
UA 0.69 1.1 1.39 1.61 1.79 UC 0.84 0.94 0.93 1.39 1.75
TABLE 4.1.5
Correlation between UA & UC
UA UC
UA 1 0.86
UC 0.86 1
4.2 Analyzability Model
The proposed Analyzability (Anl) model with backward stepwise regression and the identified results are shown in the following section.
4.2.1 Statistical Significance and validation of the proposed model
TABLE 4.2.1
Constant and Coefficients of Model
Coeff. S.Error T Sig. (Constant) 0.438 0.083 5.299 0
NC 0.074 0.013 5.812 0
NGen -0.053 0.019 -2.706 0.014 MDIT 0.164 0.056 2.93 0.009
The Analyzability model coefficients, t-values and the other useful information regarding the model are shown in Table 4.2.1. Based on the coefficients and constants of the above statistical table resultant model was taken as equation (5). This model also contains the same metrics as per understandability model.
MaxDIT *
0.164 + NGen * 0.053
NC * 0.074 + 0.438 = Ln(Anl)
(5)
For the better improvement of the statistical significance of the Analyzability model ANOVA and model summary are identified and shown in the below Tables 4.2.2 and 4.2.3.
TABLE 4.2.2
ANOVA of Model
Sum of Squares Df
Mean
Square F Sig. Regression 4.698 3 1.566 47.289 .000 Residual 0.629 19 0.033
Total 5.327 22
TABLE 4.2.3
Model Summary
R R2 AdjR2 Std. Error
0.939 0.882 0.863 0.18198
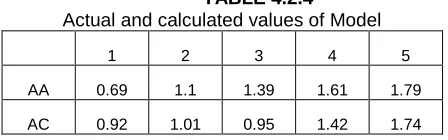
In the validation process of the estimated Analyzability model comparison between the actual and calculated values of Analyzability levels was done and placed in Table 4.2.4. The actual Analyzability and calculated Analyzability are indicated in the following tables as AA and AC respectively. The Pearson correlation between the actual and calculated values of Analyzability with the 99% level of confidence was measured and shown in Table 4.2.5. The resultant values are more satisfied for the Analyzability validation.
TABLE 4.2.4
Actual and calculated values of Model
1 2 3 4 5
TABLE 4.2.5 Correlation between AA & AC
AA AC
AA 1 0.83
AC 0.83 1
4.3 Modifiability Model
The Modifiability (Mod) dependant factor is measured in the following section. Statistical significance and validation of the proposed model also discussed here.
4.3.1 Statistical Significance and validation of the proposed model
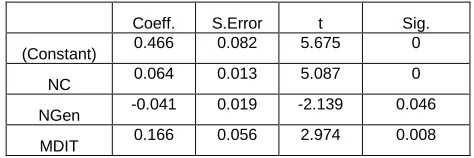
TABLE 4.3.1 Constant and Coefficients of Model
Coeff. S.Error t Sig.
(Constant) 0.466 0.082 5.675 0
NC 0.064 0.013 5.087 0
NGen -0.041 0.019 -2.139 0.046 MDIT 0.166 0.056 2.974 0.008
The statistical importance of the Modifiability can be measured in the form of coefficients, constant, t-values and the other related and useful information shown in Table 4.3.1. Equation (6) is the representation of the modifiability model which includes significant sub factors from the 11 class diagram oriented metrics. The Modifiability factor also had the same factors as the previous two developed models in this paper. Hence all the three important factors of maintainability has the same metrics namely Number of Classes (NC), Number of Generalizations (NGen) and Maximum depth of Inheritance (MaxDIT). The three factors models had the same metrics and also less in number and easy to remember in easy manner.
MaxDIT *
0.166 + NGen * 0.041
NC * 0.064 + 0.466 = Ln(Mod)
(6)
The measured values of the ANOVA are place in the Table 4.3.2.
TABLE 4.3.2 ANOVA of Model
Sum of Squares Df
Mean
Square F Sig. Regression 4.727 3 1.576 48.116 0
Residual 0.622 19 0.033
Total 5.35 22
The model summary of the Modifiability model also measured and shown in Table 4.3.3.
TABLE 4.3.3
Model Summary
R R2 AdjR2 Std. Error
0.94 0.884 0.865 0.18097
The validation of the Modifiability model was done and placed in the Table 4.3.4.and Table 4.3.5. The actual and calculate values of the Modifiability are indicated as the MA and MC in the following tables. The Pearson correlation between the actual and calculate values of Modifiability was done with the 99% level of confidence. The comparison and correlation values between the actual and calculated modifiability levels are in good manner.
TABLE 4.3.4
Actual and calculated values of Model
1 2 3 4 5
MA 0.69 1.1 1.39 1.61 1.79
MC 0.95 1 1.1 1.5 1.77
TABLE 4.3.5
Correlation between MA & MC
MA MC
MA 1 0.89
MC 0.89 1
4.4 Maintainability Model
The Maintainability (Main) model considers the Understandability, Analyzability and Modifiability factors. The Pearson correlation between the three factors of the maintainability shown in Table 4.4.1 to say the strong correlation between the maintainability and its important factors.
TABLE 4.4.1
Correlation between Und, Anl, Mod & Main
Und Anl Mod Main
Und 1 0.959 0.977 0.981
Anl 0.959 1 0.975 0.979
Mod 0.977 0.975 1 0.994
Main 0.981 0.994 0.994 1
The statistical significance and validation of the proposed Maintainability models are placed in the following section.
2505 TABLE 4.4.2
Constant and Coefficients of Model
Coeff. S.Error t Sig.
(Constant) 0.132 0.07 1.879 0.076
Und -0.002 0.076 -0.033 0.974
Anl 0.136 0.076 1.783 0.09
Mod 0.156 0.096 1.625 0.121
The statistical significance data in the form t-values, coefficients and other information is shown in Table 4.4.2. The estimated model of Maintainability is identified as in the equation (7). The three important factors must be placed in the model form to judge the influence of them individually in the model estimation.
Mod * 0.156 + Anl * 0.136 +
Und * 0.002 -0.132 = Ln(Main)
(7)
The Maintainability model ANOVA values are shown in Table 4.4.3.
TABLE 4.4.3
ANOVA of Model
Sum of Squares df
Mean
Square F Sig. Regression 4.986 3 1.662 92.568 .000
Residual 0.341 19 0.018
Total 5.327 22
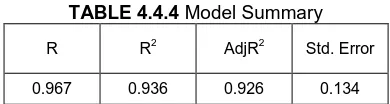
The model summary with various values of R is placed in the table 4.4.4.
TABLE 4.4.4 Model Summary
R R2 AdjR2 Std. Error
0.967 0.936 0.926 0.134
The comparison of the actual Maintainability (MAIN-A) and calculated values of Maintainability (MAIN-C) was taken place in the table 4.4.5. The Maintainability values can be calculated with the help of proposed model (7).
TABLE 4.4.5 Actual and calculated values of Model
1 2 3 4 5
MAIN-A 0.69 1.1 1.39 1.61 1.79 MAIN-C 0.71 1 1.29 1.58 1.87
The Pearson correlation between the actual and calculated values of maintainability with 99% level of confidence is
shown in Table 4.4.6. The values of the both tables are in more considerable manner.
TABLE 4.4.6 Correlation between MAIN-A & MAIN-C
MAIN-A MAIN-C
MAIN-A 1 0.987
MAIN-C 0.987 1
5 CONCLUSION
In the estimation process of the OO software maintainability and its three factors i.e., Understandability, Analyzability and Modifiability are used exponential non-linear standard here. The non-linear exponential model can be converted into linear form and then applied multiple liner regression technique. The developed Understandability, Analyzability and Modifiability models contain only three common sub factors i.e., Number of Classes (NC), Number of Generalizations (NGen) and Maximum Depth of Inheritance (MDIT). The statistical significance of the four models is identified. The validation of the proposed model values are compared to the actual values of maintainability and its factors also. The correlation between actual and proposed values also in more considerable manner. These models are very much easy to remember compare to any other previous models. Hence, the conclusion of this paper is maintainability mostly depends on the Generalization property of the structural class diagrams.
6 FUTURE SCOPE
Inclusion of number factors in the maintainability estimation model leads to the most effective model for the developers in the software industry. There is lot of need to include more number of factors i.e. Reusability, Availability, Flexibility, Testability, Reliability and Portability etc in the development of the maintainability model. Another major issue is the applicability of the various other non-linear standards i.e. polynomial, logarithmic... etc for this non-functional requirement to get the most appropriate maintainability of the software product.
REFERENCES
[1] IEEE ―IEEE Standard Glossary of Software Engineering Terminology,‖ IEEE Std. 610. 12-1990. Institute of Electrical and Electronics Engineers, 1990.
[2] M.Dagpinar and J.Jahnke‖ Predicting Maintainability with Object-Oriented metrics –an Empirical Comparison,‖ Proc. 10th
Working Conference on Reverse Engineering (WCRE‘03), 13-17 Nov.2003, pp155-164, 2003.
[3] Welker K.D., and Oman P.W. ―Software Maintainability Metrics Models in Practice, Journal of Defense Software Engineering, vol. 8, no. 11, pp. 19 – 23, 1995.
[5] Polo M., Piattini M.,and Ruiz F. ―Using Code Metrics to Predict Maintenance of Legacy Programs: a Case Study,‖ Proc. of International Conference on Software Maintenance, ICSM 2001, pp. 202-208, IEEE Computer Society, Florence Italy,2001.
[6] Muthanna S., Kontogiannis K., Ponnambalam K. and Stacey B. ―A Maintainability Model for Industrial Software Systems Using Design Level Metrics,‖ Proc. 7th Working Conference on Reverse Engineering(WCRE‘00), 23 - 25 Nov., pp. 248 – 256, Brisbane, Australia,2000.
[7] Malhotra R. and Jain A. ―Software fault prediction for object oriented System: A Literature Review‖, ACM SIGSOFT Software Engineering Notes, 2011. [8] Hayes J.H. and Zhao L. ―Maintainability Prediction: a Regression Analysis of Measures of Evolving Systems,‖ Proc. 21st IEEE International Conference on Software Maintenance, 26 - 29 Sept. 2005, pp. 601 – 604, 2005.
[9] Kiewkanya M., Jindasawat N. and Muenchaisri P. ―A Methodology for Constructing Maintainability Model of Object-Oriented Design,‖ Proc. 4th International Conference on Quality Software, pp. 206 – 213, IEEE Computer Society, 2004.
[10]Genero M., Olivas J., PiattiniM. and Romero F. ―A Controlled Experiment for Corroborating the Usefulness of Class Diagram Metrics at the Early Phases of Object - Oriented Developments,‖ Proc. of the ADIS2001, Workshop on Decision Support in Software Engineering, vol. 84, Spain,2001.
[11]Genero M.,Manso M.E., Piattini M. and Cantone,G. ―Building UML Class Diagram Maintainability Prediction Models Based on Early Metrics‖, 9th
International Symposium on Software Metrics (Metrics 2003), Proceedings IEEE Computer Society, pp. 263-275, 2003.
[12]Genero M., Olivas J., Romero F. and Piattini M. ―Assessing OO Conceptual Models Maintainability‖, In Olive et al. (Eds.), International Workshop on Conceptual Modeling Quality (IWCMQ‘02), Tampere, Finland, LNCS vol.2784, Springer-Verlag, pp. 288-299, 2003.
[13]Genero M., Manso E., Visaggio A., and Piattini M. ―Building Measure- Based Prediction Models for UML Class Diagram Maintainability,‖ Journal of Empirical Software Engineering, vol. 12, no. 5, pp. 517 – 549, 2007.
[14]Nazir M., Raees A. Khan and Mustafa K , ―A Metrics Based Model for Understandability Quantification ― JOURNAL OF COMPUTING, VOLUME 2, ISSUE 4, ISSN 2151-9617,2010. [15]Rizvi S.W.A. and Khan R.A. ―Maintainability
Estimation Model for Object- Oriented Software in Design Phase (MEMOOD)‖, JOURNAL OF COMPUTING, Volume 2, Issue 4, April 2010, ISSN 2151-9617 , 2010.
[16]Anfal A.fadil, "Maintainability Prediction for Software based on class diagram using Back Propagation Neural Network and Coco Search
Algorithm ―International Journal of Computer Applications(0975-8887), vol.178 , no. 35, 201. [17]D.N.V. Syma Kumar & R. Satya Prasad
―Maintainability Model with Object-Oriented Software Metrics‖ International Journal of Engineering & Technology IJET-IJENS Vol:15 No:04 , August 2015.
[18]R.Satya Prasad and D.N.V.Syma Kumar ―Mainatanability of Object-Oriented Software Metrics with analyzability‖ International Journal of Computer Science issues, Volume12,Issue3, May 2015.
[19]Chidamber S.R. and Kemerer C.F.―Towards a Metrics Suite for Object- Oriented Design‖, Proceedings of the 6th Annual ACM SIGPLAN Conference on Object-Oriented Programming,Systems, Languages, and Applications (OOPSLA‘91), October 6-11, Phoenix, Arizona, USA, pp. 197-211, 1991.
[20]Daly J., Brooks A., Miller J., Roper M. and Wood M. ―An Empirical Study Evaluating Depth of Inheritance on Maintainability of Object-Oriented Software Empirical Software Engineering‖, vol. 1, no. 2, pp. 109-132,1996.
[21]Briand L., Morasca S. and Basili V. ―Property-Based Software Engineering Measurement‖, IEEE Transactions on Software Engineering, vol. 22, no. 6, pp. 68-86, 1996.
[22]Henderson-Sellers B. ―Object Oriented Metrics: Measures of Complexity.‖ Pren-tice Hall PTR: Englewood Cliffs, NJ, 1996; pp. 130–132, 1996. [23]Li W. and Henry S. ―Object-Oriented Metrics that
Predict Maintainability‖, Journal of Systems and Software, vol. 23, no. 2, pp. 111-122, 1993.
[24]Marchesi M. ― OOA metrics for the unified modeling
languages.‖ In Proceedings of 2nd Euromicro Conference on Software Maintenance and Reengineering (CSMR'98), Palazzo degli Affari, Italy, pp.67-73., 1998.
[25]Oman P. and Hagemeister J. ―Metrics for Assessing a Software System‘s Maintainability‖, Proc. of Conference on Software Maintenance, Orlando, FL, November 9-12, 1992, Los Alamitos, CA: IEEE Computer Society Press,1992.