United Kingdom Vol. VI, Issue 12, December 2018
Licensed under Creative Common Page 265
http://ijecm.co.uk/
ISSN 2348 0386
“ILLICIT FINANCIAL OUTFLOWS FROM AFRICA”
MEASUREMENT AND DETERMINANTS
Mossadak Anas
Mohammed V University
Faculty of law, economics and social sciences (Salé)
Department of economics and management, Morocco
anas.mossadak@gmail.com
Abstract
Illicit financial outflows can be defined as the capitals that leave from developing countries to tax
havens and western economies as the consequence of political and economic instability and
fear of taxation or confiscation. Nevertheless, the most important motivation of illicit flows
appears to be the desire to hide accumulation of wealth generated by illegal activities such as
corruption and tax evasion. African countries have experienced at least 610 Billions of dollars of
illicit outflows over the period 2005-2014 (Global financial integrity, 2017). This huge outflow of
financial resources could be used to finance productive investments, infrastructure, as well as
social actions aimed to improve the life quality of millions of Africans. The main objectives of this
paper are to analyze the evolution of illicit financial outflows from Africa and investigates their
main determinant using a panel data model. The empirical analysis indicate that lack of
governance and political instability are the main factors encouraging illicit outflows from Africa.
Several actions can be undertaken by the government to reduce the magnitude of illicit flows.
Indeed, governments must improve the transparency of financial transactions and tax
information, enhance customs enforcement to detect intentional misinvoicing of trade
transactions and finally require international companies to publicly declare all their financial
operations and staff levels for each country where they operate.
Licensed under Creative Common Page 266
INTRODUCTION
The latest estimates of the Global Financial Integrity (2017) assess the level of illicit financial
flows at least to 54 billions of dollars for the year 2014 for the whole African continent. Over the
period 2005-2014, the estimation of illicit financial outflows is more than 610 billion of dollars.
These resources represent a huge shortfall for African economies knowing the scarcity of
financial resources and the structural recourse to external indebtedness. They could have been
an important driver for economic and social development, particularly if they are used in
productive investment, access to basic services and infrastructure improvements. Instead, these
funds are placed in the bank accounts of corrupt officials and traffickers in western countries
and tax havens.
Illicit financial flows refer to the transfers of capitals generated by activities such as
bribery, smuggling, criminal activities and tax evasion. They involve also capitals that are gained
through legal activities but transferred in such a way as to circumvent the capital controls
applicable to cross-border transfers. In other words, if capital flows are not recorded or if they
avoid capital controls, they are considered as illegal.
According to Kapoor (2007), illicit financial flows have a number of similarities: they are
not recorded in official balance of payments statistics, they are often associated with losses in
the public sector and gains for individuals and finally, profits from illicit financial flows are
generally not repatriated to their home land. The objective of this paper is to analyze the
evolution of illicit financial flows in Africa during the last decade and identify, through a panel
data analysis, their main determinants in Africa.
CALCULATION METHODOLOGY OF ILLICIT FINANCIAL FLOWS
The global financial integrity (GFI) uses two approaches to estimate illicit financial flows. The
Trade misinvoicing method and the "Balance of Payments Leakage" method. The trade
misinvoicing is calculated by comparing the country's trade statistics with those of its trading
partners in advanced economies. This approach was implemented for the first time by Bhagwati
(1974). The objective is to verify if there is a difference between the exports reported by the
developing country and the declared imports of the developed country from the developing
country. This approach is summarized by the following equations (GFI report 2017): IDjp,t = Ijt– Xpt
EDjp,t = Ipt – Xjt
Where:
Licensed under Creative Common Page 267 Xjt : Developing country j’s exports to partner country p at time t
Xpt : Partner country p’s exports to developing country j at time t
A negative value of IDjp,t indicates import under-invoicing (illicit inflows), and a positive
value shows import over-invoicing (illicit outflows). In the same way, a negative value of EDjp,t
represents export over-invoicing (illicit inflows), while a positive value shows export
under-invoicing (illicit outflows). The GFI relies on the Direction of Trade Statistics (DOTS) database of
the international monetary fund (IMF) to implement this approach.
Balance of payments leakage is the registered amounts in the "Net errors and
omissions" component of the balance of payments. In practice, errors and omissions is a
residual account of the balance of payments which normally displays a very small amount and
must, on average tends to 0. Otherwise, if the errors and omissions are constantly positive
(inflows) or negative (outflows), then they are associated with illicit financial flights (often called
"hot money"). The GFI assumes that these unreported leaks represent unregistered and
possibly illegal transactions.
Balance of payments = Current account balance + Financial transactions balance
+ Net errors and omissions
The sum of the two approaches gives an estimate of the total illicit flows for each
country. It should be noted that the approaches presented above do not include smuggling
activities that are completely beyond the control of the authorities. The flows generated by these
activities are often the source of massive illicit financial flows as traffickers seek to secure funds
generated by their trafficking in foreign countries (Lahlou and Mossadak, 2013).
In the following, we analyze only the financial outflows (and not the inflows) as we
consider that they are more important for the developing countries (loss of resources). Also, the
GFI calculates two types of estimates: the low and high estimates. We will focus only on the low
estimates of illicit flows.
EVOLUTION OF ILLICIT FINANCIAL OUTFLOWS FROM AFRICA
In 2014, the most affected countries by the phenomena of illicit financial outflows are mainly
Nigeria, South Africa, Algeria, Egypt and Morocco. These 5 countries (out of 54) account for
almost 70% of the total capital flight, or 38.4 over 53.8 billions of dollars. On its own, Nigeria has
Licensed under Creative Common Page 268 Figure 1: Illicit financial outflows from African countries in 2014 (billions of dollars)
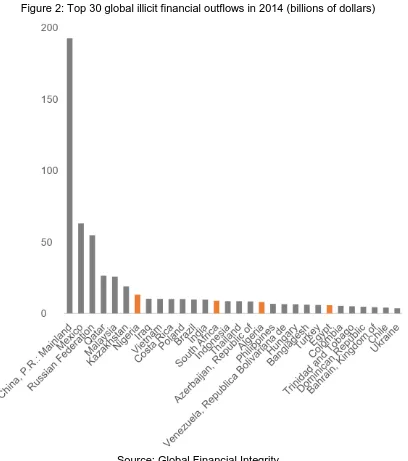
Licensed under Creative Common Page 269 Compared to the emerging and developing countries with the most illicit financial outflows, only
four African countries are among the top 30 countries with the highest amounts of illicit outflows
in the world (Figure 2).
Figure 2: Top 30 global illicit financial outflows in 2014 (billions of dollars)
Source: Global Financial Integrity
Over the period 2005-2014, the African continent experienced a massive illicit capital outflow of
about 610 billion dollars. The top 5 countries, namely Nigeria, South Africa, Algeria, Egypt and
Licensed under Creative Common Page 270 Figure 3: Illicit financial outflows from African countries during the period
2005-2014 (billions of dollars)
Source: Global Financial Integrity
In a more global perspective, the phenomenon of illicit financial flows impacts all the developing
countries but with different intensity. Indeed, the sub-Saharan countries are the most affected by
illicit outflows as they represent at least 7.5% of their total trade. Countries of Latin America and
developing European countries came second with about 6% and finally MENA region and Asia
Licensed under Creative Common Page 271 Figure 4: Illicit financial outflows from developing countries (%of trade in 2014)
Source: Global Financial Integrity
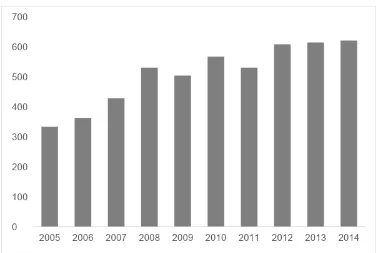
Another important fact is that despite the efforts of national and international authorities, the
illicit financial outflows from developing countries are growing rapidly. Despite a fall in 2011,
between 2005 and 2014, the annual average growth rate is 7.6% (figure 5).
Figure 5: Illicit financial outflows from developing countries (2005-2014) (billions of dollars)
Licensed under Creative Common Page 272 These important amounts of illicit financial outflows from Africa (and all over the world)
challenge the factors that amplify this phenomenon. Indeed, understanding these factors is a
crucial to reduce this scourge and thus allow countries to take advantages of their resources
which should be channelled to productive investment, social assistance to the most
disadvantaged social classes and to strengthening infrastructure and access to basic services,
particularly health and education.
DETERMINANTS OF ILLICIT FINANCIAL OUTFLOWS FROM AFRICA
The empirical literature enumerates a number of determinants encouraging illicit financial flights.
The worsening of macroeconomic environment appears to be the most important one. The
empirical literature has focused its attention on four important macroeconomic indicators:
indebtedness, high inflation, low growth rate and the public deficits.
External indebtedness appears to be a major factor as long as high over-indebtedness can lead to a deteriorating of country’s solvency and increases the probability of a debt crisis. In
a cross-sectional study, Collier, Hoeffler and Pattillo (2001) found a positive and statistically
significant impact of the stock of debt on capital flight.
A high level of inflation makes assets denominated in national currency less attractive
than those denominated in foreign currencies, pushing economic agents to acquire foreign
assets in legal or illegal ways. Empirical studies also argue that low rates of growth encourages
illicit capital flight. For example, Pastor (1990) finds that the growth rate differential between the
United States and the Latin American countries is an important determinant of illicit financial
flight in this region. Also, Nyoni (2000) concluded that capital flight from Tanzania is positively
correlated with the growth rate differential between Tanzania and the United Kingdom.
Concerning fiscal policy, empirical studies have shown that worsening of public finances
is positively correlated with illicit financial flight. Indeed, high anticipated taxes, as a
consequence of high fiscal deficits, imply lower expected net returns for domestic investment
and thus encourage economic agents to transfer their funds using legal or illegal methods. Also,
the volatility of the tax rate entails a higher risk and a lack of visibility for economic operators
and consequently fosters illicit flight. Finally, discriminatory tax treatment for foreign assets
(often used to attract foreign capital) may also discourage domestic investment (Boyce and
Ndikumana 2003). Hermes and Lensink (2000) find a positive link between capital flight and the
uncertainty of the government's fiscal policy. The interest rate differential is also considered an
important determinant of capital flight. For example, Dooley (1988) finds that financial
repression, characterized by artificially low interest rates on domestic deposits, is an important
Licensed under Creative Common Page 273 Finally, governance variables such as corruption and political stability can also have an
important effect on illicit financial flows. Le and Rishi (2006), conducted a study on the
relationship between corruption and illicit flows using a large sample of countries. Their
analyses indicate a significantly positive relationship between corruption and illicit outflows of
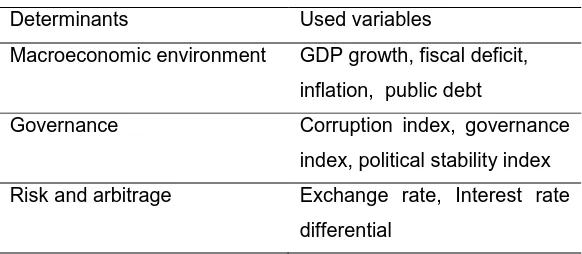
capital from most developing countries. Thus, the main determinants of illicit capital flight can be
summarized in the following table:
Table 1: Theoretical determinants of illicit capital flight
Determinants Used variables
Macroeconomic environment GDP growth, fiscal deficit, inflation, public debt
Governance Corruption index, governance index, political stability index Risk and arbitrage Exchange rate, Interest rate
differential
The empirical analysis is conducted using a panel data model. The data used covers the period
2005-2014 and concerns 48 African countries. Countries that have not been considered are
those that do not have data on the analysis period. The explanatory variables of illicit financial
outflows (IF) are Political stability (PS), governance index (GOV), Corruption index (CORUP),
Inflation (INF), exchange rate (EX), real growth rate (GDP), public debt (DBT), current account
balance (CAB) and the General government net lending/borrowing (DEF). The sources are the
World Bank database, the world economic outlook (WEO) IMF database, and the Global
Financial integrity (GFI) database.
The equation to be estimated is given by:
𝐼𝐹𝑖𝑡 = 𝑎1𝑃𝑆𝑖𝑡+ 𝑎2𝐼𝑁𝐹𝑖𝑡+ 𝑎3𝐺𝑂𝑉𝑖𝑡+ 𝑎4𝐺𝐷𝑃𝑖𝑡+ 𝑎5𝐸𝑋𝑖𝑡+ 𝑎6𝐷𝐵𝑇𝑖𝑡+ 𝑎7𝐶𝑂𝑅𝑈𝑃𝑖𝑡+ 𝑎8𝐶𝐴𝐵𝑖𝑡
+ 𝑎9𝐷𝐸𝐹𝑖𝑡+ 𝑐𝑖𝑡+ 𝜀𝑖𝑡
The estimation in panel data was conducted using the generalized method of moments (GMM).
Following the Hausman test the model is specified with random effect (Table 3). The estimation
Licensed under Creative Common Page 274 Table 2: Estimations results
Variable Coefficient Std. Error t-Statistic Prob.
POLS -2.539866 0.386157 -6.577288 0.0000
INF 0.052581 0.034561 1.521421 0.1294
GOV -2.635237 0.971913 2.711391 0.0072
GDP -0.020404 0.056295 -0.362458 0.7173
EXR -0.000101 8.54E-05 -1.185027 0.2371
DBT 0.014142 0.006423 2.201871 0.0286
CORUP -0.297312 0.885306 -0.335830 0.7373
CAB 0.064399 0.024337 2.646159 0.0087
BUD -0.027036 0.023639 -1.143670 0.2539
C 1.752742 0.583083 3.005988 0.0029
R-squared 0.241396 Mean dependent var 2.014040 Adjusted R-squared 0.214087 S.D. dependent var 4.295327 S.E. of regression 3.807883 Sum squared resid 3624.992
Table 3: Hausman test
Test Summary Chi-Sq. Statistic Chi-Sq. d.f. Prob. Cross-section random 8.564892 9 0.4784
Thus, the most important variables influencing illicit outflows in Africa are political stability,
governance and to a lesser extent public debt and the balance of payments deficit. Indeed, the
lack of political stability and the weakness of governance create an environment of uncertainty
that pushes economic actors to transfer their funds legally or illegally to safer countries. Also,
the increase in public debt and the widening of the balance of payments deficit encourage the
flight of capital as long as they deteriorate the macroeconomic environment.
CONCLUSION AND RECOMMENDATIONS
The objective of this paper was to analyse the evolution of illicit financial flows in Africa during
the last decade and identify, through a panel data analysis, their main determinants.
Over the period 2005-2014, the African continent experienced a massive illicit capital
outflow of about 610 billion of dollars. The top 5 countries, namely Nigeria, South Africa, Algeria,
Egypt and Morocco have experienced more than 419 billion dollars of illicit outflows, more than
Licensed under Creative Common Page 275 The empirical analysis shows that the most important variables encouraging illicit financial flows
are political instability, bad governance, public indebtedness and the balance of payments
deficit. These factors create an environment of uncertainty and deteriorate macroeconomic
situation that pushes economic actors to transfer their funds legally or illegally to safer countries.
Illicit financial outflows deprive the economy of important financial resources that can be used
for socioeconomic development projects. Therefore a number of measures can be considered in
order to reduce the magnitude of this phenomena. Following the GFI report (2017), several
measures can be adopted to reduce illicit flows:
− Governments should verify beneficial ownership information on all legal entities, and all banks
should know the true beneficial of any account in their financial institutions.
− Multinational companies must publish their revenues, profits, losses, sales, taxes paid,
subsidiaries, and staff levels on a country-by-country basis;
− All countries around the world should actively participate in the movement towards the
automatic exchange of tax information;
− Trade transactions involving a tax haven should be treated with the highest level of scrutiny; − Finally, governments should significantly boost their customs enforcement by equipping and
training officers to better detect intentional misinvoicing of trade transactions.
This study constitutes a starting point for more detailed analysis of illicit financial flows.
In fact, it would be interesting to conduct microeconomic and sectorial studies to identify the
sectors and activities that are responsible for massive capital outflows in each of the African
countries.
REFERENCES
Bhagwati, N. (1974) “On the Underinvoicing of Imports,” in Illegal Transactions in International Trade, ed. (Amsterdam: North-Holland Publishing Company, 138–47.
Collier, P and all. (2001). Flight capital as a portfolio choice, IMF working paper. 99/171.
Dooley, M. P. (1988). Capital fight: A response to differences in financial risks. IMF Staff Papers. Washington. 35(3) 422-436.3.
Global financial Integrity report (2008). Illicit Financial Flows from Developing Countries: 2002-2006.
Global financial Integrity report (2017). Illicit Financial Flows to and from Developing Countries: 2005-2014
Kapoor, S. (2007). Haemorrhaging Money: A Christian Aid Briefing on the Problem Illicit Capital Flight. Christian Aid.
Lahlou K. & Mossadak A. (2013) Empirical investigation on the illicit financial flows from MENA region, British Journal of Social Sciences. Vol. 1, No. 9, pp 1-11.
Le, Q. & Rishi, M., (2006). Corruption and Capital Flight: An Empirical Assessment, International Economic Journal, Vol. 20, No. 4, pp. 523-540, December.
Lensink, R., & all (2000). The effect of financial liberalization on capital flight in African economies. World Development, 26(7), 1349-1368.
Licensed under Creative Common Page 276 Nyoni, T. (2000) Capital flight from Tanzania. In S. I. Ajayi & S. K. Mohsin (Ed.), External debt and capital flight in Sub Saharan Africa, International Monetary Fund.