86
What Affects K Value Selection In K-Nearest
Neighbor
Iman Paryudi
Abstract: k-Nearest neighbor is a popular classifier and has been applied in many fields. One problem with this classifier is the choice of k value. Different k values can have a large impact on the predictive accuracy of the algorithm, and picking a good value is generally unintuitive by looking at the data set. Because of the difficulty in selecting the k value, it is suggested to using variable k values instead of just one static k value. The numbers of nearest neighbors (k value) selected for different categories are adaptive to their sample size in the training set. There are many ways of choosing the k value, but a simple one is to run the algorithm many times with different k values and choose the one with the best performance. However, this method will take long time if we want to do experiment with a lot of k values. In relation to this problem, this paper will present the result of our experiment on what data properties affect the choice of k value. There are two interesting results from this experiment. The first is the experiment result showing the relationship between big data sets with more than 8000 instances (Mush, MGT, SS, Adu, and BM) and small best k values in 2-class data sets. And the second is where there is a relationship between data sets having numerical attribute type and small best k values in n-class data sets.
Index Terms: Data Mining, Classification, k-Nearest Neighbor, k value selection, 2-class data sets, n-class data sets
————————————————————
1
Introduction
K-NEAREST NEIGHBOR classifier is a popular classifier that has been applied in many fields, such as in text categorization [2], intrusion detection [3], handwritten digit recognition [4], alternative design exploration in an energy simulation tool [5], etc. k-Nearest Neighbor (k-NN) is a classifier that classify an object based on the majority vote of its neighbors. Since the classification is based on the number of the neighbors (k value), the k value will determine the performance of the classifier. One problem with this classifier is the choice of k value. Different k values can have a large impact on the predictive accuracy of the algorithm, and picking a good value is generally unintuitive by looking at the data set. Cross-validation over multiple folds is often used to find the best value for k in kNN based on prediction results [6]. Because of the difficulty in selecting the k value, several papers [6][7][8][9] suggest to using variable k values instead of just one static k value. The numbers of nearest neighbors (k value) selected for different categories are adaptive to their sample size in the training set [7]. There are many ways of choosing the k value, but a simple one is to run the algorithm many times with different k values and choose the one with the best performance [1]. However, this method will take long time if we want to do experiment with a lot of k values. In relation to this problem, this paper will present the result of our experiment on what data properties affect the choice of k value. The rest of the paper will be presented as follows: Section 2 will describe the k-NN classifier. Section 3 presents the previous researches on k value in k-NN. Sections 4 and 5 discuss the data sets used and the experiment that is carried out, respectively. The result of the experiment and the discussion is presented in Section 6. And section 7 concludes the paper.
2
K-N
EARESTN
EIGHBORC
LASSIFIERMost kNN classifiers use simple Euclidean metric to measure the dissimilarities between examples represented as vector inputs [10]. Euclidean distance is defined as:
d(x x) = √∑ w (a (x) − a(x)) (1)
where the vector x = (a1, a2, a3, . . . , an), n is the
dimensionality of the vector input or the number of an
example’s attributes. ar is the example’s r th
attribute, wr is the
weight of the rth attribute, r is from 1 to n. The smaller d(xi, xj),
the more similar is the two examples. The class label assigned to a test example is determined by the majority vote of its k nearest neighbors:
y(d) = arg max ∑ y(x c ) (2)
where di is a test example, xj is one of its k nearest neighbors
in the training set, y(xj, ck) indicates that whether xj belongs to
class ck. A test example will be classified to the class having
most members in the k nearest neighbors [8]. However, k-NN has several drawbacks such as:
a. KNN’s accuracy may be dominated by some irrelevant attributes [11].
b. Determination of K parameter or sizes of neighborhood greatly affect K-NN performance [12]. c. K-NN performance is very sensitive to the distance
function [12].
d. The time required to classify an instance is high, since the distance (or similarity) of that instance to all the instances in the training set have to be computed [13].
3
R
ELATEDW
ORKS87 Guyon and Elisseeff [12] stated that if value of k is too small
then insufficient number of neighbors will be for class assignment of test instance. On the other hand, if the value of k is too large, then there will be a lot of irrelevant neighbors. It is very likely that a fixed k value would result in a bias on large classes, and will not make full use of the information in the training set. To deal with these problems, an improved kNN strategy is used. In this strategy, different numbers of nearest neighbors for different categories are used instead of a fixed number across all categories. The numbers of nearest neighbors selected for different categories are adaptive to their sample size in the training set [7]. Because of that it is suggested to use variable k value instead of one static k value
[6, 7, 8, 9].
4
D
ATAS
ETSIn this study, we use data sets from UCI Machine Learning Repository [16]. The data sets are divided into two groups: 2-class data sets and n-2-class data sets. The 2-2-class data sets are data sets having only 2 classes. Meanwhile the n-class data sets are data sets having more than 2 classes. There are 13 2-class data sets and 11 n-class data sets used in this study. The detail information on the data sets can be seen in Table 1 and Table 2.
TABLE 1
2-Class Data Sets
Data set name No. of
Attributes
No. of Categorical
Attributes
No. of Numerical Attributes
No. of
Instances Class Distribution
Adult Adu 14 8 6 15000 76.08% : 23.92%
Australian Credit Approval ACA 14 8 6 690 44.5% : 55.5%
Bank Marketing BM 16 9 7 14999 95.89% : 4.11%
Breast Cancer Wisconsin BCW 10 0 10 699 65.5% : 34.5%
Congressional Voting Records CVR 16 16 0 435 45.2% : 54.8%
Fertility Fer 9 0 9 100 88% : 12%
German Credit Data GCD 20 13 7 1000 30% : 70%
Hepatitis Domain HD 19 13 6 155 20.65% : 79.35%
Ionosphere Ion 34 0 34 351 35.90% : 64.10%
Magic Gamma Telescope MGT 10 0 10 19020 64.84% : 35.16%
Mammographic Mass MM 5 4 1 961 53.69% : 46.31%
Mushroom Mush 22 22 0 8124 51.80% : 48.20%
Skin Segmentation SS 3 0 3 50001 50% : 50%
TABLE 2
n-Class Data Sets
Data set name No. of
Attributes
Categorical Attributes
Numerical Attributes
No. of Instances
No. of Classes
Balance Scale BS 4 4 0 625 3
Car Evaluation CE 6 6 0 1728 4
Cardiotochography Car 23 0 23 2126 10
Contraceptive Method Choice CMC 9 7 2 1473 3
Glass Identification GI 9 0 9 214 7
Iris Iri 4 0 4 150 3
Letter Recognition LR 16 0 16 15000 26
Nursery Nur 8 8 0 12960 5
Teaching Attribute Evaluation TAE 5 4 1 151 3
Wine Win 13 0 13 178 3
White Wine Quality WWQ 11 0 11 1599 11
5
E
XPERIMENTThe experiment is carried out by classifying the data sets using 8 different k values: 1, 3, 5, 11, 21, 31, 41, 51. The experiment is done using Weka data mining tool. Except the k-value, we use the default values of Weka. And we use 10-cross validation to test the data sets. The test is done for both 2-class and n-class data sets. From the experiment, the best
k value for each data set is obtained. After that, all the best k values are compared to number of instance, attribute type, and class distribution.
6
R
ESULTS ANDD
ISCUSSION88 having the best performance. If the best performance occurs
in more than on k values, then the smallest k value is selected as the best k value. The last columns of Tables 3 and 4 show
the best k value selected. Note that we use percentage of correctly classified instances as the parameter of the performance.
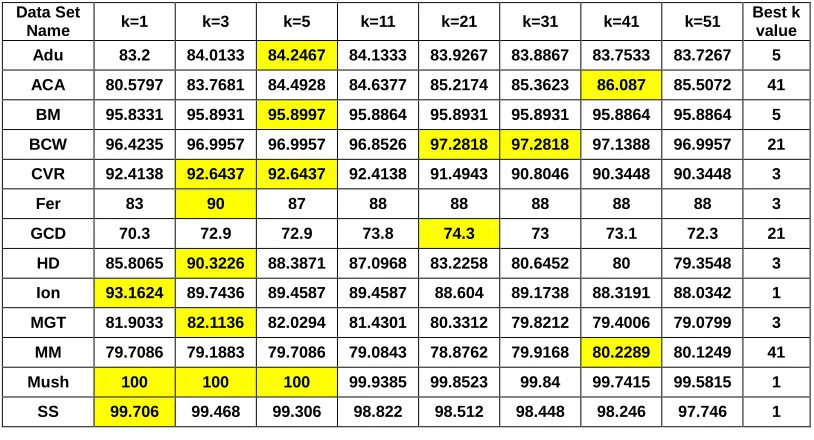
TABLE 3
Experiment results of 2-class data sets showing correctly classified instances values for each k value and each data set
Data Set
Name k=1 k=3 k=5 k=11 k=21 k=31 k=41 k=51
Best k value Adu 83.2 84.0133 84.2467 84.1333 83.9267 83.8867 83.7533 83.7267 5
ACA 80.5797 83.7681 84.4928 84.6377 85.2174 85.3623 86.087 85.5072 41
BM 95.8331 95.8931 95.8997 95.8864 95.8931 95.8931 95.8864 95.8864 5
BCW 96.4235 96.9957 96.9957 96.8526 97.2818 97.2818 97.1388 96.9957 21
CVR 92.4138 92.6437 92.6437 92.4138 91.4943 90.8046 90.3448 90.3448 3
Fer 83 90 87 88 88 88 88 88 3
GCD 70.3 72.9 72.9 73.8 74.3 73 73.1 72.3 21
HD 85.8065 90.3226 88.3871 87.0968 83.2258 80.6452 80 79.3548 3
Ion 93.1624 89.7436 89.4587 89.4587 88.604 89.1738 88.3191 88.0342 1
MGT 81.9033 82.1136 82.0294 81.4301 80.3312 79.8212 79.4006 79.0799 3
MM 79.7086 79.1883 79.7086 79.0843 78.8762 79.9168 80.2289 80.1249 41
Mush 100 100 100 99.9385 99.8523 99.84 99.7415 99.5815 1
SS 99.706 99.468 99.306 98.822 98.512 98.448 98.246 97.746 1
TABLE 4
Experiment result of n-class data sets showing correctly classified instances values for each k value and each data set
Data Set
Name k=1 k=3 k=5 k=11 k=21 k=31 k=41 k=51
Best k value BS 84.8 84.8 86.56 90.08 90.08 89.28 89.44 89.6 11
CE 93.5185 93.5185 93.5185 93.287 76.794 76.794 76.794 76.794 1
Car 78.5983 76.4817 76.3876 73.3772 72.2013 70.8843 70.1317 69.5673 1
CMC 51.799 51.3238 52.0027 53.632 54.1752 54.9219 54.7862 55.1935 51
GI 78.972 78.0374 74.7664 68.2243 66.3551 65.8879 64.0187 62.6168 1
Iri 94 94.6667 94.6667 94.6667 94.6667 94.6667 94.6667 94.6667 3
LR 90.4867 89.36 88.6267 86.2 83.7333 81.0333 78.9667 77.4067 1
Nur 98.0633 98.0633 98.0633 98.0633 95.9954 95.9954 95.9954 95.9954 1
TAE 54.3046 52.3179 53.6424 56.9536 52.9801 52.3179 49.6689 43.7086 11
Win 98.3146 97.191 96.0674 91.573 89.8876 89.3258 87.6404 86.5169 1
WWQ 58.187 54.3691 54.3283 53.4708 53.0625 52.9604 52.8379 52.8379 1
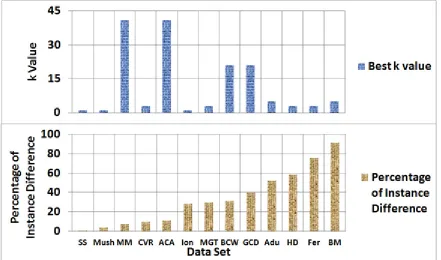
The best k value data of 2-class data sets is then compared to number of instance, attribute type, and class distribution (Figures 1 – 3). Meanwhile, the best k value data of n-class data sets is compared to number of instance and attribute type (Figures 4 – 5). Figure 1 shows three groups of relationship between k value and number of instances on 2-class data sets. In the first group, data sets having more than 8000 instances have maximum k values of 5. This happens in data sets Mush, BM, Adu, MGT, and SS. In the second group, data sets containing instances between 600 and 1000 have k values bigger than or equal to 21. This happens in data sets ACA, BCW, MM, and GCD. Meanwhile in the third group, data sets with less than 500 instances have k values less than or equal to 3. This happens in data sets Fer, HD, Ion, and CVR. Since the best performance of CVR occurs when k values are 3 and 5 (see table 3), we can also say that the best k values
89 attribute is all attributes whose initial values are continuous.
There are two interesting results from this experiment. The first is the experiment result showing the relationship between big data sets with more than 8000 instances (Mush, MGT, SS, Adu, and BM) and small best k values in 2-class data sets (Figure 1). This is surprising because Fukunaga in [17] stated that the optimal k value which brings to the best performance is approximately close to N1/2. Meanwhile, other studies show that a stable or optimal performance of kNN typically occurs when using a relatively large value of k (between 30 and 200, for example) [7]. However, there is no similar relationship in the case of n-class data sets (Figure 4). Here, data sets having small best k values contain number of instances ranging from 150 up to 15,000. The second interesting finding
is where there is a relationship between data sets having numerical attribute type and small best k values in n-class data sets (Figure 5) but there is no such relationship in the case of 2-class data sets (Figure 2). In these 2-class data sets, not only data sets containing numerical attributes that have small best k values but also the ones with categorical attributes. Kardan, Kavian, and Esmaeili [18] reported that unbalanced binary class problems have shown that the relationship between neighbors size and classification error rate is not uniform. It means that larger value of k may have not better result in comparison to smaller values of k. This statement is proven by experiment result shown in Figure 3. It shows that the most unbalanced binary class (BM data set) have very small k value, i.e. 5.
Fig. 1. Relationship between k value and number of instances on 2-class data sets.
90 Fig. 3. Realtionship between k value and class distribution on 2-class data sets.
91 Fig. 5. Realtionship between k value and attribute type on n-class data sets.
From the experiment we learn that:
1. small k value does not always suit for small data sets. And also big k value does not always suit for big data set. 2. for n-class data sets having numerical attribute, it is better
to have small k value.
3. it is better to use small k value for very unbalanced binary class.
7
C
ONCLUSIONThere are two interesting results from this experiment. The first is the experiment result showing the relationship between big data sets with more than 8000 instances (Mush, MGT, SS, Adu, and BM) and small best k values in 2-class data sets. And the second is where there is a relationship between data sets having numerical attribute type and small best k values in n-class data sets but there is no such relationship in the case of 2-class data sets. In these 2-class data sets, not only data sets containing numerical attributes that have small best k values but also the ones with categorical attributes. From the experiment we learn that:
1. small k value does not always suit for small data sets. And also big k value does not always suit for big data set. 2. for n-class data sets having numerical attribute, it is better
to have small k value.
3. it is better to use small k value for very unbalanced binary class.
We need to carry out further experiment using more data sets to make sure that this phenomenon actually happens or just arbitrarily happens. We understand that the same data with different treatment will produce different results. Since data in this experiment are not preprocessed, data preprocessing must be carried out before the future experiment. The data preprocessing should include:
a. Scaling
b. Binning if necessary c. Inter-attribute dependencies d. Outlier detection and removal e. Null data removal
R
EFERENCES[1] Guo, G., Wang, H., Bell, D., Bi, Y., and Greer, K., ―KNN Model-Based Approach in Classification,‖ Proceedings OTM Confederated International Conferences CoopIS, DOA, and ODBASE, Italy, 2003.
[2] Han, E-H., Karypis, G., and Kumar, V., ―Text Categorization Using Weight Adjusted k-Nearest Neighbor Classification,‖
https://pdfs.semanticscholar.org/b3ca/32cafe5343a76025
49ae5e51fc2660633cbf.pdf.
[3] Liao, Y. and Vemuri, V.R., ―Use of K-Nearest Neighbor Classifier for Intrusion Detection,‖ Computer & Security, Vol. 21(5): 439-448, 2002.
[4] Lee, Y., ―Handwritten Digit Recognition Using K-Nearest Neighbor, Radial-Basis Function, and Backpropagation Neural Networks,‖ Neural Computation, Vol. 3(3): 440-440, 1991.
[5] Paryudi, I., ―Alternative Design Exploration using K-Nearest Neighbor Technique and Semantic Web Technology in an Energy Simulation Tool,‖ International Journal of Advances in Computer Science and Technology, Vol. 2, No, 10, 2013.
[6] Hulett, C., Hall, A., and Qu, G., ―Dynamic Selection of k Nearest Neighbors in Instance-based Learning,‖ IEEE IRI, 2012.
[7] Baoli, L., Qin, L., and Shiwen, Y., ―An Adaptive k-Nearest Neighbor Text Categorization Strategy,‖ ACM Transaction on Asian Language Information Processing, Vol. 3, No. 4, 2004, 215-226.
[8] Sun, S. and Huang, R., ―An Adaptive k-Nearest Neighbor Algorithm,‖ 2010 Seventh International Conference on Fuzzy System and Knowledge Discovery, 2010.
[9] Jivani, A.G., ―The Novel k Nearest Neighbor Algorithm,‖ 2013 International Conference on Computer Communication and Informatics, India, 2013.
92 [11]Jiang, L., Zhang, H., and Cai, Z., ―Dynamic
K-Nearest-Neighbor Naïve Bayes with Attribut Weighted,‖ FSKD 2006, LNAI 4223, pp. 365-368, 2006.
[12]I. Guyon, and A. Elisseeff, "An introduction to variable and feature selection," Journal of Machine Learning Research, vol. 3, pp. 1157-1182, 2003.
[13]Güvenir, H. A. and Akkus, A., ―Weighted K Nearest Neighbor Classification Feature Projections,‖
https://www.semanticscholar.org/paper/Weighted-K- Nearest-Neighbor-Classification-on-G%C3%BCvenir-Akku%C5%9F/78277df1b9f6e6b6e50fd4fb0d519be5a9bd 2180.
[14]Batista, G. and Silva, D.F., ―How k-Nearest Neighbor Parameters Affect its Performance,‖ 38o
JAII0 – Simposio Argentino de Inteligencia Artificial (ASAI 2009), pp. 95-106, 2009.
[15]Islam, M. J., Wu, Q. M., Ahmadi, Majid, and Sid-Ahmed, M. A., ―Investigating the Performance of Naïve Bayes Classifiers and K-Nearest Neighbor Classifiers,‖ Journal of Convergence Information Technology, Vol. 5, No. 2, 2010.
[16]UCI Machine Learning Repository,
http://archive.ics.uci.edu/ml/datasets.html.
[17]Amendolia, S. R., Cossu, G., Ganadu, M. L., Golosio, B., Masala, G. L., and Mura, G. M., ―A Comparative Study of K-Nearest Neighbor, Support Vector Machine and Multi-Layer Perceptron for Thalasemia Screening,‖ Chemometrics and Intelligent Laboratory System 69, 2003, 13-20.
[18]Kardan, A. A., Kavian, A., and Esmaeili, A., ―Simultaneous Feature Selection and Feature Weighting with K Selection for KNN Classification using BBO Algorithm,‖ 2013 5th