Licensed under Creative Common Page 1487
http://ijecm.co.uk/
ISSN 2348 0386
THE DECISION OPTIMIZATION OF PRODUCT
DEVELOPMENT BY CONSIDERING THE
CUSTOMER DEMAND SATURATION
XING Qing-song
School of Management, Chongqing Jiao tong University, Chongqing, China [email protected]
PAN Cheng
School of Management, Chongqing Jiao tong University, Chongqing, China [email protected]
Abstract
On the basis of satisfying basic customer demands in the process of product development,
strengthening meet the personalized customer demands which has high attention can improve
the market adaptability and competitiveness of products. First of all, investigate to obtain the
customer demand information, and then quantify customer demands weights by using variation
coefficient method. Secondly, analyses the relationship between customer demands and
product development time and cost based on the quality function deployment and establish
corresponding mathematical model. On this basis, put forward the concept of customer demand
saturation and optimization decision method of product development, and then apply it in the
notebook development process of a company. Finally, when customer demand is saturated, it
also needs to prove the consistency of strengthening satisfies customer demands and high
attention degree customer demands, and the stability of customer demand saturation under
different parameters. Prove the correctness and effectiveness of concept of customer demand
saturation and the decision method in the end.
Keywords: Customer demand, Development cost, Development time, Demand saturation,
Licensed under Creative Common Page 1488
INTRODUCTION
In recent years, with the increasingly fierce market competition, enterprises pay more attention to the needs of customers in the product development process, and look forward to enhancing market flexibility and product competitiveness by strengthening meet the customers’ individual demands, which have high attention.
Licensed under Creative Common Page 1489
improve the accuracy of demand forecasts, which solved the problem of highly unstable about intermittent customer demands; Tan (2013) designed a questionnaire for electric features to capture customer demands, through fuzzy logic processing, he got the explicit ones; some people assumed that fully meet customer demands in order to improve customer satisfaction, they redefined the rough numbers to effectively analyze customer needs and fully express customers’ perceptions (ZHAO, ZHANG & Zhen, 2011); ZHU and YANG (2012) revised the customers demand important by the concept of DEMATEL and entropy, with a view to display diverse customer demands objective and reasonable in the research and development; people like Ertian, Huanhuan and Daqiang (2013) proposed a customer segmentation method based on fuzzy clustering and trigonometric functions, through the trigonometric function model design, this method can realize the conversion of customer demands for design knowledge; DAN and YAO (2010) presented a product configuration method based on ontology mapping method for the product development process of fuzzy customer requirements to product configuration issues, and finally realized the multiple match between customer demand characteristics parameters and the instances characteristic parameters; On inventory management, Dutta and Chakraborty (2010) described the uncertainty in customer demand using knowledge and information, they presented a policy to address the single-period product inventory problem under uncertainty of customer demands, which called “two projects one-way alternatives”; From the perspective of cloud computing, with analyzing cloud computing platform architecture and characteristics of mass customization in customer service, GUO and WU (2011) proposed customer demand-response model of mass customization based on cloud computing, which solved problems effectively of addressing customer demand information in the mass customization.
In response to the analysis of the domestic and foreign research results, it can be find that there have been given a lot of in-depth studies on diversification and individuality customer demands in the course of product development and many customer demand mining methods have been proposed. However, in the process of actual development, excessive attention and consideration of customer demands will lead to development costs and development cycle increasing, which reduces the efficiency of product development and economic benefits of enterprises. In this regard, the related research is still lacking, especially for the dynamic quantitative analysis between the degree of customer demand satisfaction and the product development cost and time.
Licensed under Creative Common Page 1490
analyze the relationship between customer demands and product development time and cost, and establish the mathematical model; On this basis, construct conception of customer demand saturation, and put forward the optimal decision methods based on genetic algorithm under considering customer demand saturation; Finally, present satisfactory scheme to meet customer demand under the ideal product development time and cost. This paper will provide the decision for the enterprise to weigh the customer demand, product development time and cost in product development.
CONCEPT CONSTRUCTION ON CUSTOMER DEMAND SATURATION
Determine the weight of customer demands
In order to determine the differences between each customer demands and overall one, it is necessary to get weight analysis of the customer demands, to show the customer demand for the meeting space. When determine the weight of demand, the common methods which include methods of subjective (AHP and Delphi) and objective (fuzzy clustering, rough set and entropy), the subjective weighting methods have certain subjectivities, which influences decision accuracy and reliability (Tadic, Gumus & Arsovski, 2013; TIAN, ZHANG & WANG, 2004). Fuzzy clustering and rough set methods use the raw data to calculate weight, while avoiding the subjective, but weakness in calculating weights, namely in handling information. Although there is no systematic information on the loss, but unable to determine system weight of each property, and typically, the use of fuzzy distribution of weights usually need to provide a priori standard; Rough set method does not need to provide prior information, and also provides a tool to determine weight, but it uses range partitioning method for data processing, with neglecting more system information (HUANG, WU & ZONG, 2004; CHEN and XU, 2013).
However, the variation coefficient method based on objective statistical data can analyze the differences in response to customer demands (CHEN, 2012), with calculating the standard deviation, it can show the differences in customer demands. The average performance normal expectation of customer demands. Due to the size of coefficient is the ratio of the two above, and it reflects the general instance of customer demands in the market. Therefore, the method can be effective in highlighting the differences in demands, diversity and the importance of customer needs yet to be met, so it is reasonable to use variation coefficient method to determine the weight of customer demands in the product development process. The following is the specific calculation steps.
Licensed under Creative Common Page 1491
deviation of each customer demand, and according to the obtained data derived before, the variant variables (V i(i 1 2 3 ,,, , ) n ) of each customer demand is calculated as follows:
i i iV
(1)
Step2. Calculate the weight of each customer demand. Use the variation coefficient method to
get the sum ( 1 n i i V
) of the coefficient of variation of customer demand. And based on the variation coefficient method formula, calculate weights of each customer demand (
i
cd Customer Demands( )), weighting formula is as follows:
1
i i n i i V V cd(2)
According to two steps above the demands of weight matrix is as follows:
1 2 3
T
i n
CD Customer Demands( )( , cd cd,cd, , , , cd cd)
Step3. Define customer demands meet program. According to customer needs weight matrix which is obtained, we define a demands active matrix, which is the customer demands meeting program (
). The matrix can represent the satisfied situation of demands, so that can show each customer demand realized or not:1 2 3, , ,
T i n ( , , , ) i 1 = 0 demand i can be realized demand i cannot be realized
Note, if each
i was 0, it meant there is no demand. It doesn't make sense and this program should be removed.Relationship between customer demands and product development time & costs
Because that Quality function deployment (QFD) can turn customer demands, technical characteristics and correlation of each part into graphic showing, its intuitive and simple characteristics can help demonstrate decision problems (Vinodh and Kumar, 2011; Wu, Pan & Shao, 2013). As shown in Figure 1, the QFD matrix is defined like this: in the matrix, CD indicates the type of customer demands, cdi indicates the weight to all customer demands for each one. Based on these customer demands, define R for the technical properties of design
Licensed under Creative Common Page 1492
characteristic, define Q for correlation degree of technical characteristics, and define S for the relationship degree between customer demand i and technical characteristic j (Hariri, 2013).
The Parameters
t
s and Cs represent the time and cost of the program
s.Figure1. Relationship between customer demands and product development time and costs
C Dcdi
R/rj
CD
Q
S ts Cs
For every customer demand requires at least one technical, so assume technical characteristics number was
m
, the technical characteristicsR( , , , , , , )r1 r2 r3 rj rm . Relating to the type of the technical characteristics, the technical characteristics of each weight should also be considered, therefore, it is necessary to define the technical characteristics weight matrix as1 2 3 j m
( , , , ,
, , )
. In addition, there is a correlation constraint in technical characteristics, known as "technical characteristics of the autocorrelation matrix" (Geng, 2013; Zhai, 2000). We define it asQij. According to the definition of technical characteristics, the relationship should exist between customer demands and technical characteristics, so, based on the QFD analysis of Miguel (2005) and Vinodh (2011), represent the correlation matrix as
S
.11 12 1 1
21 22 2 2
ij
1 2
1 2
i j
i j
i i ii ij
j j ji jj
q
q
q
q
q
q
q
q
Q
q
q
q
q
q
q
q
q
(3)
11 12 1 1
21 22 2 2
ij
1 2
1 2
j m
j m
i i ij im
n n nj nm
S S S S
S S S S
S
S S S S
S S S S
Licensed under Creative Common Page 1493
According to the definitions above, for customer demands meeting programs
s, each customerdemand is satisfied by costs and technical characteristics, it shows a positive correlation between development cost and technical characteristics, and also the technical characteristics weight and demands. Therefore, set technical characteristics weight matrix as cost elements for customer demands, and set the relationship of demands (
i) and technical characteristics as development costs expenditure levels, then, build a development cost model for customer demand meeting program
s.s
1 1
n m T i j ij i j
C
S
(5)
In addition, for a demand meeting program
s, due to the demands associate with the technicalcharacteristics, the development time relate to the relationship intensity in technical characteristics. In other words, there is a positive correlation between development time and technical characteristics autocorrelation level, since the between the degrees. So, set the technical characteristics autocorrelation level as development time expenditure levels, and the development time of customer demand meeting program are as follows:
s
1 1
n m
T i j ij i j
t
Q S
(6)
Note,
Q
jmeans sum of Qin line or column,S
ijdenotes a matrix that each element which is not 0 is replaced by 1, it represents the distribution of required technical characteristics onprogram
s.Customer demand saturation
Licensed under Creative Common Page 1494
Figure 2. Three elements and their relationship
.
benefits
costs
benefits
speed
costs
time
(
a
)
(
b
)
(
c
)
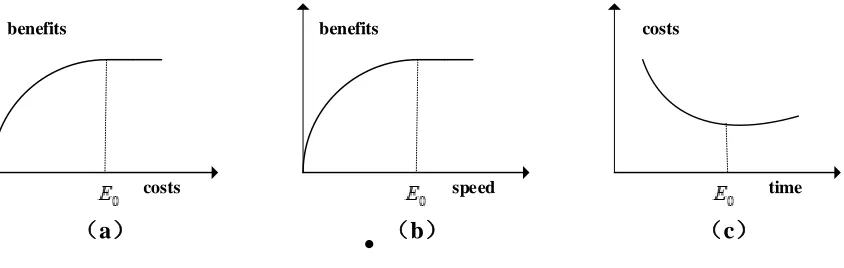
As shown in Figure 2 (a), with the increase of investment, benefits and costs are positively correlated, due to the limited social technologies over a period time, when reached E0 point,
benefits increase slowed. It also happened in development speed and the benefits, which is showed in figure 2 (b). In figure 2(c), it can be find, in a certain range, development costs decreased with time increasing, and it just goes to show impact on proficiency in the job product development. In pointE0, minimal development cost got. Meanwhile, elements of customer
demand meeting program are similar to the above. According to HOU and Ievtushenko’s study, we obtain graphs as follows for factors of customer demand satisfaction, development time and costs (HOU, 1998; Ievtushenko and Hodge, 2012).
Figure 3. Relationship in customer demand satisfaction, development time and costs
customer demand satisfaction costs
(
a
)
time
(
b
)
customer demand satisfaction
As shown in Figure 3 (a), before reaching the point
E
0'
, with the increase of customer demandsatisfaction, development costs rose slowly, when over point
E
0'
, costs are rising rapidly. AsLicensed under Creative Common Page 1495
time is rising rapidly. That is, to meet customer demands, it will lead to development costs and time rising. Therefore, it is necessary to find a balance between the three elements.
Based on the preceding analysis, we got the product development costs (
s
1 1
n m T i j ij i j
C
S
)
and development time (
s
1 1
n m
T i j ij i j
t
Q S
), through value engineering theory, make total
value of the program
s as sum of demands weights. The defined customer demand satisfaction is as
:1 1
n m
T i j ij
i j T S CD
(7)
In considering product development on the basis of cost, time, and customer satisfaction, define
customer demand saturation as
CDS
(Customer Demand Saturation). And in the program
s, the saturation iscds
s.T s s s
CD
cds
t
C
(8)After that, linking formula(5,(6,(8:
1 1 1 1
T
s n m n m
T T
i j ij i j ij
i j i j
CD cds
Q S S
(9)
DECISION OPTIMIZATION UNDER CONSIDERING CUSTOMER DEMAND SATURATION
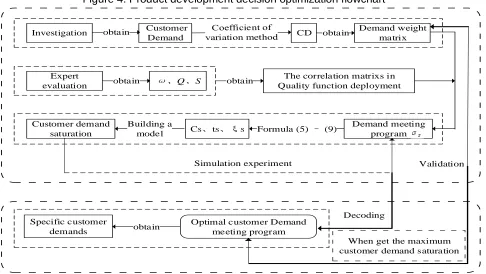
As shown in figure 4, decision optimization is as follow:
Step1. Capture customer demand weights. Have a research on product demands, capture
relevant data of customer demands, and then, evaluate the demands of weight (
cd
i) and weight matrix (CD
) by using variation coefficient method.Licensed under Creative Common Page 1496
Step3. Calculate customer demand saturation. According to the steps above, the customer
demands of weight (
cd
i), technical characteristics autocorrelation matrixQ, matrixS
andS
ij can be obtained. With using formula (5) - (9), we can get the customer demand saturation of demand meeting program
.Step4. Simulation, propose product development program. First, based on the genetic algorithm, generate initial population of demand meeting program
, through operations such as selection, copy, crossover, and mutation, Calculate the minimum value of
and maximum value ofCDS
in every generation; then, for the best individual in each generation, calculate the valuet
s and Cs by using quality function deployment; finally, in the simulation process, when thevariation of the value (
、CDS
、t
s&Cs) is mild, extract the ultimate best individual anddecoded to customer demands on program
.Step5. Analysis the demands development time and costs on the obtained programs. After simulation, calculate development costs and the time for the getting satisfied demand meeting programs. In addition, compare the demands with demand table by weights, so as to testing the sequential consistency. Meanwhile, in order to determine validity and correctness of the model, change the set parameters of genetic algorithms and simulated again to test model stability.
Figure 4. Product development decision optimization flowchart
obtain
Investigation Customer
Demand
obtain CD Demand weight
matrix
Expert
evaluation ω、Q、S
The correlation matrixs in Quality function deployment
Formula (5) – (9)
Simulation experiment Building a
model Customer demand
saturation
When get the maximum customer demand saturation Specific customer
demands obtain
Optimal customer Demand meeting program
Validation
obtain obtain
Demand meeting
program
Decoding
Licensed under Creative Common Page 1497
APPLICATION CASE
In Chongqing Yonghui science and Technology Park, the H Company engages in developing notebook products. In order to ensure the adaptability of the product, Pacific Computers Website and BBS of ZOL digital online are commissioned to initiate discussion of the demand characteristics for new PCs.
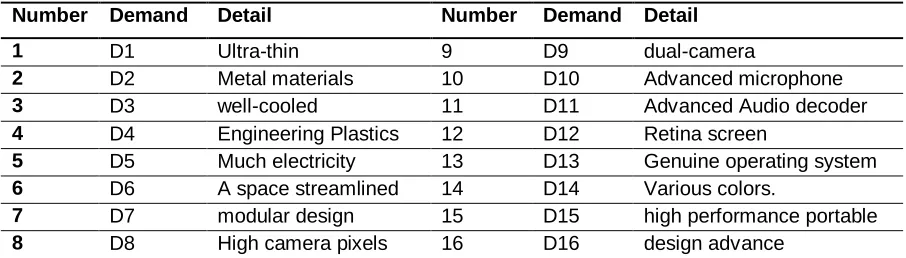
According to forum feedback, merge customer demands based on the principle of similar demands, extreme demand excluding, the result is shown below:
Table 1. Customers demand characteristics
Number Demand Detail Number Demand Detail
1 D1 Ultra-thin 9 D9 dual-camera
2 D2 Metal materials 10 D10 Advanced microphone
3 D3 well-cooled 11 D11 Advanced Audio decoder
4 D4 Engineering Plastics 12 D12 Retina screen
5 D5 Much electricity 13 D13 Genuine operating system
6 D6 A space streamlined 14 D14 Various colors.
7 D7 modular design 15 D15 high performance portable
8 D8 High camera pixels 16 D16 design advance
According to the data in Chongqing municipal industrial and commercial Bureau, as of 2012, in the Chongqing region, electronics store number is more than 1100, where dense in Nanan, Yuzhong, Jiangbei. Shapinba and Jiulongpo district. In the 5 boroughs above, there are more than 240 PC shops, 117 large-scale digital cities and more than 10 senior computer shops. For instance, in Cyber city, there are more than 90 Lenovo computer stores, 20 HP computer stores and 10 Acer stores. It registered an average of 6,000 passengers per day.
After Network investigation, H Company grants questionnaires in big PC stores on the above 5 districts of Chongqing City, each district is distributed 200. The quantity of questionnaire amounts is 1000 copies, 873 recalled, and the recovery ratio is 87.3%. In the experiments:
Licensed under Creative Common Page 1498
Table 2. Questionnaire response results
num Nanan district
Yuzhong district
Jiangbei district
Shapinba district
Jiulongpo district
standard deviation
coefficient of variation
Weight
1 123 120 130 145 135 8.913 0.068 0.033
2 71 106 109 127 147 25.203 0.225 0.111
3 139 154 165 140 140 10.327 0.070 0.035
4 128 111 138 110 147 14.607 0.115 0.057
5 133 145 150 134 130 7.710 0.056 0.028
6 125 91 110 107 111 10.852 0.100 0.049
7 100 88 99 104 112 7.788 0.077 0.038
8 148 120 117 155 133 14.975 0.111 0.055
9 170 134 145 142 159 12.853 0.086 0.042
10 168 106 159 106 112 27.426 0.211 0.104
11 172 136 160 64 137 37.504 0.280 0.139
12 170 154 166 94 117 29.721 0.212 0.105
13 156 121 149 132 136 12.416 0.089 0.044
14 170 131 143 164 154 14.094 0.092 0.046
15 159 111 118 117 138 17.716 0.138 0.068
16 154 118 151 137 146 12.952 0.092 0.045
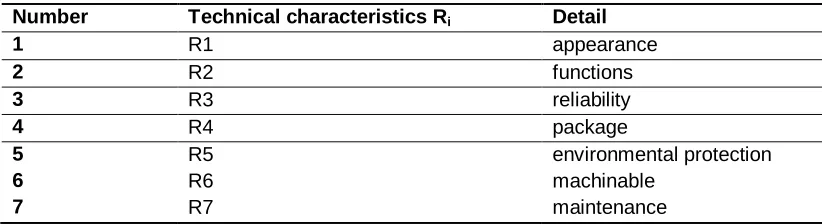
(2) Based on LIU and ZHEN (2011, 2008), via e-mail and interviews, the technical characteristics come to shown in the table 3 by consulting product development engineer.
Table3. Technical characteristics
Number Technical characteristics Ri Detail
1 R1 appearance
2 R2 functions
3 R3 reliability
4 R4 package
5 6 7
R5 R6 R7
environmental protection machinable
maintenance
(3) Through Likert five-level rating scale, obtain scores of technical characteristics, and the results are normalized as follows:
[ 1, 2, 3, 4, 5, 6, 7] [5, 2, 4, 2, 1, 5, 2]R R R R R R R
After normalized
=[0.238 0.095 0.190 0.095 0.048 0.238 0.095]
Licensed under Creative Common Page 1499
Matrix Q and
S
:5 2 2 3 1 4 0 2 5 4 1 1 1 4 2 4 5 0 0 1 4 3 1 0 5 2 0 0 1 1 0 2 5 0 1 4 1 1 0 0 5 0 0 4 4 0 1 0 5 T
Q
5 4 1 2 2 4 1 2 2 0 0 2 0 5 1 5
1 2 3 0 4 0 4 4 4 3 5 5 3 2 0 3
2 3 2 3 3 1 5 3 2 3 5 4 4 0 2 3
2 1 0 0 1 0 0 0 0 0 0 0 0 2 1 2
1 2 0 3 1 0 0 0 0 0 0 0 0 0 1 2
5 4 1 3 0 3 4 3 3 3 4 4 0 2 3 4
1 1 0 1 2 0 5 3 4 3 4 4 4 0 3 2
T
S
(4) Set the population size
N
100
, most evolution generationT 200, the objective function is customer demand saturation, crossover ratep
c
0.80
and mutation ratesp
m
0.01
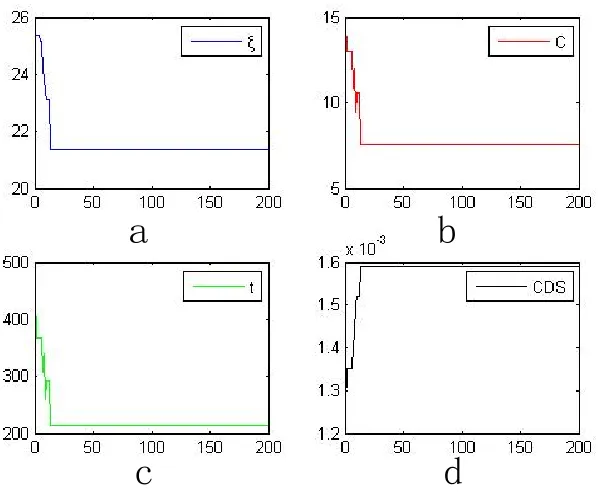
. Then have a simulation on customer demand saturation, development time and cost in MATLAB R2012a. Results were as follows:Figure 5. Parameter simulation results
a
b
Licensed under Creative Common Page 1500
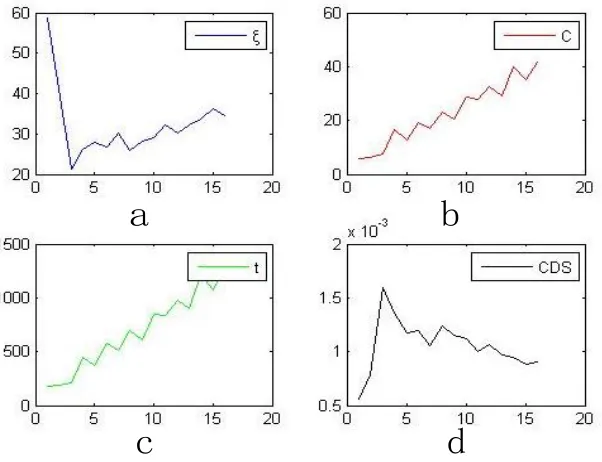
Figure 6. Relationship between quantity and parameters
a
b
c
d
The analyses Figure 5 and Figure 6 show that:
(1) As shown in figure 5 (a, b, c &d) , before saturated, the value (
、CDS
、t
s&Cs) isundulation. With the numerical saturated, curve converged.
(2) As shown in figure 6 (a, b, c &d), the lowest
CDS
appeared while the demand number is 3. When the quantity is less than 3, development cost and time is huge; when the quantity is more than 3, as before. Therefore, it can be concluded that best meeting customer demand number is 3.Increase or decrease the meeting demands, according to the obtained relevant formulas, parameters changing as follows.
Table 4. Variable changing according to demand meeting number
Demand number C
t
CDS1 5.898 173 59.780 0.0006
2 6.423 194 41.012 0.0008
3 7.561 215 21.360 0.0016
4 16.549 447 26.221 0.0014
5 12.602 370 28.042 0.0012
6 19.119 576 26.812 0.0012
Licensed under Creative Common Page 1501
Based the figure 6 and table 4, when the quantity is less than 3, the demand meeting program cannot be reasonably catered for customers. And when the quantity is more than 3, the increased customer satisfaction cannot offset the product development cost and time increasing. After decoding the meeting program when curve converged, the result is as follow:
[ 0 1 0 0 0 0 0 0 0 1 1 0 0 0 0 0 ]
The three customer demands are Metal materials, Advanced Audio decoder and Retina screen. In order to validate the robustness of the model, we change the parameter values of
N
、pcand
p
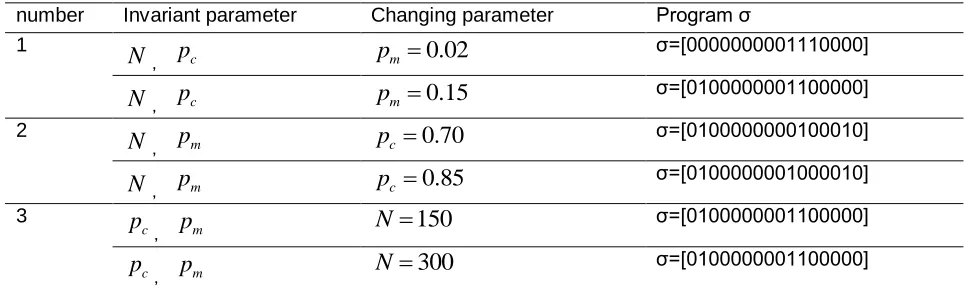
m. After the simulation, decoding the obtained chromosome and the results are as follows.Table 5. Simulation results of change the parameter values
number Invariant parameter Changing parameter Program σ
1
N
,pcp
m
0.02
σ=[0000000001110000]N
,pcp
m
0.15
σ=[0100000001100000]2
N
,p
mp
c
0.70
σ=[0100000000100010]N
,p
m pc 0.85 σ=[0100000001000010]3
c
p ,
p
mN
150
σ=[0100000001100000]c
p ,
p
mN
300
σ=[0100000001100000]As shown above, the demands meeting program is Advanced microphone, Advanced Audio decoder and Retina screen or Metal materials, Advanced microphone and Advanced Audio decoder, while
p
m
0.02
orp
m
0.15
, parameterN
andpcare invariant. The demands meeting program is Metal materials, Advanced Audio decoder and high performance portable or Metal materials, Advanced microphone and high performance portable, whilep
c
0.70
orpc 0.85, parameterN
andp
mare invariant. And the demands meeting program is Metal materials, Advanced microphone and Advanced Audio decoder, whileN
150
orN
300
, parameter pc andp
mare invariant.Licensed under Creative Common Page 1502
CONCLUSIONS
In order to obtain the best demand meeting program with maximize customer satisfaction and considering product development cost and time, based on quality function deployment and genetic annealing algorithm, we get the preferable result. The main contributions are as follows. (1) Put a customer demand weight calculation method based on variation coefficient, so that enterprises can draw attention to the high degree customer demands.
(2) With using quality function deployment model, customer demand saturation is constructed. Quantify development costs, development time and the degree of satisfaction of customer requirements and make the calculation of the balance of the three possible.
(3) Use genetic algorithm to simulate the model, and also discussed the robustness of the model.
The established model can guide the enterprises to fully meet customer demands with concerning about development costs and time rising, it also can assist corporate production decisions. In the simulation process, there are some sequence deviations of demands ranking, but the model still has some constructive significance.
In addition, according to the unsatisfactory simulation results above, we will modified algorithm and make research on customer demands again in the next work, aim to ensure that the simulation data model can be robustness and accuracy.
ACKNOWLEDGEMENT
This research was supported by a Key program of NSFC (Grant No. 7140010496).
REFERENCES
Anshuman Gupta, Costas D. Maranas & Conor M. McDonald. (2000). Mid-term supply chain planning under demand uncertainty: customer demand satisfaction and inventory management. Computers and Chemical Engineering, 24 (12), 2613-2621.
CHEN N & XU X. (2013). INFORMATION-FUSION METHOD FOR URBAN TRAFFIC FLOW BASED ON EVIDENCE THEORY COMBINING WITH FUZZY ROUGH SET. Journal of Theoretical & Applied Information Technology, 49(2), 560-566.
CENG Yan. (2012). A prediction method of regional logistics demand based on the coefficient of variation. Statistics and Decision. 21, 95-97.
DAN Bin, YAO Ling, DING You-guo & ZHANG Xu-mei. (2010). Product configuration oriented to fuzzy customer requirement based on ontology mapping. Computer Integrated Manufacturing Systems, 16(2), 225-232.
Dean P R, Xue D & Tu Y L. (2009). Prediction of manufacturing resource requirements from customer demands in mass-customisation production. International Journal of Production Research, 47(5), 1245-1268.
Licensed under Creative Common Page 1503 Ertian H, Huanhuan L & Daqiang C, et al. (2013). A Method for Customer Demands Groups Segmentation in Product Design Based on Fuzzy Clustering and Trigonometric Functions. Intelligent System Design and Engineering Applications (ISDEA), 95-98.
F. De Felice & A. Petrillo. (2010). A multiple choice decision analysis: an integrated QFD – AHP model for the assessment of customer needs. International Journal of Engineering, Science and Technology, 2(9), 25-38.
GUO Yu & WU Qing-lie. (2011). The model on customer requirements responding based on cloud computing in mass customization and the selection and distribution of its nodes. Systems Engineering-Theory & Practice, 31(2), 1-6.
Hariri, A., Leman, A. M., & Yusof, M. Z. M. (2013). Determination of important parameters and technical characteristic for welding fumes index development by using qfd approach. Applied Mechanics and Materials, 315(4), 744-748.
H.-A. Crostack, I. Hackenbroich, R. Refflinghaus & D. Winter. (2007). Investigations Into More Exact Weightings of Customer Demands in QFD. Asian Journal on Quality, 8 (3), 71-80.
HOU Ren-yong. (1990). Equilibrium problem in the process of new product development. R&D Management, 5(5), 5-9.
HUANG Ding-xuan, WU Zhen-ye & ZONG Yun-zhang. (2004). An Impersonal Multi-Attribute Weight Allocation Method Based on Attribute Importance. Systems Engineering-Theory Methodology Application, 13(3), 203-207.
Ievtushenko O & Hodge G L. (2012). Review of Cost Estimation Techniques and Their Strategic Importance in the New Product Development Process of Textile Products. Research Journal of Textile & Apparel, 16(1), 103-124.
Jean-Philippe Gayon, Saif Benjaafar & Francis de Vericourt. (2009). Using Imperfect Advance Demand Information In Production-inventory Systems With Multiple Customer Classes. Manufacturing & Service Operations Management, 11(1), 128-143.
JING You-guo, DAN Bin, ZHANG Xu-mei & GUO Gang. (2011). MC semi-structured customer demand information presentation and processing methods. Journal of Management Sciences in China, 14(1), 78-85.
John Griffiths, Richard James & John Kempson. (2000). Focusing customer demand through manufacturing supply chains by the use of customer focused cells: An appraisal. International Journal of Production Economics, 65 (1), 111-120.
LU Jia-yuan, TAN jian-rong & FENG Yi-xiong. (2011). Weight prediction for technical characteristics in QFD based on LS-SVM. JOURNAL OF MACHINE DESIGN, 28(7), 1-7.
Miguel, P. A. C. (2005). Evidence of qfd best practices for product development: a multiple case study.
International Journal of Quality and Reliability Management, 1(1), 72-83.
REN, Bin, & QIU. (2013). Configurable product design considering the transition of multi-hierarchical models. Chinese Journal of Mechanical Engineering, 26(2), 217-224.
Scholz-Reiter B & Kück M. (2013). Potentials of Nonlinear Dynamics Methods to Predict Customer Demands in Production Networks. Robust Manufacturing Control, 33-45.
Tadic D, Gumus A T & Arsovski S, et al. (2013). An evaluation of quality goals by using fuzzy AHP and fuzzy TOPSIS methodology. Journal of Intelligent and Fuzzy Systems, 25(3), 547-556.
Tan J. Customer Demands Data Acquire Algorithm Research. (2013). Applied Mechanics and Materials, 268, 1758-1761.
Licensed under Creative Common Page 1504 Wu C T, Pan T S & Shao M H. (2013). An Extensive QFD and Evaluation Procedure for Innovative Design. Mathematical Problems in Engineering, 10, 1-7.
YAN Peng, ZHAO Li-ping, WANG Guan-qun & NIE Qin-feng. (2011). Product modular configuration oriented to customer requirements analysis, Computer Integrated Manufacturing Systems 16(11), 2341-2345.
Zhai Li. (2000). Quality function deployment technique and its application. Journal of Industrial Engineering and Engineering Management, 14(1): 52-60.
ZHAO Wen-yan, ZHANG Huan-gao, HE Zhen & TAN Run-hua. (2011). Rough number-customer requirements analytical method. Computer Integrated Manufacturing Systems, 17(11), 2493-2501. ZHEN HE & YOU ZHAO. (2008). Method for Rating Technical Characteristics in Fuzzy QFD. Journal of Tianjin University. 5(5), 631-634.