1
Research Article
Body Mass, Total Body Fat and Visceral Fat Percentage Predict Insulin
Resistance Better Than Waist Circumference and Body Mass Index in
Healthy Young Male Adult in Indonesia
Liong Boy Kurniawan1, Uleng Bahrun1, Mochammad Hatta2, Mansyur Arif1
1Department of Clinical Pathology, Faculty of Medicine, Hasanuddin University, Makassar,
Indonesia
2Department of Immunology and Biomolecular, Faculty of Medicine, Hasanuddin University,
Makassar, Indonesia
Abstract
The incidence of obesity which leads to insulin resistance (IR) and metabolic disorder increases in developing countries including Indonesia. Male adult has higher risk to have abdominal obesity than female which is associated with cardiometabolic disorders. Several anthropometric measurements have been proposed to predict IR. The aim of this study was to investigate whether body mass, body mass index (BMI), waist circumference (WC), body fat percentage (BF) or visceral fat percentage (VF) could become a better predictor of IR in healthy young male adult. Total of 140 healthy young male adults ranging from 18-25 years were recruited in the study. Insulin resistance was measured by calculating Homeostatic Model Assessment for Insulin Resistance (HOMA-IR). Subjects with HOMA-IR value >75th percentile with cut off 3.75 were defined as IR. Anthropometric measurements included body weight, BMI, WC were performed whereas BF and VC were measured by bioelectrical impedance analysis (BIA). IR had significant strong correlation with body weight, BMI, WC, BF and VF. The area under curve of body mass, BF, VF were greater than WC and BMI. Anthropometric measurements correlated strongly with IR but body weight, BF, VF have stronger correlation than WC and BMI in healthy young male adult.
Keywords: insulin resistance, body weight, body fat, visceral fat, waist circumference, body mass index
Corresponding Author: Liong Boy Kurniawan, Department of Clinical Pathology, Faculty of Medicine, Hasanuddin University, 90245 Makassar, South Sulawesi, Indonesia, email: liongboykurniawan@med.unhas.ac.id
2
1. Introduction
Obesity is defined as excess or abnormal fat mass [1]. It is estimated worldwide that
overweight people reach 1.2 billion population and 300 million of them are obesity [2].
Prevalence of obesity in Indonesia was increased in this past 20 years and the prevalence in
adult male was also increased [3]. Obesity is associated with several metabolic disorders
including insulin resistance (IR) and diabetes mellitus (DM). Obesity induces the development
of IR through several mechanisms [4,5]. IR is a predisposition of development DM and
metabolic syndrome [6,7].
The gold standard for measuring insulin resistance is quantification method using
hyperinsulinemic normal blood glucosa clamp but the procedure is quite difficult, inconvenient,
expensive, and time consuming to be performed. A development called homeostasis model
assessment of IR (HOMA-IR) is commonly used as an alternative method to evaluate insulin
resistance which is more convenient, simple, fast, and effective in cost [8,9].
Obesity has strong correlation with development of IR eventhough the causes of IR are
multifactorial. Obesity can be measured by several anthropometric properties such as body
weight (BW), body mass index (BMI), waist circumference (WC) and recently obesity indices
commonly measured by body fat percentage (BF) and visceral fat percentage (VF) performed
by bioelectrical impedance analysis. WC is commonly used as the criteria of abdominal obesity
as the evidence that fat distribution in visceral region is correlated well with IR [10].
The aim of this study was to evaluate the association between 5 common obesity indices
including BW, BMI, WC, BF, VF with IR and to stratify their diagnostic value for prediting IR
3
2. Material And Methods
2.1 Study Sample
This was a cross sectional study performed during the period of July 2017 to February
2018. All voluntary participants were the 1st to the 6th grade male medical students of
Hasanuddin University, Makassar, Indonesia who agred to join the study and gave written
informed consent. Total of 140 subjects were recruited to join the study. All subjects performed
overnight fasting for at least 8 hours and fasting blood was collected. Anthropometric
measurements were also obtained from participants. All study samples were Asian ethnicity
with mostly Indonesian ethnic. We excluded paticipants who used medication including oral
hypoglicemic agents, lipid reducing drugs and corticosteroids. This study was approved by
Komite Etik Penelitian Kesehatan (Health Research Ethical Committee) of Medical Faculty,
Hasanuddin University, Makassar, Indonesia and complied with the Declaration of Helsinki.
2.2Anthropometric and Laboratory Measurements
Anthropometric measurements were performed by a single examiner. BW and height
were measured, BMI was calculated as weight (kg) devided by height squared (m2). WC was
measured at midway level between iliac crist and lower border of 12th rib. BF and VF
percentages were measured by using Tanita (Tokyo, Japan) bioelectrical impedance analysis
(BIA). Blood samples were collected after at least 8 hour overnight fasting periode. Fasting
glucose was measured using Abx Pentra 400 (Horiba, USA) while insulin was measured by
using Elecsys 2010 (Roche, Indianapolis, IN, USA).
2.3Definition of IR
Insulin resistance was calculated by using the homeostatis model asessment of insulin
4
HOMA-IR value >75 percentile was used as cut-off to define IR. In our study, the cut-off value
for IR was 3.75. All HOMA-IR values below the cuf-off were defined as insulin sensitive/non
IR.
2.4 Statistical Analysis
Normality of data distribution was tested by using Kolmogorov-Smirnov test. All
normally distributed data were expressed as mean+standard deviation (SD) while non normally
distributed were expressed as median (minumum-maximum). BF and fasting plasma glucose
were normally distributed while age, BW, height, BMI, WC, insulin, and HOMA-IR were not
normally distributed. Correlation of HOMA-IR and all variables were analyzed with Spearman
Correlation Test. Receiver operating characteristic (ROC) curves were generated for BW, BMI,
WC, BF and VF as predictors of IR. The area under the ROC curve (AUC) and the optimal
cut-off points for IR prediction of BW, BMI, WC, BF and VF were determined by the largest sum
of sensitivity and specificity. All statistical analysis were performed by using the Statistical
Package for the Social Sciences, Version 21.0 (SPSS Inc, Chicago, IL, USA). Statistical
5
RESULTS
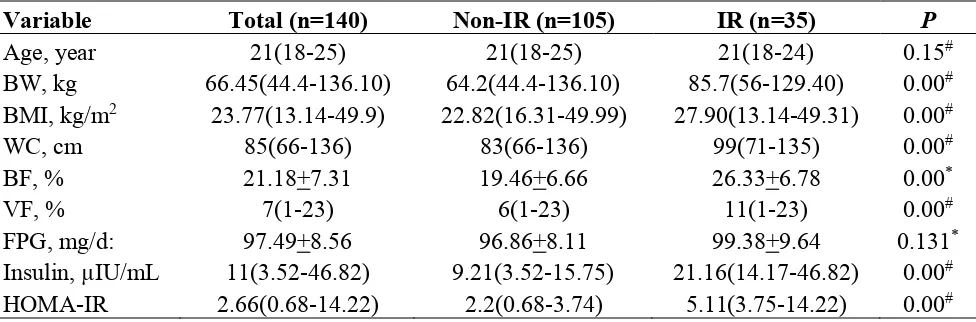
The characteristics of subjects are shown in Table 1. There is no significant difference
of age between IR and non IR Groups. BW, BMI, WC, BF, and VF are significantly higher in
IR group compared with non IR. FPG does not differ significantly between both groups but
insulin and HOMA-IR are significantly higher in IR group.
Tabel 1. Characteristics of Total, IR and non IR Groups
Variable Total (n=140) Non-IR (n=105) IR (n=35) P
Age, year 21(18-25) 21(18-25) 21(18-24) 0.15#
BW, kg 66.45(44.4-136.10) 64.2(44.4-136.10) 85.7(56-129.40) 0.00#
BMI, kg/m2 23.77(13.14-49.9) 22.82(16.31-49.99) 27.90(13.14-49.31) 0.00#
WC, cm 85(66-136) 83(66-136) 99(71-135) 0.00#
BF, % 21.18+7.31 19.46+6.66 26.33+6.78 0.00*
VF, % 7(1-23) 6(1-23) 11(1-23) 0.00#
FPG, mg/d: 97.49+8.56 96.86+8.11 99.38+9.64 0.131*
Insulin, µIU/mL 11(3.52-46.82) 9.21(3.52-15.75) 21.16(14.17-46.82) 0.00#
HOMA-IR 2.66(0.68-14.22) 2.2(0.68-3.74) 5.11(3.75-14.22) 0.00#
Data are expressed mean+standar deviation for normally distributed variables and median (minimum-maximum) for non normally distributed variables. Subjects are devided into 2 groups, IR negative and IR positive based on HOMA-IR >75 percentile value (cut-off 3.75). IR = Insulin Resistance, BW = body weight, BMI = body mass index, WC = waist circumference, BF = body fat percentage, VF = visceral fat percentage
*T Test
#Mann Whitney Test
BW, BMI, WC, BF, VF show significant correlation with HOMA-IR (Table 2). Table 2. Correlation of IR with Several Indices of Obesity
Variables Correlation Coefficient* P
BW 0.480 0.00
BMI 0.390 0.00
WC 0.456 0.00
BF 0.438 0.00
VF 0.438 0.00
IR = Insulin Resistance, BW = body weight, BMI = body mass index, WC = waist circumference, BF = body fat percentage, VF = visceral fat percentage
*Spearman Correlation Test
6
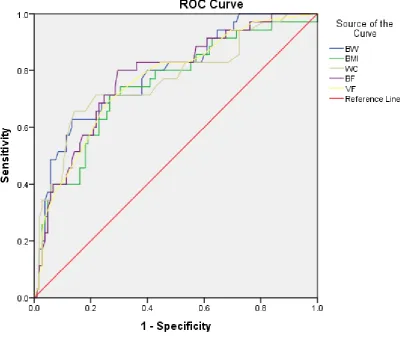
highest sensitivity by using off 22.05 whereas VF has the highest specificity by using cut-off 8.5 (Table 3).
Figure 1. ROC Curve for BW, BMI, WC, BF, and VF as predictors of IR. IR = Insulin Resistance, BW = body weight, BMI = body mass index, WC = waist circumference, BF = body fat percentage, VF = visceral fat percentage, ROC = receiver operating characteristic curve.
Table 3. The AUC, Sensitivity, and Specificity by the Most Optimal Cut-Off Point of Different Obesity Indices in Predicting IR
Variables AUC (95% CI) Sensitivity Specivicity Cut-off Point
BW 0.788 (0.701-0.876) 0.714 0.733 70.2
BMI 0.747 (0.651-0.844) 0.714 0.733 24.93
WC 0.765 (0.666-0.864) 0.714 0.781 91.5
BF 0.779 (0.691-0.868) 0.743 0.714 22.05
VF 0.766 (0.675-0.858) 0.686 0.743 8.5
7
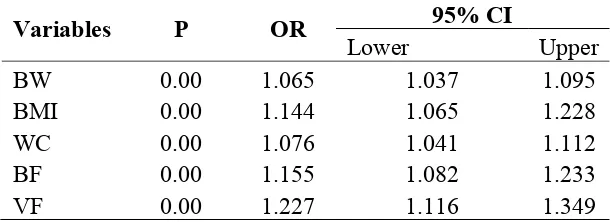
Logistic regression shows every 1 point increase of BW, BMI, WC, BF, and VF increases 1.065, 1.144, 1.076, 1.155, 1.227 occurance of IR respectively (Table 4)
Table 4. Logistic Regression Analysis For Determining IR
Variables P OR 95% CI
Lower Upper
BW 0.00 1.065 1.037 1.095
BMI 0.00 1.144 1.065 1.228
WC 0.00 1.076 1.041 1.112
BF 0.00 1.155 1.082 1.233
VF 0.00 1.227 1.116 1.349
IR = Insulin Resistance, BW = body weight, BMI = body mass index, WC = waist circumference, BF = body fat percentage, VF = visceral fat percentage
DISCUSSION
In this study of healthy young male adults Indonesian subjects, the cut-off value of
HOMA-IR was 3.75, higher than proposed by earlier Caucasian study with cut-off 2.29, middle
age, elderly Taiwanese with cut-off 2.30, and Iranian with cut off 2.6 [11-13]. This difference
might be due to difference of ethicity, gender, and age group. The results of our study show that
5 obesity indices –BW, BMI, WC, BF, and VF- all have significant correlation with IR. Further
analysis revealed that the AUC of BW, BF and VF were larger than WC and BMI. Interesting
finding in our study was BW found to have stronger correlation with IR and had the largest
AUC area compared with other obesity indices, with best cut-off 70.20 kg in our population,
for BW was rarely used as obesity index. We proposed BW cut-off point 70.20 as a simple IR
predictor for young male adult in our population. We could not explain exactly the causality
and pathomechanism why BW and IR had the best predictor value, further researches are
needed to confirm it. We found the cut-off values of BMI and WC were 24.93 kg/m2 and 91.5
cm respectively, which nearly meet the criteria of obesity classified by World Health
Organization for Asia population (BMI = 25 kg/m2) and criteria for abdominal obesity (WC =
90 cm). From this result, we suggest that young male adult who meet the cut-off point for
8
disorders to prevent the development of diseases. In our study, BF and VF had slightly larger
AUC than WC and BMI. The possible explaination might be the BF and VF in male adult had
better value in reflecting adipose tissue which was one of main cause of IR while WC and BMI
did not exactly mirror fat content.
WC and BMI have been used as traditional obesity index for assessing IR. Bluher [14]
reported that BMI and WC were best predictors of cardiometabolic comorbidities in obese
pubertal adolescents. Ling [15] reported that BMI and WC were simple predictors of fasting
insulin and insulin resistance in overweight and obese adolescents. WC was strongly associated
with glucose and lipid disturbance in obese subjects [16]. BMI had strong association with
HOMA-IR in adolescents [17]. In this past few years, several obesity index assessed with BIA
method including BF and VF were evaluated. Fernandes [18] found that BIA method was good
in identifying excess visceral and subcutaneus fat. Fat mass measured by BIA method had good
association with fat mass evaluated from Dual Energy X Ray Absorptiometry (DXA) [19].
Study from Korean high school students showed that BF was associated with HOMA-IR in
male students [20].
Our result and other previous results showed that predictions of IR might be influenced
by ethicity, gender and age. Our study is one of a few study concerning young male adult in
South East Asia especially in Indonesia to study the association of 5 obesity indices with IR.
Our study revealed that BW, BMI, WC, BF, and VF had significant association with IR, but
BW, BF, and VF had slightly better predictor value than WC and BMI.
Our study had several limitations. First, this was a cross-sectional study, therefore,
causal relationship of obesity indices and IR could not be determined and explained. Second,
9
In conclusion, we demonstrated that BW, BMI, WC, BF, and VF had significant
correlation with IR but BW, BF and VF had better predictor value.
Author Contribution: Liong Boy Kurniawan conceived the idea for the paper, researched
literature, researched data, wrote and edited the manuscript. All other authors contributed in
developed the concept, discussion, wrote and edited the manuscript.
Conflicts of Interest: The authors declare no conflict of interest. This study is a part of
correseponding author on going Dissertation project.
References
1. Ellulu M.; Abed Y.; Rahmat A.; Ranneh Y.; Ali F. Epidemiolgy of Obesity in Developing Countries: Challenges and Prevention. Global Epidemic Obesity 2014, DOI: 10.7243/2052-5966-2-2.
2. Willborn C.; Beckham J.; Campbell B.; Harvey T.; Galbreath M.; Bounty P.L. et al. Obesity: Prevalence, Theories, Medical Consequences, Management, and Research Directions. Journal of the International Society of Sports Nutrition 2005, 2(2), 4-31.
3. Rachmi C.N.; Li M.; Baur L.A. Overweight and Obesity in Indonesia: Prevalence and Risk Factors- A Literature Review. Public Health 2017, 20-29.
4. Samuel, V.T.; Shulman, G.I. Mechanism for Insulin Resistance: Common Threads and Missing Links. Cell. 2012, 148, 852-865.
5. Despres, J.P. Abdominal Obesity: The Most Prevalent Cause of The Metabolic Syndome and Related cardiometabolic Risk. European Heart Journal 2006, Supplements. 8(Supplement B), B4-B12.
6. Therkelsen K.E.; Pedley A.; Speliotes E.K.; Massaro J.M.; Murabito J.; Hoffmann U.; Fox C.S. Intramuscular Fat and Associations With Metabolic Risk Factors in the Framingham Heart Study. Arterioscler Thromb Vasc Biol. 2013, 33, 863-870.
7. Wang H.; Liu A.; Zhao T.; Gong X.; Pang T.; Zhou Y.; et al. Comparison of Anthropometric Indices for Predicting the Risk of Metabolic Syndrome and Its Components in Chinese Adults: A Prospective, Longitudinal Study. BMJ Open 2017, 7.
8. DeFronzo R.A.; Tobin J.D.; Andres R. Glucose Clamp Technique: A Method for Quantifying Insulin Secretion and Resistance. Am J Physiol 1979, 237, G214-23.
9. Bonora E.; Targher G.; Alberiche M.; et al. Homeostasis Model Assessment Closely Mirrors The Glucose Clamp Technique in the Assessment of Insulin Sensitivity: Studies in Subjects With Various Degrees of Glucose Tolerance and Insulin Sensitivity. Diabetes Care 2000, 23, 57-63.
10.Sasaki R.; Yano Y.; Yasuma T.; et al. Association of Waist Circumference and Body Fat Weight with Insulin Resistance in Male Subjects with Normal Body Mass Index and Normal Glucose Tolerance. Intern Med 2016, 55, 1425-32.
10
12.Cheng Y.H.; Tsao Y.C.; Tzeng I.S.; Chuang H.H.; Li W.C.; Tung T.H.; Chen J.Y. Body Mass Index and Waist Circumference Are Better Predictors of Insulin Resistance than Total Body Fat Percentage in Middle-Aged and Elderly Taiwanese. Medicine 2017, 96, 39. 13.Hatami H.; Montazeri S.A.; Hashemi N.; Tehrani F.R. Optimal Cutoff Points for
Anthropometric Variables to Predict Insulin Resistance in Polycystic Ovary Syndrome. Int J Endocrinol Metab 2017, 15(4), e12353.
14.Bluher S.; Molz E.; Wiegand S.; Otto K.P.; Sergeyev E.; Tuschy S.; et al. Body Mass Index, Waist Circumference, and Waist-To-Height Ratio as Predictors of Cardiometabolic Risk in Childhood Obesity Depending on Pubertal Development. J Clin Endocrinol Metab 2013, 98(8), 3384-3393.
15.Ling J.C.Y.; Mohamed M.N.A.; Jalaludin M.Y.; Rampal S.; Zaharan N.L.; Mohamed Z. Determinants of High fasting Insulin and Insulin Resistance Among Overweight/Obese Adolescents. Scientific Reports 2016, DOI:10.1038/srep36270.
16.Lietz B.J.; Wrzosek M.; Wlodarczyk M.; Nowicka G. New Indexes of Body Fat Distribution, Visceral Adiposity Index, Body Adiposity Index, Waist-To-Height Ratio, and Metabolic Disturbances in the Obese. Kardiologia Polska 2017, 75, 11, 1185-1191.
17.Bhattacharya S.; Smith G.D.; Shah S.H.; Ben-Shlomo Y.; Kinra S. Anthropometric Measures and Insulin Resistance in Rural Indian Adolescents. J Biosafety Health Educ 2014, 2, 2.
18.Fernandes R.A.; Rosa C.S.C.; Buonani C.; Oliveira A.R.; Junior I.F.F. The Use of Bioelectrical Impedance to Detect Excess Visceral and Subcutaneous Fat. Journal de Pediatria 2007, 83(6), 529-34.
19.Donini L.M.; Poggiogalle E.; Balzo V.; Lubrano C.; Faliva M.; Opizzi A.; et al. How to Estimate Fat Mass in Overweight and Obese Subjects. International Journal of Endocrinology 2013, ID 285689, 9.