water
Article
An Experimental Study of Two-Phase Pulse Flushing
Technology in Water Distribution Systems
Zhaozhao Tang1, Wenyan Wu2 ID, Xiaoxi Han3and Ming Zhao3,*
1 School of Computing and Digital Technologies, Staffordshire University, Stoke on Trent ST4 2DE, UK;
2 School of Engineering and the Built Environment, Birmingham City University, Birmingham B4 7XG, UK;
3 School of Municipal and Environmental Engineering, Harbin Institute of Technology, Harbin 150090, China;
* Correspondence: [email protected]; Tel.: +86-451-8628-2332
Received: 17 October 2017; Accepted: 21 November 2017; Published: 28 November 2017
Abstract: The deterioration of drinking water during distribution process is caused by many factors. The microorganisms and substances peeling off from the “growth-ring” make the secondary pollution in drinking water distribution systems. To reduce the secondary pollution, two-phase pulse flushing technology is introduced to quickly remove the “growth-ring”. In this study, experiment is undertaken for investigating the efficiency of the two-phase pulse flushing and finding the best setting combination. A case study is undertaken to compare the efficiencies between the two-phase pulse and the single-phase flushing. The best setting combination of the two-phase pulse flushing is at the frequency 4 s–6 s (air inflow time is 4 s and air cut off time is 6 s) and the round air inflow nozzle is set at the bottom of the pipe. Two-phase pulse flushing technology can save 95% of water and 6 h 40 min flushing time.
Keywords:water distribution system; secondary pollution; growth-ring; flushing
1. Introduction
The water consumed by the consumers travels large distances and takes long durations through the water distribution system. The secondary pollution causing deterioration occurs after clean drinking water leaves the treatment plant. The deterioration in drinking water quality is influenced by many factors, e.g., decay of disinfectant residual, temperature, hydraulic regime, water residence time, bacterial regrowth, etc. [1–3].
During drinking water distribution, the secondary pollution is mainly caused by the so-called “growth-ring”. Sediments attach on the pipe wall, and they can interact with the pipe wall materials by chemical or electrochemical processes and microorganisms, which forms an irregular “growth-ring” towards the centre of the pipe [4–7]. The microorganisms and substances peeling off from the “growth-ring” into bulk water is the main mechanism of the secondary pollution in drinking water
distribution system [8].
The “growth-ring” contains high percentage of water which takes generally over 1/3 and sometimes even over 1/2 of the contents [4]. Through X-ray diffraction (XRD) and X-ray photoelectron spectroscopy (XPS) analysis, the main ingredients of the “growth-ring” are goethite, ferrous sulphide, etc., while iron is the major element, approximately 55% of the content [4]. The “growth-ring” generally has three layers: biological membrane layer, deposition layer and corrosion layer. This structure provides the environment for the growth of bacteria, and the bacteria can promote the corrosion of the metal [9]. Sanitisers are used to control the growth of microorganisms, but residual sanitisers can increase the reaction velocity of corrosion [10]. The “growth-ring” can also cause leakage because its
Water2017,9, 927 2 of 25
growth occupies the room for water distribution. Therefore, it is imperative to reduce the influence of the “growth-ring” in order to improve the drinking water quality.
This paper experimentally investigates the two-phase pulse flushing technology for efficient removal of the “growth-ring”. The influences of different pulse frequencies, shapes of inlets and locations of the inlets are discussed in order to obtain the best setting combination. A case study of the comparison between two-phase pulse and single-phase flushing is presented in this paper.
2. Two-Phase Pulse Flushing Experiment
2.1. Experiment Set Up
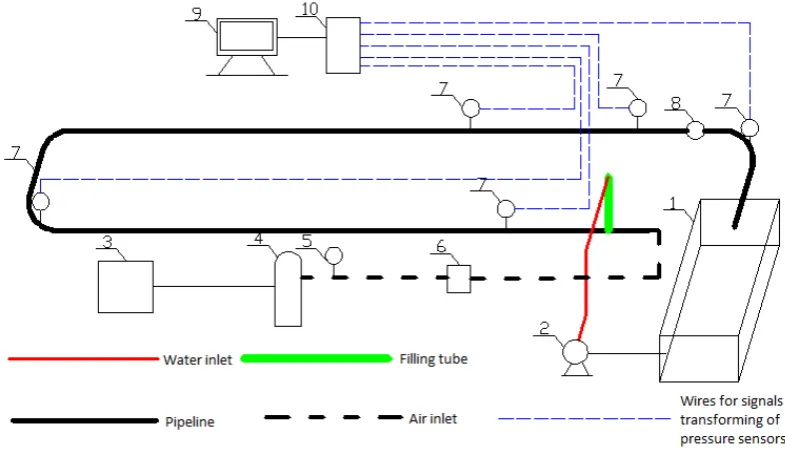
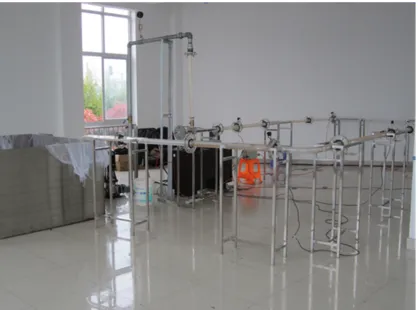
The experiment set up scheme is shown in Figure1, and Figure2is the practical experiment set up in the lab. The material of the pipes used for this experiment is polymethyl methacrylate. The pipes are connected by flanges. The internal diameter of the pipes is 40 mm, and the external diameter is 60 mm. The size of the water tank is 2000 mm×2000 mm×1000 mm. The framework consists of a circulatory water supply system, an air supply system, an experimental pipe line with feeding device and a data acquisition system.
Water 2017, 9, 927 2 of 25
leakage because its growth occupies the room for water distribution. Therefore, it is imperative to reduce the influence of the “growth-ring” in order to improve the drinking water quality.
This paper experimentally investigates the two-phase pulse flushing technology for efficient removal of the “growth-ring”. The influences of different pulse frequencies, shapes of inlets and locations of the inlets are discussed in order to obtain the best setting combination. A case study of the comparison between two-phase pulse and single-phase flushing is presented in this paper.
2. Two-Phase Pulse Flushing Experiment
2.1. Experiment Set Up
The experiment set up scheme is shown in Figure 1, and Figure 2 is the practical experiment set up in the lab. The material of the pipes used for this experiment is polymethyl methacrylate. The pipes are connected by flanges. The internal diameter of the pipes is 40 mm, and the external diameter is 60 mm. The size of the water tank is 2000 mm × 2000 mm × 1000 mm. The framework consists of a circulatory water supply system, an air supply system, an experimental pipe line with feeding device and a data acquisition system.
Figure 1. Two-phase pulse flushing experiment set up: (1) water tank; (2) water pump; (3) wir compressor; (4) gasholder; (5) pressure control valve; (6) pulse generator; (7) pressure transmitter; (8) flow meter; (9) computer; and (10) data acquisition module.
The water pump draws the water from the water tank and the flow rate is controlled by the valve. The measurement of the flow rate is undertaken by the flow meter. Air goes into the air compressor for compressing. Air pressure is controlled by the gasholder. In this two-phase (gas and water) experiment set up, the entire pipeline is strictly sealed. The pumped-out water and the compressed air are mixed in a T joint and then flow into the water tank along the pipeline. In the end, the water flows into the water tank for circulatory use.
Figure 1. Two-phase pulse flushing experiment set up: (1) water tank; (2) water pump; (3) wir compressor; (4) gasholder; (5) pressure control valve; (6) pulse generator; (7) pressure transmitter; (8) flow meter; (9) computer; and (10) data acquisition module.
Water2017,9, 927 3 of 25
Water 2017, 9, 927 3 of 25
Figure 2. Practical two-phase pulse flushing experiment set up in the laboratory.
2.2. Single-Phase Flushing
A single-phase flushing investigation is undertaken for comparison with the following two-phase pulse flushing with different settings. Air flow is closed and only water flows into the pipeline. The average water flow rate is 0.0026 m3/s, and the velocity of the water flow is 2.07 m/s. The average pressure head at pressure sensing locations No. 1, 2, 3, 4 and 5, according to Figure 1, are 2.19 m (metres of water), 1.83 m, 1.79 m, 1.59 m and 0.74 m, respectively. Under the conditions of identical temperature values, pipe materials and diameters, if the flow velocity is greater than the critical value 0.066 m/s, the water flow in the pipeline is turbulent (Reynolds number Re > Rec = 2300).
2.3. Two-Phase Pulse Flushing
In this research, the air inflow and cut off time is from 3 to 6 s. Different shapes of nozzles (round, rectangular and slot) and different locations of nozzles (in the middle, on top or on bottom of the pipe) are set for experimental results comparison.
The experiment is undertaken by only changing one of the conditions (air inflow and cut off time, nozzle shape and location). The best condition combination is obtained by following the following principles. Setting the nozzle shape and location invariant, the pressure fluctuation of No. 1 pressure sensing point is recorded as the prioritised reference, and the average flow velocity is recorded as the subordinate reference. The best air inflow frequency is obtained when the pressure fluctuation reaches maximum and the flow velocity reaches a high value simultaneously. If the flow velocity does not reach a high value at the maximum pressure fluctuation point, it needs to be evaluated at the second, third, etc. highest pressure fluctuation point until the flow velocity reaches a high value. The best air inflow frequency can be obtained by using the rules above.
Figure 2.Practical two-phase pulse flushing experiment set up in the laboratory.
2.2. Single-Phase Flushing
A single-phase flushing investigation is undertaken for comparison with the following two-phase pulse flushing with different settings. Air flow is closed and only water flows into the pipeline. The average water flow rate is 0.0026 m3/s, and the velocity of the water flow is 2.07 m/s. The average pressure head at pressure sensing locations No. 1, 2, 3, 4 and 5, according to Figure1, are 2.19 m (metres of water), 1.83 m, 1.79 m, 1.59 m and 0.74 m, respectively. Under the conditions of identical temperature values, pipe materials and diameters, if the flow velocity is greater than the critical value 0.066 m/s, the water flow in the pipeline is turbulent (Reynolds number Re > Rec= 2300).
2.3. Two-Phase Pulse Flushing
In this research, the air inflow and cut off time is from 3 to 6 s. Different shapes of nozzles (round, rectangular and slot) and different locations of nozzles (in the middle, on top or on bottom of the pipe) are set for experimental results comparison.
Water2017,9, 927 4 of 25
2.3.1. Round Nozzle
In the Middle of the Pipe
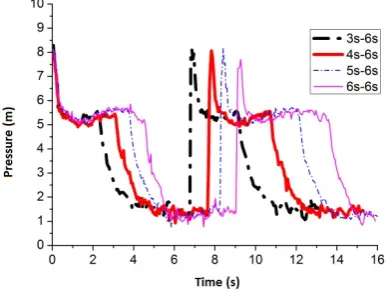
Setting the air inflow time invariant, Figure3shows the maximum average peak pressure of the flow inside the pipe comes after the air inflow is cut off for 6 s. The average peak pressure is 8.1 m when the frequency is 4 s–6 s (air inflow time 4 s and air cut off time 6 s). When the frequency is 5 s–6 s and 6 s–6 s, the average peak pressure is 8.96 m and 7.94 m, respectively. Figure4shows the pressure comparison of the four best frequencies. When air cut off duration is 6 s, few differences are caused by pulse frequency through applying different air inflow time. The result shows that the peak pressure reaches the maximum 8.96 m at the frequency 5 s–6 s (round nozzle in the middle of the pipe).
Water 2017, 9, 927 4 of 25
2.3.1. Round Nozzle
In the Middle of the Pipe
Setting the air inflow time invariant, Figure 3 shows the maximum average peak pressure of the flow inside the pipe comes after the air inflow is cut off for 6 s. The average peak pressure is 8.1 m when the frequency is 4 s–6 s (air inflow time 4 s and air cut off time 6 s). When the frequency is 5 s– 6 s and 6 s–6 s, the average peak pressure is 8.96 m and 7.94 m, respectively. Figure 4 shows the pressure comparison of the four best frequencies. When air cut off duration is 6 s, few differences are caused by pulse frequency through applying different air inflow time. The result shows that the peak pressure reaches the maximum 8.96 m at the frequency 5 s–6 s (round nozzle in the middle of the pipe).
(a) (b)
(c) (d)
Figure 3. Pressure fluctuation of No. 1 sensing point (round nozzle is in the middle of the pipe): (a) air inflow time is 3 s; (b) air inflow time is 4 s; (c) air inflow time is 5 s; and (d) air inflow time is 6 s.
Figure 4. The four best pressure values (round nozzle in the middle of the pipe).
Figure 3.Pressure fluctuation of No. 1 sensing point (round nozzle is in the middle of the pipe): (a) air inflow time is 3 s; (b) air inflow time is 4 s; (c) air inflow time is 5 s; and (d) air inflow time is 6 s.
Water 2017, 9, 927 4 of 25
2.3.1. Round Nozzle
In the Middle of the Pipe
Setting the air inflow time invariant, Figure 3 shows the maximum average peak pressure of the flow inside the pipe comes after the air inflow is cut off for 6 s. The average peak pressure is 8.1 m when the frequency is 4 s–6 s (air inflow time 4 s and air cut off time 6 s). When the frequency is 5 s– 6 s and 6 s–6 s, the average peak pressure is 8.96 m and 7.94 m, respectively. Figure 4 shows the pressure comparison of the four best frequencies. When air cut off duration is 6 s, few differences are caused by pulse frequency through applying different air inflow time. The result shows that the peak pressure reaches the maximum 8.96 m at the frequency 5 s–6 s (round nozzle in the middle of the pipe).
(a) (b)
(c) (d)
Figure 3. Pressure fluctuation of No. 1 sensing point (round nozzle is in the middle of the pipe): (a) air inflow time is 3 s; (b) air inflow time is 4 s; (c) air inflow time is 5 s; and (d) air inflow time is 6 s.
Water2017,9, 927 5 of 25
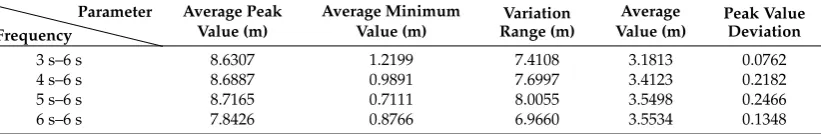
The best frequency is not clear after air inflow is cut off for 6 s through the comparison of the four best pressure values in Figure4. Therefore, four cycles of pressure data are selected to perform the statistical analysis in every operating condition to help find the best frequency (Table1).
Table 1.Pressure values and statistical analysis after air inflow has been cut off for 6 s (round nozzle in the middle of the pipe).
Frequency
Parameter Average Peak Average Minimum Variation Average Peak Value
Value (m) Value (m) Range (m) Value (m) Deviation
3 s–6 s 8.6307 1.2199 7.4108 3.1813 0.0762
4 s–6 s 8.6887 0.9891 7.6997 3.4123 0.2182
5 s–6 s 8.7165 0.7111 8.0055 3.5498 0.2466
6 s–6 s 7.8426 0.8766 6.9660 3.5534 0.1348
Figure5shows the average flow velocity of the water flow in the pipe by applying above settings.
Water 2017, 9, 927 5 of 25
The best frequency is not clear after air inflow is cut off for 6 s through the comparison of the four best pressure values in Figure 4. Therefore, four cycles of pressure data are selected to perform the statistical analysis in every operating condition to help find the best frequency (Table 1).
Table 1. Pressure values and statistical analysis after air inflow has been cut off for 6 s (round nozzle in the middle of the pipe).
Parameter Frequency
Average Peak Value (m)
Average Minimum Value (m)
Variation Range (m)
Average Value (m)
Peak Value Deviation
3 s–6 s 8.6307 1.2199 7.4108 3.1813 0.0762
4 s–6 s 8.6887 0.9891 7.6997 3.4123 0.2182
5 s–6 s 8.7165 0.7111 8.0055 3.5498 0.2466
6 s–6 s 7.8426 0.8766 6.9660 3.5534 0.1348
Figure 5 shows the average flow velocity of the water flow in the pipe by applying above settings.
Figure 5. Comparison of water flow velocity at all frequencies (round nozzle in the middle of the pipe).
In Table 1 and Figure 5, the best frequency for the round nozzle in the middle of the pipe can be obtained as 5 s–6 s. The average water flow velocity can reach 2.534 m/s in the pipe at the frequency 5 s–6 s. Although the pressure peak value deviation at 5 s–6 s is slightly higher than the other three frequencies, the average peak pressure value and the fluctuation range reach maximum simultaneously.
Nozzle on Top of the Pipe
Figure 6 shows the maximum average peak pressure comes after air inflow is cut off for 6 s by setting the air inflow time invariant. When the frequency is 3 s–6 s, 4 s–6 s, 5 s–6 s and 6 s–6 s, the average peak pressure reaches 8.20 m, 8.31 m, 8.47 m and 8.08 m, respectively. Figure 7 shows the pressure comparison of the four best frequencies. When air cut off duration is 6 s, few differences are caused by pulse frequency through applying different air inflow time. The result shows that the peak pressure reaches the maximum 8.47 m at the frequency 5 s–6 s (round nozzle on top of the pipe).
Figure 5.Comparison of water flow velocity at all frequencies (round nozzle in the middle of the pipe).
In Table1and Figure5, the best frequency for the round nozzle in the middle of the pipe can be obtained as 5 s–6 s. The average water flow velocity can reach 2.534 m/s in the pipe at the frequency 5 s–6 s. Although the pressure peak value deviation at 5 s–6 s is slightly higher than the other three frequencies, the average peak pressure value and the fluctuation range reach maximum simultaneously.
Nozzle on Top of the Pipe
WaterWater 2017, 9, 927 2017,9, 927 6 of 256 of 25
(a) (b)
(c) (d)
Figure 6. Pressure fluctuation of No. 1 sensing point (round nozzle on top of the pipe): (a) air inflow time is 3 s; (b) air inflow time is 4 s; (c) air inflow time is 5 s; and (d) air inflow time is 6 s.
Figure 7. The four best pressure values (round nozzle on top of the pipe).
The best frequency is not clear after air inflow is cut off for 6 s through the comparison of the four best pressure values in Figure 7. Therefore, four cycles of pressure data are selected to perform the statistical analysis in every operating condition to help find the best frequency (Table 2).
Figure 6.Pressure fluctuation of No. 1 sensing point (round nozzle on top of the pipe): (a) air inflow time is 3 s; (b) air inflow time is 4 s; (c) air inflow time is 5 s; and (d) air inflow time is 6 s.
Water 2017, 9, 927 6 of 25
(a) (b)
(c) (d)
Figure 6. Pressure fluctuation of No. 1 sensing point (round nozzle on top of the pipe): (a) air inflow time is 3 s; (b) air inflow time is 4 s; (c) air inflow time is 5 s; and (d) air inflow time is 6 s.
Figure 7. The four best pressure values (round nozzle on top of the pipe).
The best frequency is not clear after air inflow is cut off for 6 s through the comparison of the four best pressure values in Figure 7. Therefore, four cycles of pressure data are selected to perform the statistical analysis in every operating condition to help find the best frequency (Table 2).
Figure 7.The four best pressure values (round nozzle on top of the pipe).
Water2017,9, 927 7 of 25
Table 2.Pressure values and statistical analysis after air inflow has been cut off for 6 s (round nozzle on top of the pipe).
Frequency
Parameter Average Peak Average Minimum Variation Average Peak Value
Value (m) Value (m) Range (m) Value (m) Deviation
3 s–6 s 8.3974 1.1897 7.2077 3.1624 0.2393
4 s–6 s 8.6875 1.0217 7.6658 3.3755 0.2635
5 s–6 s 8.3382 0.8235 7.5174 3.5776 0.2913
6 s–6 s 8.1146 0.8476 7.2669 3.5676 0.0955
Figure8shows the average flow velocity of the water flow in the pipe by applying above settings.
Water 2017, 9, 927 7 of 25
Table 2. Pressure values and statistical analysis after air inflow has been cut off for 6 s (round nozzle on top of the pipe).
Parameter Frequency
Average Peak Value (m)
Average Minimum Value (m)
Variation Range (m)
Average Value (m)
Peak Value Deviation
3 s–6 s 8.3974 1.1897 7.2077 3.1624 0.2393
4 s–6 s 8.6875 1.0217 7.6658 3.3755 0.2635
5 s–6 s 8.3382 0.8235 7.5174 3.5776 0.2913
6 s–6 s 8.1146 0.8476 7.2669 3.5676 0.0955
Figure 8 shows the average flow velocity of the water flow in the pipe by applying above settings.
Figure 8. Comparison of water flow velocity at all frequencies (round nozzle on top of the pipe).
In Table 2 and Figure 8, the best frequency can be obtained as 4 s–6 s (round nozzle on top of the pipe). The average peak pressure value and the fluctuation range of No. 1 sensing point reach maximum simultaneously and the average water flow velocity reaches a high value 2.311 m/s in the pipe at the frequency 4 s–6 s.
Nozzle at the Bottom of the Pipe
Figure 9 shows the maximum average peak pressure comes after air inflow is cut off for 6 s by setting the air inflow time invariant. When the frequency is 3 s–6 s, 4 s–6 s, 5 s–6 s and 6 s–6s, the average peak pressure is 8.74 m, 9.03 m, 8.00 m and 7.88 m, respectively. Figure 10 shows the pressure comparison of the four best frequencies. Few differences are caused by pulse frequency by applying different air inflow time after air inflow is cut off for 6 s. When the frequency is 4 s–6 s, the peak pressure reaches the maximum value 9.03 m (round nozzle at the bottom of the pipe).
(a) (b)
Figure 8.Comparison of water flow velocity at all frequencies (round nozzle on top of the pipe).
In Table2and Figure8, the best frequency can be obtained as 4 s–6 s (round nozzle on top of the pipe). The average peak pressure value and the fluctuation range of No. 1 sensing point reach maximum simultaneously and the average water flow velocity reaches a high value 2.311 m/s in the pipe at the frequency 4 s–6 s.
Nozzle at the Bottom of the Pipe
Figure9shows the maximum average peak pressure comes after air inflow is cut off for 6 s by setting the air inflow time invariant. When the frequency is 3 s–6 s, 4 s–6 s, 5 s–6 s and 6 s–6 s, the average peak pressure is 8.74 m, 9.03 m, 8.00 m and 7.88 m, respectively. Figure10shows the pressure comparison of the four best frequencies. Few differences are caused by pulse frequency by applying different air inflow time after air inflow is cut off for 6 s. When the frequency is 4 s–6 s, the peak pressure reaches the maximum value 9.03 m (round nozzle at the bottom of the pipe).
Water 2017, 9, 927 7 of 25
Table 2. Pressure values and statistical analysis after air inflow has been cut off for 6 s (round nozzle on top of the pipe).
Parameter Frequency
Average Peak Value (m)
Average Minimum Value (m)
Variation Range (m)
Average Value (m)
Peak Value Deviation
3 s–6 s 8.3974 1.1897 7.2077 3.1624 0.2393
4 s–6 s 8.6875 1.0217 7.6658 3.3755 0.2635
5 s–6 s 8.3382 0.8235 7.5174 3.5776 0.2913
6 s–6 s 8.1146 0.8476 7.2669 3.5676 0.0955
Figure 8 shows the average flow velocity of the water flow in the pipe by applying above settings.
Figure 8. Comparison of water flow velocity at all frequencies (round nozzle on top of the pipe).
In Table 2 and Figure 8, the best frequency can be obtained as 4 s–6 s (round nozzle on top of the pipe). The average peak pressure value and the fluctuation range of No. 1 sensing point reach maximum simultaneously and the average water flow velocity reaches a high value 2.311 m/s in the pipe at the frequency 4 s–6 s.
Nozzle at the Bottom of the Pipe
Figure 9 shows the maximum average peak pressure comes after air inflow is cut off for 6 s by setting the air inflow time invariant. When the frequency is 3 s–6 s, 4 s–6 s, 5 s–6 s and 6 s–6s, the average peak pressure is 8.74 m, 9.03 m, 8.00 m and 7.88 m, respectively. Figure 10 shows the pressure comparison of the four best frequencies. Few differences are caused by pulse frequency by applying different air inflow time after air inflow is cut off for 6 s. When the frequency is 4 s–6 s, the peak pressure reaches the maximum value 9.03 m (round nozzle at the bottom of the pipe).
(a) (b)
WaterWater 2017, 9, 927 2017,9, 927 8 of 25 8 of 25
(c) (d)
Figure 9. Pressure fluctuation of No. 1 sensing point (round nozzle at the bottom of the pipe): (a) air inflow time is 3 s; (b) air inflow time is 4 s; (c) air inflow time is 5 s; and (d) air inflow time is 6 s.
Figure 10. The four best pressure values (round nozzle at the bottom of the pipe).
The best frequency is not clear after air inflow is cut off for 6 s through the comparison of the four best frequencies (Figure 10). Therefore, four cycles of pressure data are selected to perform the statistical analysis in every operating condition to help find the best frequency (Table 3).
Table 3. Pressure values and statistical analysis after air inflow has been cut off for 6 s (round nozzle at the bottom of the pipe).
Parameter Frequency
Average Peak Value (m)
Average Minimum Value (m)
Variation Range (m)
Average Value (m)
Peak Value Deviation
3 s–6 s 8.7697 1.1305 7.6392 3.2263 0.2949
4 s–6 s 8.9498 1.0193 7.9305 3.4144 0.1342
5 s–6 s 8.2246 0.7642 7.4603 3.5700 0.1704
6 s–6 s 7.8571 0.8174 7.0397 3.5493 0.1583
Figure 11 shows the average flow velocity of the water flow in the pipe by applying the above flushing conditions.
In Table 3 and Figure 11, the best frequency can be obtained as 4 s–6 s (round nozzle at the bottom of the pipe). The average peak pressure value and the fluctuation range of No. 1 sensing point reach maximum simultaneously and the average water flow velocity reaches a high value 2.957 m/s at the frequency 4 s–6 s.
Figure 9.Pressure fluctuation of No. 1 sensing point (round nozzle at the bottom of the pipe): (a) air inflow time is 3 s; (b) air inflow time is 4 s; (c) air inflow time is 5 s; and (d) air inflow time is 6 s.
Water 2017, 9, 927 8 of 25
(c) (d)
Figure 9. Pressure fluctuation of No. 1 sensing point (round nozzle at the bottom of the pipe): (a) air inflow time is 3 s; (b) air inflow time is 4 s; (c) air inflow time is 5 s; and (d) air inflow time is 6 s.
Figure 10. The four best pressure values (round nozzle at the bottom of the pipe).
The best frequency is not clear after air inflow is cut off for 6 s through the comparison of the four best frequencies (Figure 10). Therefore, four cycles of pressure data are selected to perform the statistical analysis in every operating condition to help find the best frequency (Table 3).
Table 3. Pressure values and statistical analysis after air inflow has been cut off for 6 s (round nozzle at the bottom of the pipe).
Parameter Frequency
Average Peak Value (m)
Average Minimum Value (m)
Variation Range (m)
Average Value (m)
Peak Value Deviation
3 s–6 s 8.7697 1.1305 7.6392 3.2263 0.2949
4 s–6 s 8.9498 1.0193 7.9305 3.4144 0.1342
5 s–6 s 8.2246 0.7642 7.4603 3.5700 0.1704
6 s–6 s 7.8571 0.8174 7.0397 3.5493 0.1583
Figure 11 shows the average flow velocity of the water flow in the pipe by applying the above flushing conditions.
In Table 3 and Figure 11, the best frequency can be obtained as 4 s–6 s (round nozzle at the bottom of the pipe). The average peak pressure value and the fluctuation range of No. 1 sensing point reach maximum simultaneously and the average water flow velocity reaches a high value 2.957 m/s at the frequency 4 s–6 s.
Figure 10.The four best pressure values (round nozzle at the bottom of the pipe).
The best frequency is not clear after air inflow is cut off for 6 s through the comparison of the four best frequencies (Figure10). Therefore, four cycles of pressure data are selected to perform the statistical analysis in every operating condition to help find the best frequency (Table3).
Table 3.Pressure values and statistical analysis after air inflow has been cut off for 6 s (round nozzle at the bottom of the pipe).
Frequency
Parameter Average Peak Average Minimum Variation Average Peak Value
Value (m) Value (m) Range (m) Value (m) Deviation
3 s–6 s 8.7697 1.1305 7.6392 3.2263 0.2949
4 s–6 s 8.9498 1.0193 7.9305 3.4144 0.1342
5 s–6 s 8.2246 0.7642 7.4603 3.5700 0.1704
6 s–6 s 7.8571 0.8174 7.0397 3.5493 0.1583
Figure11shows the average flow velocity of the water flow in the pipe by applying the above flushing conditions.
Water2017,9, 927 9 of 25
Water 2017, 9, 927 9 of 25
Figure 11. Flow velocity comparison of all frequencies (round nozzle at the bottom of the pipe).
Comparison of Nozzle Locations
At the best flushing frequencies, by using the same nozzle shape (round) and setting different nozzle locations, the fluctuation range and the flow velocity of No. 1 sensing point are compared and given in Table 4. Setting the round nozzle on top of the pipe, the peak pressure and the average flow velocity reach maximum simultaneously, the peak value deviation reaches minimum, and the fluctuation range is high. The above results indicate that the best and most reliable choice for flushing is to set the nozzle at the bottom of the pipe and process at the best frequencies. The best frequency is 4 s–6 s or 5 s–6 s. The best air inflow frequency not only ensures enough air inflow quantity for keeping the ejection flow flushing, but also avoids the negative effects on the flushing results by over air inflow amount. Two-phase (gas and water) high energy flushing effect on the internal pipe wall can be secured at the best air inflow frequencies.
Table 4. Flushing results by setting round nozzle at different locations.
Parameter Location
Average Peak Value (m)
Average Minimum Value (m)
Variation Range (m)
Average Value (m)
Peak Value Deviation
Flow Velocity (m/s)
Top (4 s–6 s) 8.6875 1.0217 7.6658 3.3755 0.2635 2.311
Middle (5 s–6 s) 8.7165 0.7111 8.0055 3.5498 0.2466 2.534
Bottom (4 s–6 s) 8.9498 1.0193 7.9305 3.4144 0.1342 2.957
2.3.2. Rectangular Nozzle
Nozzle in the Middle of the Pipe
Figure 12 shows similar regularity as the former results. The static peak pressure on top of the internal pipe increases with the increase of the air inflow cut off time. The pressure saltation becomes more obvious with the increase of the air inflow cut off time, and therefore turbulence increases, which promotes the cleaning for the pipelines. The maximum average peak pressure comes after air inflow is cut off for 6 s by setting air inflow time invariant. When the frequency is 3 s–6 s, 4 s–6 s, 5 s– 6 s and 6 s–6 s, the average peak pressure is 8.21 m, 7.98 m, 8.10 m and 8.00 m, respectively. Figure 13 shows the pressure comparison of the four best frequencies. When air cut off duration is 6 s, few differences are caused by pulse frequency by applying different air inflow time. At the frequency 3 s–6 s, the peak pressure value reaches maximum, which is 8.21 m (rectangular nozzle in the middle of the pipe).
Figure 11.Flow velocity comparison of all frequencies (round nozzle at the bottom of the pipe).
Comparison of Nozzle Locations
At the best flushing frequencies, by using the same nozzle shape (round) and setting different nozzle locations, the fluctuation range and the flow velocity of No. 1 sensing point are compared and given in Table4. Setting the round nozzle on top of the pipe, the peak pressure and the average flow velocity reach maximum simultaneously, the peak value deviation reaches minimum, and the fluctuation range is high. The above results indicate that the best and most reliable choice for flushing is to set the nozzle at the bottom of the pipe and process at the best frequencies. The best frequency is 4 s–6 s or 5 s–6 s. The best air inflow frequency not only ensures enough air inflow quantity for keeping the ejection flow flushing, but also avoids the negative effects on the flushing results by over air inflow amount. Two-phase (gas and water) high energy flushing effect on the internal pipe wall can be secured at the best air inflow frequencies.
Table 4.Flushing results by setting round nozzle at different locations.
Location
Parameter Average Peak Average Minimum Variation Average Peak Value Flow Velocity Value (m) Value (m) Range (m) Value (m) Deviation (m/s)
Top (4 s–6 s) 8.6875 1.0217 7.6658 3.3755 0.2635 2.311
Middle (5 s–6 s) 8.7165 0.7111 8.0055 3.5498 0.2466 2.534
Bottom (4 s–6 s) 8.9498 1.0193 7.9305 3.4144 0.1342 2.957
2.3.2. Rectangular Nozzle
Nozzle in the Middle of the Pipe
WaterWater 2017, 9, 927 2017,9, 927 10 of 2510 of 25
(a) (b)
(c) (d)
Figure 12. Pressure fluctuation of No. 1 sensing point (rectangular nozzle in the middle of the pipe): (a) air inflow time is 3 s; (b) air inflow time is 4 s; (c) air inflow time is 5 s; and (d) air inflow time is 6 s.
Figure 13. The four best pressure values (rectangular nozzle in the middle of the pipe).
The best frequency is not clear after air inflow is cut off for 6 s through the comparison of the four best frequencies (Figure 13). Therefore, four cycles of pressure data are selected to perform the statistical analysis in every operating condition to help find the best frequency (Table 5).
Figure 12.Pressure fluctuation of No. 1 sensing point (rectangular nozzle in the middle of the pipe): (a) air inflow time is 3 s; (b) air inflow time is 4 s; (c) air inflow time is 5 s; and (d) air inflow time is 6 s.
Water 2017, 9, 927 10 of 25
(a) (b)
(c) (d)
Figure 12. Pressure fluctuation of No. 1 sensing point (rectangular nozzle in the middle of the pipe): (a) air inflow time is 3 s; (b) air inflow time is 4 s; (c) air inflow time is 5 s; and (d) air inflow time is 6 s.
Figure 13. The four best pressure values (rectangular nozzle in the middle of the pipe).
The best frequency is not clear after air inflow is cut off for 6 s through the comparison of the four best frequencies (Figure 13). Therefore, four cycles of pressure data are selected to perform the statistical analysis in every operating condition to help find the best frequency (Table 5).
Figure 13.The four best pressure values (rectangular nozzle in the middle of the pipe).
Water2017,9, 927 11 of 25
Table 5. Pressure values and statistical analysis after air inflow has been cut off for 6 s (rectangular nozzle in the middle of the pipe).
Frequency
Parameter Average Peak Average Minimum Variation Average Peak Value
Value (m) Value (m) Range (m) Value (m) Deviation
3 s–6 s 8.3926 1.0700 7.3225 3.2356 0.3094
4 s–6 s 8.2113 1.0048 7.2065 3.3311 0.4025
5 s–6 s 8.3588 0.8404 7.5184 3.4978 0.2635
6 s–6 s 8.4591 0.8235 7.6356 3.6207 0.1342
Figure14shows the average flow velocity of the water flow in the pipe by applying the above flushing conditions.
Water 2017, 9, 927 11 of 25
Table 5. Pressure values and statistical analysis after air inflow has been cut off for 6 s (rectangular nozzle in the middle of the pipe).
Parameter Frequency
Average Peak Value (m)
Average Minimum Value (m)
Variation Range (m)
Average Value (m)
Peak Value Deviation
3 s–6 s 8.3926 1.0700 7.3225 3.2356 0.3094
4 s–6 s 8.2113 1.0048 7.2065 3.3311 0.4025
5 s–6 s 8.3588 0.8404 7.5184 3.4978 0.2635
6 s–6 s 8.4591 0.8235 7.6356 3.6207 0.1342
Figure 14 shows the average flow velocity of the water flow in the pipe by applying the above flushing conditions.
Figure 14. Flow velocity comparison of all the frequencies when the rectangular nozzle is in the middle.
In Table 5 and Figure 14, the best frequency can be obtained as 6 s–6 s (rectangular nozzle in the middle of the pipe). The average water flow velocity reaches 2.447 m/s in the pipe at the frequency 6 s–6 s, and the average peak pressure value and the fluctuation range reach maximum simultaneously.
Nozzle on Top of the Pipe
Figure 15 shows that the static pressure peak value on top of the internal pipe wall increases with the increase of the air inflow cut off time. The maximum average peak pressure comes after air inflow is cut off for 6 s by setting air inflow time invariant. When the frequency is 3 s–6 s, 4 s–6 s, 5 s– 6 s and 6 s–6 s, the average peak pressure is 8.32 m, 8.13 m, 8.45 m and 7.81 m, respectively. Figure 16 shows the pressure comparison of the four best frequencies. When air cut off duration is 6 s, few differences are caused by pulse frequency when applying different air inflow time. When the frequency is 5 s–6 s, the peak pressure value reaches maximum, which is 8.45 m (rectangular nozzle on top of the pipe).
(a) (b)
Figure 14.Flow velocity comparison of all the frequencies when the rectangular nozzle is in the middle.
In Table5and Figure14, the best frequency can be obtained as 6 s–6 s (rectangular nozzle in the middle of the pipe). The average water flow velocity reaches 2.447 m/s in the pipe at the frequency 6 s–6 s, and the average peak pressure value and the fluctuation range reach maximum simultaneously.
Nozzle on Top of the Pipe
Figure15shows that the static pressure peak value on top of the internal pipe wall increases with the increase of the air inflow cut off time. The maximum average peak pressure comes after air inflow is cut off for 6 s by setting air inflow time invariant. When the frequency is 3 s–6 s, 4 s–6 s, 5 s–6 s and 6 s–6 s, the average peak pressure is 8.32 m, 8.13 m, 8.45 m and 7.81 m, respectively. Figure16shows the pressure comparison of the four best frequencies. When air cut off duration is 6 s, few differences are caused by pulse frequency when applying different air inflow time. When the frequency is 5 s–6 s, the peak pressure value reaches maximum, which is 8.45 m (rectangular nozzle on top of the pipe).
Water 2017, 9, 927 11 of 25
Table 5. Pressure values and statistical analysis after air inflow has been cut off for 6 s (rectangular nozzle in the middle of the pipe).
Parameter Frequency
Average Peak Value (m)
Average Minimum Value (m)
Variation Range (m)
Average Value (m)
Peak Value Deviation
3 s–6 s 8.3926 1.0700 7.3225 3.2356 0.3094
4 s–6 s 8.2113 1.0048 7.2065 3.3311 0.4025
5 s–6 s 8.3588 0.8404 7.5184 3.4978 0.2635
6 s–6 s 8.4591 0.8235 7.6356 3.6207 0.1342
Figure 14 shows the average flow velocity of the water flow in the pipe by applying the above flushing conditions.
Figure 14. Flow velocity comparison of all the frequencies when the rectangular nozzle is in the middle.
In Table 5 and Figure 14, the best frequency can be obtained as 6 s–6 s (rectangular nozzle in the middle of the pipe). The average water flow velocity reaches 2.447 m/s in the pipe at the frequency 6 s–6 s, and the average peak pressure value and the fluctuation range reach maximum simultaneously.
Nozzle on Top of the Pipe
Figure 15 shows that the static pressure peak value on top of the internal pipe wall increases with the increase of the air inflow cut off time. The maximum average peak pressure comes after air inflow is cut off for 6 s by setting air inflow time invariant. When the frequency is 3 s–6 s, 4 s–6 s, 5 s– 6 s and 6 s–6 s, the average peak pressure is 8.32 m, 8.13 m, 8.45 m and 7.81 m, respectively. Figure 16 shows the pressure comparison of the four best frequencies. When air cut off duration is 6 s, few differences are caused by pulse frequency when applying different air inflow time. When the frequency is 5 s–6 s, the peak pressure value reaches maximum, which is 8.45 m (rectangular nozzle on top of the pipe).
(a) (b)
Water2017Water,9, 927 2017, 9, 927 12 of 25 12 of 25
(c) (d)
Figure 15. Pressure fluctuation of No. 1 sensing point (rectangular nozzle on top of the pipe): (a) air inflow time is 3 s; (b) air inflow time is 4 s; (c) air inflow time is 5 s; and (d) air inflow time is 6 s.
Figure 16. The four best pressure values (rectangular nozzle on top of the pipe).
The best frequency is not clear after air inflow is cut off for 6 s through the comparison of the four best frequencies (Figure 16). Therefore, four cycles of pressure data are selected to perform the statistical analysis in every operating condition to help find the best frequency (Table 6).
Table 6. Pressure values and statistical analysis after air inflow has been cut off for 6 s (rectangular nozzle on top of the pipe).
Parameter Frequency
Average Peak Value (m)
Average Minimum Value (m)
Variation Range (m)
Average Value (m)
Peak Value Deviation
3 s–6 s 8.2548 0.9625 7.2923 3.2449 0.0955
4 s–6 s 8.1376 1.0338 7.1038 3.3550 0.1227
5 s–6 s 8.6996 0.9879 7.7118 3.4960 0.4364
6 s–6 s 7.9079 0.7558 7.1521 3.6445 0.1118
Figure 17 shows the average flow velocity of the water flow in the pipe by applying the above flushing conditions.
Figure 15.Pressure fluctuation of No. 1 sensing point (rectangular nozzle on top of the pipe): (a) air inflow time is 3 s; (b) air inflow time is 4 s; (c) air inflow time is 5 s; and (d) air inflow time is 6 s.
Water 2017, 9, 927 12 of 25
(c) (d)
Figure 15. Pressure fluctuation of No. 1 sensing point (rectangular nozzle on top of the pipe): (a) air inflow time is 3 s; (b) air inflow time is 4 s; (c) air inflow time is 5 s; and (d) air inflow time is 6 s.
Figure 16. The four best pressure values (rectangular nozzle on top of the pipe).
The best frequency is not clear after air inflow is cut off for 6 s through the comparison of the four best frequencies (Figure 16). Therefore, four cycles of pressure data are selected to perform the statistical analysis in every operating condition to help find the best frequency (Table 6).
Table 6. Pressure values and statistical analysis after air inflow has been cut off for 6 s (rectangular nozzle on top of the pipe).
Parameter Frequency
Average Peak Value (m)
Average Minimum Value (m)
Variation Range (m)
Average Value (m)
Peak Value Deviation
3 s–6 s 8.2548 0.9625 7.2923 3.2449 0.0955
4 s–6 s 8.1376 1.0338 7.1038 3.3550 0.1227
5 s–6 s 8.6996 0.9879 7.7118 3.4960 0.4364
6 s–6 s 7.9079 0.7558 7.1521 3.6445 0.1118
Figure 17 shows the average flow velocity of the water flow in the pipe by applying the above flushing conditions.
Figure 16.The four best pressure values (rectangular nozzle on top of the pipe).
The best frequency is not clear after air inflow is cut off for 6 s through the comparison of the four best frequencies (Figure16). Therefore, four cycles of pressure data are selected to perform the statistical analysis in every operating condition to help find the best frequency (Table6).
Table 6. Pressure values and statistical analysis after air inflow has been cut off for 6 s (rectangular nozzle on top of the pipe).
Frequency
Parameter Average Peak Average Minimum Variation Average Peak Value
Value (m) Value (m) Range (m) Value (m) Deviation
3 s–6 s 8.2548 0.9625 7.2923 3.2449 0.0955
4 s–6 s 8.1376 1.0338 7.1038 3.3550 0.1227
5 s–6 s 8.6996 0.9879 7.7118 3.4960 0.4364
6 s–6 s 7.9079 0.7558 7.1521 3.6445 0.1118
Water2017,9, 927 13 of 25
Water 2017, 9, 927 13 of 25
Figure 17. Flow velocity comparison of all the frequencies (rectangular nozzle on top of the pipe).
In Table 6 and Figure 17, the best frequency can be obtained as 5 s–6 s (rectangular nozzle on top of the pipe). The average water flow velocity reaches 2.314 m/s in the pipe at the frequency 5 s–6 s, and the average peak pressure value and the fluctuation range reach maximum simultaneously.
Nozzle at the Bottom of the Pipe
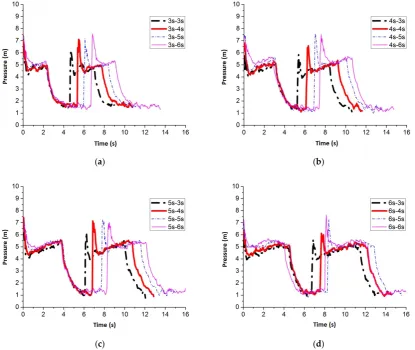
Figure 18 shows the maximum average peak pressure comes after air inflow is cut off for 6 s by setting the air inflow time invariant. When the frequency is 3 s–6 s, 4 s–6 s, 5 s–6 s and 6 s–6 s, the average peak pressure is 8.32 m, 8.21 m, 7.83 m and 8.03 m, respectively. Figure 19 shows the pressure comparison of the four best frequencies. When air cut off duration is 6 s, few differences are caused by pulse frequency when different air inflow time is applied. When the frequency is 3 s–6 s, the peak pressure reaches maximum, which is 8.32 m (rectangular nozzle at the bottom of the pipe).
(a) (b)
(c) (d)
Figure 18. Pressure fluctuation of No. 1 sensing point (rectangular nozzle at the bottom of the pipe): (a) air inflow time is 3 s; (b) air inflow time is 4 s; (c) air inflow time is 5 s; and (d) air inflow time is 6 s.
Figure 17.Flow velocity comparison of all the frequencies (rectangular nozzle on top of the pipe).
In Table6and Figure17, the best frequency can be obtained as 5 s–6 s (rectangular nozzle on top of the pipe). The average water flow velocity reaches 2.314 m/s in the pipe at the frequency 5 s–6 s, and the average peak pressure value and the fluctuation range reach maximum simultaneously.
Nozzle at the Bottom of the Pipe
Figure18shows the maximum average peak pressure comes after air inflow is cut off for 6 s by setting the air inflow time invariant. When the frequency is 3 s–6 s, 4 s–6 s, 5 s–6 s and 6 s–6 s, the average peak pressure is 8.32 m, 8.21 m, 7.83 m and 8.03 m, respectively. Figure19shows the pressure comparison of the four best frequencies. When air cut off duration is 6 s, few differences are caused by pulse frequency when different air inflow time is applied. When the frequency is 3 s–6 s, the peak pressure reaches maximum, which is 8.32 m (rectangular nozzle at the bottom of the pipe).
Water 2017, 9, 927 13 of 25
Figure 17. Flow velocity comparison of all the frequencies (rectangular nozzle on top of the pipe).
In Table 6 and Figure 17, the best frequency can be obtained as 5 s–6 s (rectangular nozzle on top of the pipe). The average water flow velocity reaches 2.314 m/s in the pipe at the frequency 5 s–6 s, and the average peak pressure value and the fluctuation range reach maximum simultaneously.
Nozzle at the Bottom of the Pipe
Figure 18 shows the maximum average peak pressure comes after air inflow is cut off for 6 s by setting the air inflow time invariant. When the frequency is 3 s–6 s, 4 s–6 s, 5 s–6 s and 6 s–6 s, the average peak pressure is 8.32 m, 8.21 m, 7.83 m and 8.03 m, respectively. Figure 19 shows the pressure comparison of the four best frequencies. When air cut off duration is 6 s, few differences are caused by pulse frequency when different air inflow time is applied. When the frequency is 3 s–6 s, the peak pressure reaches maximum, which is 8.32 m (rectangular nozzle at the bottom of the pipe).
(a) (b)
(c) (d)
Figure 18. Pressure fluctuation of No. 1 sensing point (rectangular nozzle at the bottom of the pipe): (a) air inflow time is 3 s; (b) air inflow time is 4 s; (c) air inflow time is 5 s; and (d) air inflow time is 6 s.
Water2017,9, 927 14 of 25
Water 2017, 9, 927 14 of 25
Figure 19. The four best pressure values (rectangular nozzle at the bottom of the pipe).
The best frequency is not clear after air inflow is cut off for 6 s through the comparison of the four best frequencies (Figure 19). Therefore, four cycles of pressure data are selected to perform the statistical analysis in every operating condition to help to find the best frequency (Table 7).
Table 7. Pressure values and analysis after air inflow has been cut off for 6 s (rectangular nozzle at the bottom of the pipe).
Parameter Frequency
Average Peak Value (m)
Average Minimum Value (m)
Variation Range (m)
Average Value (m)
Peak Value Deviation
3 s–6 s 8.5594 1.0833 7.4761 3.2360 0.1221
4 s–6 s 8.1811 1.0471 7.1340 3.3390 0.1269
5 s–6 s 7.9973 0.9794 7.0179 3.4948 0.2000
6 s–6 s 8.0312 0.8706 7.1606 3.6354 0.1027
Figure 20 shows the average flow velocity of the water flow in the pipe by applying the above flushing conditions.
Figure 20. Flow velocity comparison of all the frequencies (rectangular nozzle at the bottom of the pipe).
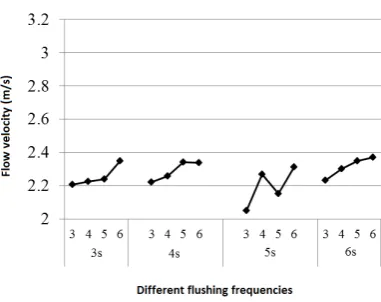
In Table 7 and Figure 20, the average peak pressure value and the fluctuation range of No. 1 sensing point reach maximum simultaneously at the frequency 3 s–6 s (rectangular nozzle at the bottom of the pipe). However, the average water flow velocity is low, which is 2.154 m/s in the pipe at the frequency 3 s–6 s. Therefore, 6 s–6 s is considered as the best frequency, and at this frequency the flow velocity in the pipe is 2.912 m/s.
Comparison of Nozzle Locations
At the best flushing frequencies, setting different nozzle locations, the fluctuation ranges and the flow velocity of No. 1 sensing point are compared and given in Table 8. Setting the rectangular nozzle at the bottom of the pipe, the average flow velocity reaches maximum, and the peak pressure value
Figure 19.The four best pressure values (rectangular nozzle at the bottom of the pipe).
The best frequency is not clear after air inflow is cut off for 6 s through the comparison of the four best frequencies (Figure19). Therefore, four cycles of pressure data are selected to perform the statistical analysis in every operating condition to help to find the best frequency (Table7).
Table 7.Pressure values and analysis after air inflow has been cut off for 6 s (rectangular nozzle at the bottom of the pipe).
Frequency
Parameter Average Peak Average Minimum Variation Average Peak Value
Value (m) Value (m) Range (m) Value (m) Deviation
3 s–6 s 8.5594 1.0833 7.4761 3.2360 0.1221
4 s–6 s 8.1811 1.0471 7.1340 3.3390 0.1269
5 s–6 s 7.9973 0.9794 7.0179 3.4948 0.2000
6 s–6 s 8.0312 0.8706 7.1606 3.6354 0.1027
Figure20shows the average flow velocity of the water flow in the pipe by applying the above flushing conditions.
Water 2017, 9, 927 14 of 25
Figure 19. The four best pressure values (rectangular nozzle at the bottom of the pipe).
The best frequency is not clear after air inflow is cut off for 6 s through the comparison of the four best frequencies (Figure 19). Therefore, four cycles of pressure data are selected to perform the statistical analysis in every operating condition to help to find the best frequency (Table 7).
Table 7. Pressure values and analysis after air inflow has been cut off for 6 s (rectangular nozzle at the bottom of the pipe).
Parameter Frequency
Average Peak Value (m)
Average Minimum Value (m)
Variation Range (m)
Average Value (m)
Peak Value Deviation
3 s–6 s 8.5594 1.0833 7.4761 3.2360 0.1221
4 s–6 s 8.1811 1.0471 7.1340 3.3390 0.1269
5 s–6 s 7.9973 0.9794 7.0179 3.4948 0.2000
6 s–6 s 8.0312 0.8706 7.1606 3.6354 0.1027
Figure 20 shows the average flow velocity of the water flow in the pipe by applying the above flushing conditions.
Figure 20. Flow velocity comparison of all the frequencies (rectangular nozzle at the bottom of the pipe).
In Table 7 and Figure 20, the average peak pressure value and the fluctuation range of No. 1 sensing point reach maximum simultaneously at the frequency 3 s–6 s (rectangular nozzle at the bottom of the pipe). However, the average water flow velocity is low, which is 2.154 m/s in the pipe at the frequency 3 s–6 s. Therefore, 6 s–6 s is considered as the best frequency, and at this frequency the flow velocity in the pipe is 2.912 m/s.
Comparison of Nozzle Locations
At the best flushing frequencies, setting different nozzle locations, the fluctuation ranges and the flow velocity of No. 1 sensing point are compared and given in Table 8. Setting the rectangular nozzle at the bottom of the pipe, the average flow velocity reaches maximum, and the peak pressure value Figure 20.Flow velocity comparison of all the frequencies (rectangular nozzle at the bottom of the pipe).
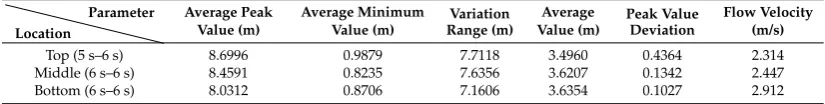
In Table7and Figure20, the average peak pressure value and the fluctuation range of No. 1 sensing point reach maximum simultaneously at the frequency 3 s–6 s (rectangular nozzle at the bottom of the pipe). However, the average water flow velocity is low, which is 2.154 m/s in the pipe at the frequency 3 s–6 s. Therefore, 6 s–6 s is considered as the best frequency, and at this frequency the flow velocity in the pipe is 2.912 m/s.
Comparison of Nozzle Locations
Water2017,9, 927 15 of 25
deviation reaches minimum. However, setting the rectangular nozzle in the middle or on top of the pipe, the peak pressure value and the fluctuation range are high, as well as the deviation, especially the variance of the average peak pressure value reaches 0.4364 when the rectangular nozzle is set on top of the pipe. The above results indicate that the flow velocity and pressure fluctuation range are high and steady when the rectangular nozzle is set in the middle of the pipe. The best frequencies for pipe flushing are between 5 s–6 s and 6 s–6 s. The best air inflow frequency not only ensures enough air inflow amount for keeping the ejection flow flushing, but also avoids the negative effects on the flushing results by over air inflow amount. Similarly, in summary, two-phase (gas and water) high energy flushing effect on the internal pipe wall can be secured at the best air inflow frequencies.
Table 8.Flushing results by setting rectangular nozzle at different locations.
Location
Parameter Average Peak Average Minimum Variation Average Peak Value Flow Velocity
Value (m) Value (m) Range (m) Value (m) Deviation (m/s)
Top (5 s–6 s) 8.6996 0.9879 7.7118 3.4960 0.4364 2.314
Middle (6 s–6 s) 8.4591 0.8235 7.6356 3.6207 0.1342 2.447
Bottom (6 s–6 s) 8.0312 0.8706 7.1606 3.6354 0.1027 2.912
2.3.3. Slot Nozzle
Nozzle in the Middle of the Pipe
Figure21shows the maximum average peak pressure comes after air inflow is cut off for 6 s by setting the air inflow time invariant. When the frequency is 3 s–6 s, 4 s–6 s, 5 s–6 s and 6 s–6 s, the average peak pressure value is 7.68 m, 7.81 m, 7.52 m and 7.34 m, respectively. Figure22shows the pressure comparison of the four best frequencies. When air cut off duration is 6 s, few differences are caused by pulse frequency when different air inflow time is applied. At the frequency 4 s–6 s, the peak pressure reaches maximum, which is 7.81 m, by setting the slot nozzle in the middle of the pipe.
Water 2017, 9, 927 15 of 25
deviation reaches minimum. However, setting the rectangular nozzle in the middle or on top of the pipe, the peak pressure value and the fluctuation range are high, as well as the deviation, especially the variance of the average peak pressure value reaches 0.4364 when the rectangular nozzle is set on top of the pipe. The above results indicate that the flow velocity and pressure fluctuation range are high and steady when the rectangular nozzle is set in the middle of the pipe. The best frequencies for pipe flushing are between 5 s–6 s and 6 s–6 s. The best air inflow frequency not only ensures enough air inflow amount for keeping the ejection flow flushing, but also avoids the negative effects on the flushing results by over air inflow amount. Similarly, in summary, two-phase (gas and water) high energy flushing effect on the internal pipe wall can be secured at the best air inflow frequencies.
Table 8. Flushing results by setting rectangular nozzle at different locations.
Parameter Location
Average Peak Value (m)
Average Minimum Value (m)
Variation Range (m)
Average Value (m)
Peak Value Deviation
Flow Velocity (m/s)
Top (5 s–6 s) 8.6996 0.9879 7.7118 3.4960 0.4364 2.314
Middle (6 s–6 s) 8.4591 0.8235 7.6356 3.6207 0.1342 2.447
Bottom (6 s–6 s) 8.0312 0.8706 7.1606 3.6354 0.1027 2.912
2.3.3. Slot Nozzle
Nozzle in the Middle of the Pipe
Figure 21 shows the maximum average peak pressure comes after air inflow is cut off for 6 s by setting the air inflow time invariant. When the frequency is 3 s–6 s, 4 s–6 s, 5 s–6 s and 6 s–6 s, the average peak pressure value is 7.68 m, 7.81 m, 7.52 m and 7.34 m, respectively. Figure 22 shows the pressure comparison of the four best frequencies. When air cut off duration is 6 s, few differences are caused by pulse frequency when different air inflow time is applied. At the frequency 4 s–6 s, the peak pressure reaches maximum, which is 7.81 m, by setting the slot nozzle in the middle of the pipe.
(a) (b)
(c) (d)
Figure 21. Pressure fluctuation of No. 1 sensing point when slot nozzle is set in the middle of the pipe (a) air inflow time is 3 s; (b) air inflow time is 4 s; (c) air inflow time is 5 s; and (d) air inflow time is 6 s.
Water2017,9, 927 16 of 25
Water 2017, 9, 927 16 of 25
Figure 22. The four best pressure values when the slot nozzle is set in the middle of the pipe.
The best frequency is not clear after air inflow is cut off for 6 s through the comparison of the four best frequencies in Figure 22. Therefore, four cycles of pressure data are selected to perform the statistical analysis in every operating condition to help find the best frequency. The results are given in Table 9.
Table 9. Pressure values and statistical analysis after air inflow has been cut off for 6 s when the slot nozzle is set in the middle of the pipe.
Parameter Frequency
Average Peak Value (m)
Average Minimum Value (m)
Variation Range (m)
Average Value (m)
Peak Value Deviation
3 s–6 s 7.6226 1.0362 6.5864 3.1815 0.0610
4 s–6 s 7.7085 0.9806 6.7278 3.3761 0.1064
5 s–6 s 7.5513 0.9492 6.6021 3.4420 0.0604
6 s–6 s 7.6311 0.8356 6.7955 3.5916 0.1245
Figure 23 shows the average flow velocity of the water flow in the pipe by applying the above flushing conditions.
Figure 23. Flow velocity comparison of all the frequencies when the slot nozzle is set in the middle of the pipe.
In Table 9 and Figure 23, the pressure fluctuation range of No. 1 sensing point reaches maximum at the frequency 6 s–6 s when the slot nozzle is set in the middle of the pipe. The average water flow velocity reaches a high value which is 2.928 m/s in the pipe at the frequency 6 s–6 s. Therefore, 6 s–6 s is considered as the best frequency.
Figure 22.The four best pressure values when the slot nozzle is set in the middle of the pipe.
The best frequency is not clear after air inflow is cut off for 6 s through the comparison of the four best frequencies in Figure22. Therefore, four cycles of pressure data are selected to perform the statistical analysis in every operating condition to help find the best frequency. The results are given in Table9.
Table 9.Pressure values and statistical analysis after air inflow has been cut off for 6 s when the slot nozzle is set in the middle of the pipe.
Frequency
Parameter Average Peak Average Minimum Variation Average Peak Value
Value (m) Value (m) Range (m) Value (m) Deviation
3 s–6 s 7.6226 1.0362 6.5864 3.1815 0.0610
4 s–6 s 7.7085 0.9806 6.7278 3.3761 0.1064
5 s–6 s 7.5513 0.9492 6.6021 3.4420 0.0604
6 s–6 s 7.6311 0.8356 6.7955 3.5916 0.1245
Figure23shows the average flow velocity of the water flow in the pipe by applying the above flushing conditions.
Water 2017, 9, 927 16 of 25
Figure 22. The four best pressure values when the slot nozzle is set in the middle of the pipe.
The best frequency is not clear after air inflow is cut off for 6 s through the comparison of the four best frequencies in Figure 22. Therefore, four cycles of pressure data are selected to perform the statistical analysis in every operating condition to help find the best frequency. The results are given in Table 9.
Table 9. Pressure values and statistical analysis after air inflow has been cut off for 6 s when the slot nozzle is set in the middle of the pipe.
Parameter Frequency
Average Peak Value (m)
Average Minimum Value (m)
Variation Range (m)
Average Value (m)
Peak Value Deviation
3 s–6 s 7.6226 1.0362 6.5864 3.1815 0.0610
4 s–6 s 7.7085 0.9806 6.7278 3.3761 0.1064
5 s–6 s 7.5513 0.9492 6.6021 3.4420 0.0604
6 s–6 s 7.6311 0.8356 6.7955 3.5916 0.1245
Figure 23 shows the average flow velocity of the water flow in the pipe by applying the above flushing conditions.
Figure 23. Flow velocity comparison of all the frequencies when the slot nozzle is set in the middle of the pipe.
In Table 9 and Figure 23, the pressure fluctuation range of No. 1 sensing point reaches maximum at the frequency 6 s–6 s when the slot nozzle is set in the middle of the pipe. The average water flow velocity reaches a high value which is 2.928 m/s in the pipe at the frequency 6 s–6 s. Therefore, 6 s–6 s is considered as the best frequency.
Figure 23.Flow velocity comparison of all the frequencies when the slot nozzle is set in the middle of the pipe.
Water2017,9, 927 17 of 25
Nozzle on Top of the Pipe
Figure24shows the maximum average peak pressure comes after air inflow is cut off for 6 s by setting the air inflow time invariant. When the frequency is 3 s–6 s, 4 s–6 s, 5 s–6 s and 6 s–6 s, the average peak pressure is 7.51 m, 7.44 m, 6.99 m and 7.47 m, respectively. Figure25shows the pressure comparison of the four best frequencies. When air cut off duration is 6 s, few differences are caused by pulse frequency by applying different air inflow time. When the frequency is 3 s–6 s, the peak pressure reaches maximum, which is 7.51 m, when the slot nozzle is set on top of the pipe.
Water 2017, 9, 927 17 of 25
Nozzle on Top of the Pipe
Figure 24 shows the maximum average peak pressure comes after air inflow is cut off for 6 s by setting the air inflow time invariant. When the frequency is 3 s–6 s, 4 s–6 s, 5 s–6 s and 6 s–6 s, the average peak pressure is 7.51 m, 7.44 m, 6.99 m and 7.47 m, respectively. Figure 25 shows the pressure comparison of the four best frequencies. When air cut off duration is 6 s, few differences are caused by pulse frequency by applying different air inflow time. When the frequency is 3 s–6 s, the peak pressure reaches maximum, which is 7.51 m, when the slot nozzle is set on top of the pipe.
(a) (b)
(c) (d)
Figure 24. Pressure fluctuation of No. 1 sensing point when the slot nozzle is set on top of the pipe (a) air inflow time is 3 s; (b) air inflow time is 4 s; (c) air inflow time is 5 s; and (d) air inflow time is 6 s.
Figure 25. The four best pressure values when the slot nozzle is set on top of the pipe. Figure 24.Pressure fluctuation of No. 1 sensing point when the slot nozzle is set on top of the pipe (a) air inflow time is 3 s; (b) air inflow time is 4 s; (c) air inflow time is 5 s; and (d) air inflow time is 6 s.
Water 2017, 9, 927 17 of 25
Nozzle on Top of the Pipe
Figure 24 shows the maximum average peak pressure comes after air inflow is cut off for 6 s by setting the air inflow time invariant. When the frequency is 3 s–6 s, 4 s–6 s, 5 s–6 s and 6 s–6 s, the average peak pressure is 7.51 m, 7.44 m, 6.99 m and 7.47 m, respectively. Figure 25 shows the pressure comparison of the four best frequencies. When air cut off duration is 6 s, few differences are caused by pulse frequency by applying different air inflow time. When the frequency is 3 s–6 s, the peak pressure reaches maximum, which is 7.51 m, when the slot nozzle is set on top of the pipe.
(a) (b)
(c) (d)
Figure 24. Pressure fluctuation of No. 1 sensing point when the slot nozzle is set on top of the pipe (a) air inflow time is 3 s; (b) air inflow time is 4 s; (c) air inflow time is 5 s; and (d) air inflow time is 6 s.
Figure 25. The four best pressure values when the slot nozzle is set on top of the pipe.
Water2017,9, 927 18 of 25
The best frequency is not clear after air inflow is cut off for 6 s through the comparison of the four best frequencies in Figure25. Therefore, four cycles of pressure data are selected to perform the statistical analysis in every operating condition to help find the best frequency. The results are given in Table10.
Table 10.Pressure values and statistical analysis after air inflow has been cut off for 6 s when the slot nozzle is set on top of the pipe.
Frequency
Parameter Average Peak Average Minimum Variation Average Peak Value
Value (m) Value (m) Range (m) Value (m) Deviation
3 s–6 s 7.7121 1.3021 6.4100 3.1782 0.3137
4 s–6 s 7.8184 0.9842 6.8342 3.3658 0.3693
5 s–6 s 7.2866 0.9516 6.3350 3.4161 0.1366
6 s–6 s 7.3132 0.9516 6.3616 3.5605 0.1650
Figure26shows the average flow velocity of the water flow in the pipe when the above flushing conditions are applied.
Water 2017, 9, 927 18 of 25
The best frequency is not clear after air inflow is cut off for 6 s through the comparison of the four best frequencies in Figure 25. Therefore, four cycles of pressure data are selected to perform the statistical analysis in every operating condition to help find the best frequency. The results are given in Table 10.
Table 10. Pressure values and statistical analysis after air inflow has been cut off for 6 s when the slot nozzle is set on top of the pipe.
Parameter Frequency
Average Peak Value (m)
Average Minimum Value (m)
Variation Range (m)
Average Value (m)
Peak Value Deviation
3 s–6 s 7.7121 1.3021 6.4100 3.1782 0.3137
4 s–6 s 7.8184 0.9842 6.8342 3.3658 0.3693
5 s–6 s 7.2866 0.9516 6.3350 3.4161 0.1366
6 s–6 s 7.3132 0.9516 6.3616 3.5605 0.1650
Figure 26 shows the average flow velocity of the water flow in the pipe when the above flushing conditions are applied.
Figure 26. Flow velocity comparison of all the frequencies when the slot nozzle is on top of the pipe.
In Table 10 and Figure 26, the peak pressure and the pressure fluctuation range of No. 1 sensing point reach maximum simultaneously at the frequency 4 s–6 s when the slot nozzle is set on top of the pipe. The average water flow velocity reaches a high value which is 2.928 m/s in the pipe at the frequency 4 s–6 s. Therefore, 4 s–6 s is considered as the best frequency.
Nozzle at the Bottom of the Pipe
Figure 27 shows the maximum average peak pressure comes after air inflow is cut off for 6 s by applying invariant air inflow time. When the frequency is 3 s–6 s, 4 s–6 s, 5 s–6 s and 6 s–6 s, the average peak pressure is 7.71 m, 7.99 m, 8.07 m and 7.72 m, respectively. Figure 28 shows the pressure comparison of the four best frequencies. When air cut off duration is 6 s, there are few differences caused by pulse frequency when different air inflow time is applied. When the frequency is 5 s–6 s, the peak pressure reaches maximum, which is 8.07 m, when the slot nozzle is set at the bottom of the pipe.
Figure 26.Flow velocity comparison of all the frequencies when the slot nozzle is on top of the pipe.
In Table10and Figure26, the peak pressure and the pressure fluctuation range of No. 1 sensing point reach maximum simultaneously at the frequency 4 s–6 s when the slot nozzle is set on top of the pipe. The average water flow velocity reaches a high value which is 2.928 m/s in the pipe at the frequency 4 s–6 s. Therefore, 4 s–6 s is considered as the best frequency.
Nozzle at the Bottom of the Pipe
WaterWater 2017, 9, 927 2017,9, 927 19 of 2519 of 25
(a) (b)
(c) (d)
Figure 27. Pressure fluctuation of No. 1 sensing point when slot nozzle is set at the bottom of the pipe (a) air inflow time is 3 s; (b) air inflow time is 4 s; (c) air inflow time is 5 s; and (d) air inflow time is 6 s.
Figure 28. The four best pressure values when the slot nozzle is set at the bottom of the pipe.
The best frequency is not clear after air inflow is cut off for 6 s through the comparison of the four best frequencies in Figure 28. Therefore, four cycles of pressure data are selected to perform the statistical analysis in every operating condition to help find the best frequency. The results are given in Table 11.
Figure 27.Pressure fluctuation of No. 1 sensing point when slot nozzle is set at the bottom of the pipe (a) air inflow time is 3 s; (b) air inflow time is 4 s; (c) air inflow time is 5 s; and (d) air inflow time is 6 s.
Water 2017, 9, 927 19 of 25
(a) (b)
(c) (d)
Figure 27. Pressure fluctuation of No. 1 sensing point when slot nozzle is set at the bottom of the pipe (a) air inflow time is 3 s; (b) air inflow time is 4 s; (c) air inflow time is 5 s; and (d) air inflow time is 6 s.
Figure 28. The four best pressure values when the slot nozzle is set at the bottom of the pipe.
The best frequency is not clear after air inflow is cut off for 6 s through the comparison of the four best frequencies in Figure 28. Therefore, four cycles of pressure data are selected to perform the statistical analysis in every operating condition to help find the best frequency. The results are given in Table 11.
Figure 28.The four best pressure values when the slot nozzle is set at the bottom of the pipe.