Patron: Her Majesty The Queen Rothamsted Research Harpenden, Herts, AL5 2JQ Telephone: +44 (0)1582 763133 Web: http://www.rothamsted.ac.uk/
Rothamsted Research is a Company Limited by Guarantee Registered Office: as above. Registered in England No. 2393175.
Rothamsted Repository Download
A - Papers appearing in refereed journals
Watson, A., Hickey, L. T., Christopher, J., Rutkoski, J., Poland, J. and
Hayes, B. J. 2019. Multivariate Genomic Selection and Potential of Rapid
Indirect Selection with Speed Breeding in Spring Wheat. Crop Science.
59 (5), pp. 1945-1959.
The publisher's version can be accessed at:
•
https://dx.doi.org/10.2135/cropsci2018.12.0757
The output can be accessed at:
https://repository.rothamsted.ac.uk/item/96003/multivariate-genomic-selection-and-potential-of-rapid-indirect-selection-with-speed-breeding-in-spring-wheat
.
© 15 August 2019, Please contact [email protected] for copyright queries.
RESEARCH
G
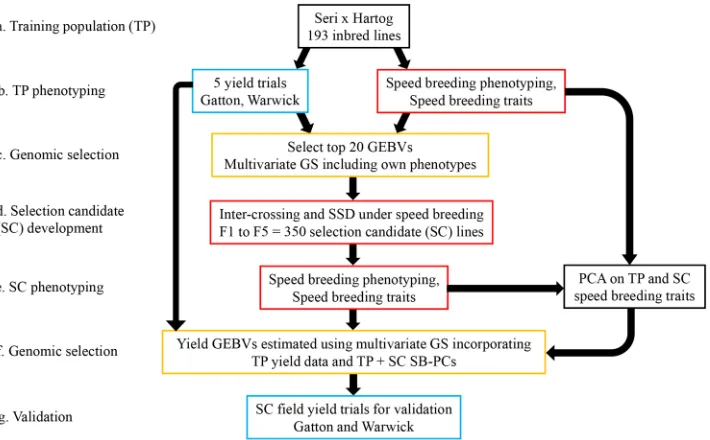
enomic selection (GS) can be used to increase the rate of genetic gain in plant breeding programs, principally through a shorter breeding cycle and enabling screening of larger population sizes (Lorenzana and Bernardo, 2009; Heffner et al., 2010). This is particularly useful for genetically complex traits, such as grain yield in wheat (Triticum aestivum L.), which is diffi-cult to select for using marker-assisted selection and is usually only measured after genetically fixed lines are developed and sufficient seed has been produced. The process of GS begins with phenotyping and genotyping a population, termed the training population (TP). A prediction equation for the trait of interest is derived using the phenotypic and genotypic information from the TP. The prediction equation is then applied to the selec-tion candidate (SC) populaselec-tion, also genotyped, to calculate the genomic estimated breeding values (GEBVs) on which selection is then based (Meuwissen et al., 2001; reviewed by Heslot et al.,Multivariate Genomic Selection and Potential
of Rapid Indirect Selection with Speed Breeding
in Spring Wheat
Amy Watson,* Lee T. Hickey, Jack Christopher, Jessica Rutkoski, Jesse Poland, and Ben J. Hayes
ABSTRACT
Genomic selection (GS) can be effective in breeding for quantitative traits, such as yield, by reducing the selection cycle duration. Speed breeding (SB) uses extended photoperiod and temperature control to enable rapid generation advancement. Together, GS and SB can syner-gistically reduce the breeding cycle by quickly producing recombinant inbred lines (RILs) and enabling indirect phenotypic selection to improve for key traits, such as height and flow-ering time, prior to field trials. In addition, traits measured under SB (SB traits) correlated with field-based yield could improve yield predic-tion in multivariate GS. A 193-line spring wheat (Triticum aestivum L.) training population (TP), tested for grain yield in the field in multiple envi-ronments, was used to predict grain yield of a 350-line selection candidate (SC) population, across multiple environments. Four SB traits measured on the TP and SC populations were used to derive principal components, which were incorporated into multivariate GS models. Predictive ability was significantly increased by multivariate GS, in some cases being twice as high as univariate GS. Based on these results, an efficient breeding strategy is proposed combining SB and multivariate GS using yield-correlated SB traits for yield prediction. The potential for early indirect SB phenotypic selec-tion for targeted populaselec-tion improvement prior to trials was also investigated. Plant height and flowering time showed strong relative predicted efficiency to indirect selection, in some cases as high as direct field selection. The higher selec-tion intensity and rate of generaselec-tion turnover under SB may enable a greater rate of genetic gain than direct field phenotyping.
A. Watson, L.T. Hickey, and B.J. Hayes, Queensland Alliance for Agriculture and Food Innovation, Univ. of Queensland, St Lucia, Brisbane, QLD 4072, Australia; A. Watson, current address, Rothamsted Research, Plant Science, Harpenden, Hertfordshire, AL5 2JQ, UK; J. Christopher, Queensland Alliance for Agriculture and Food Innovation, Univ. of Queensland, Leslie Research Facility, Toowoomba, QLD 4350, Australia; J. Rutkoski, Dep. of Crop Sciences, Univ. of Illinois, Turner Hall, Urbana, IL 61801; J. Poland, Dep. of Plant Pathology, Kansas State Univ., Manhattan, KS 66506. Received 18 Dec. 2018. Accepted 2 June 2019. *Corresponding author ([email protected]). Assigned to Associate Editor Aaron Lorenz.
Abbreviations: BLUE, best linear unbiased estimator; DTA, days to anthesis; EBV, estimated breeding value; GBLUP, genomic best linear unbiased predictor; GEBV, genomic estimated breeding value; GS, genomic selection; PC, principal component; PCA, principal components analysis; SB, speed breeding; SC, selection candidate; SNP, single nucleotide polymorphism; SSD, single seed descent; TP, training population.
Published in Crop Sci. 59:1945–1959 (2019). doi: 10.2135/cropsci2018.12.0757
2015). Phenotyping of the SC population is not required prior to selection to decide the next generation of parents and/or potential varieties, thereby saving time. However, in practice, phenotyping will be valuable in subsequent generations to retrain the prediction model and maintain a TP that is closely related to the next cycle of SC lines (Sun et al., 2016; Neyhart et al., 2017; Brandariz and Bernardo, 2018; Tiede and Smith, 2018).
The higher the accuracy of GS, the greater the genetic gain when comparing breeding cycles of the same length. Multivariate GS, where traits correlated to the trait of interest (secondary traits) are included in the prediction model, can increase prediction accuracy (Pszczola et al., 2013; Rutkoski et al., 2016). However, there are two issues associated with the increased prediction accuracy observed in multivariate GS studies on cereal popula-tions. First, in practice, increased accuracy has only been observed when the secondary traits are measured on the SC population, as well as the TP (Calus and Veerkamp, 2011; Jia and Jannink, 2012; Guo et al., 2014; Rutkoski et al., 2016; Sun et al., 2017; Fernandes et al., 2018). Within a breeding program framework looking to predict grain yield, this would mean the loss of the reduction in breeding cycle duration, since it would first be neces-sary to grow and phenotype the SC lines in the field prior to selection. Second, most studies on multivariate GS have used cross-validation within environments to calculate GEBVs, which can result in overestimation of the accuracy since the TP and SC population have expe-rienced the same genotype ´ environment interactions (Lorenz et al., 2011).
Speed breeding (SB) is a method of rapid generation advance where plants can be grown in a temperature-controlled glasshouse under prolonged photoperiod to increase the rate of development (Watson et al., 2018). Healthy, adult spring wheat plants with morphology similar to that of plants grown under diurnal conditions can be obtained within 8 wk of sowing, which enables phenotyping of a range of traits that would require a whole season in the field to develop. Using SB, yield secondary traits could be rapidly phenotyped on the SC lines and incorporated into multivariate GS models with field-measured grain yield of the TP with the aim of increasing the prediction ability above that of a univariate GS. This would also provide an opportunity to couple rapid SC population development with phenotyping to demonstrate incorporation of SB within a GS program. Despite the SB conditions being an environment distinct from the field, some level of genetic correlations between traits measured during SB and traits phenotyped in the field may still be adequate. Watson et al. (2018) demonstrated that several traits, such as flowering and plant height, could be faith-fully phenotyped under SB conditions in a variety of crop species, including spring wheat. In addition, the controlled
conditions of the glasshouse may result in higher herita-bility of SB traits, which is also necessary for increased accuracy within multivariate models (Henderson and Quaas, 1976; Lorenzana and Bernardo, 2009; Daetwyler et al., 2010). Other simply measured traits that are likely to correlate to yield include spike length and flag leaf length. Spike length can be indicative of the number of grains developed on the rachis, and the flag leaf has long been described as an important source of photoassimi-lates during grain filling (Lupton, 1966). Recent studies have linked quantitative trait loci (QTL) associated with yield components to flag leaf morphology (Liu et al., 2017; Zhao et al., 2018).
Due to the complexity of grain yield, there are numerous related traits that have potential to be included in multivariate models. However, there are computa-tional constraints to including many variables in a single model, especially as secondary traits are often correlated not only with yield but also with each other. This can lead to overfitting of the model and increased probability of spurious errors (Sainani, 2014). Principal component analysis (PCA) is a method of data reduction of correlated variables, where predictors are condensed into a new set of uncorrelated variables (principal components [PCs]) with minimal loss of information (Abdi and Williams, 2010). These could be used within the prediction model instead of data for each distinct trait, a method of data dimension reduction that has been used in both plant (El-Dien et al., 2015) and animal (Bolormaa et al., 2010) breeding with positive results.
al. (2013) as either experiencing little or no water deficit during the growing season (no-deficit) or as experiencing significant water deficit around anthesis (anthesis-deficit). A summary of the location, year, and environment classification of the trials is provided in Table 1. All trials were phenotyped for grain yield, senescence indices, time to anthesis (DTA), plant height, and establishment. The same lines were also phenotyped for seminal root angle in gel-filled chambers, as previously reported (Chris-topher et al., 2013).
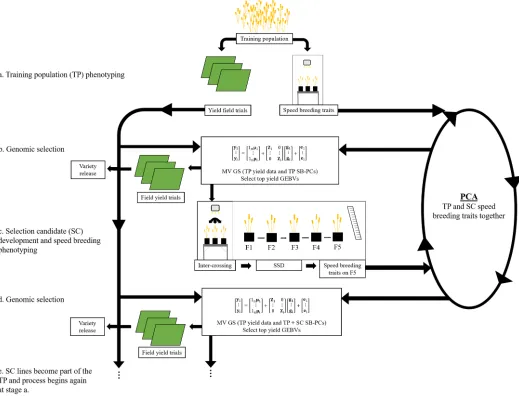
Selection Candidates
The SC population was created by selecting the 20 best lines from the TP, based on a selection index of GEBV for yield including own phenotypes and weighted for performance within an envi-ronment experiencing water deficit (Fig. 1c). Yield GEBVs from no-deficit environments were weighted a quarter of those from anthesis-deficit environments to assign more value to those lines producing higher yields in water-stressed conditions. Calcula-tion of GEBVs is detailed below. Intercrossing of parents and a subsequent single seed descent (SSD) breeding program were performed under SB conditions in a temperature-controlled glasshouse (Fig. 1d). General details of the SB method are provided in Watson et al. (2018). Photoperiod duration ranged from 22 h to constant light provided by high-pressure sodium vapor lamps (Philips SON-T 400W E E40 in Sylvan High Bay housing with a glass diffuser), in addition to natural light during the day. Shorter durations of diurnal lighting periods were occa-sionally implemented due to the needs of other activities within the glasshouse resulting in a slower generational turnover than would be expected if optimal SB conditions were consistently used. The temperature regime was 17/22°C using a 12-h cycle. The 20 selected parents were intercrossed using a half-diallel scheme and then inbred from F1 by SSD, whereby up to eight
After the development of a wheat breeding popula-tion under SB condipopula-tions, the objectives of this study were (i) to determine if grain yield prediction ability could be increased by including yield secondary traits, phenotyped under SB, in multivariate GS models, and (ii) to assess the potential of indirect phenotypic selection for plant height and days to anthesis (DTA) under SB for improvement of wheat populations prior to field trials. These objectives would help determine the efficacy of a breeding strategy combining these tools into an efficient method to increase genetic gain for yield in spring wheat.
MATERIALS AND METHODS
Training Population
The TP consisted of 193 lines of a spring wheat double-haploid population, derived from a cross between SeriM82 and Hartog (Fig. 1a). The population consisted of both F1– (77) and single backcross (BC1)-derived (106) lines with Hartog as the recurrent parent. The population was previously selected for similarity in days to maturity and height, as described in Christopher et al. (2013). SeriM82 is a widely adapted, drought-tolerant line produced from a CIMMYT breeding program (Olivares-Villegas et al., 2007; Villareal et al., 1995). Hartog is an Australian-adapted line derived from the CIMMYT line Pavon (Sivapalan et al., 2003). Five field trials of the TP were performed between 2010 and 2012 at Gatton and Warwick in southern Queensland, Australia (27°540¢ S, 152°340¢ E, 89 m asl and 28°210¢ S, 152°100¢ E, 480 m asl, respectively) and are described in detail in Christopher et al. (2014) (Fig. 1b). The parental lines, Seri M82 and Hartog, were included in the trials. These trials were environmentally characterized by Chenu et
plants from each family were grown and selfed, and one seed from each plant was selected for the next generation. This process was continued until the F5 generation, at which time the seed from each plant was bulked for subsequent seed increase in the field. Each generation required approximately 10 to 13 wk. Seeds were harvested at ?2 wk postanthesis and then underwent 7 d drying at 35°C, 1 d imbibing at room temperature, and 5 d at 4°C, allowing seed to be sown ?2 wk after harvest. The final SC population consisted of 350 homozygous lines derived from 78 families (4–8 lines per family). Development of the SC popula-tion was completed within just 15 mo.
Speed Breeding Traits
In two separate SB glasshouse trials, using a 22-h photoperiod and the temperature regime described above, 120 lines of the TP and all lines of the SC population were sown in a random-ized complete block design (Fig. 1a and 1e, respectively). Five replicates per line were sown at a density of 12 plants per 4-L transparent ANOVApot pot (200-mm diam., 190-mm height, www.anovapot.com/php/anovapot.php), as described in the “pot” method (Richard et al., 2015). Although the clear-pot method was originally developed for measuring seedling root traits, the plants can also be grown to maturity in a space-effi-cient and convenient configuration for measuring aboveground characteristics. The experiment was blocked by replicate and lines were randomized within each block while ensuring that the same line did not occur twice in the same pot. Soil media was 70% composted pine bark (0–5 mm) and 30% coco peat to which was added Yates Flowtrace fertilizer (1 kg m−3), iron sulfate heptahydrate (1 kg m−3), superphosphate (0.4 kg m−3), copper sulfate (0.03 kg m−3), gypsum (1 kg m−3), and the controlled-release fertilizer, Scott’s Osmocote Plus trace elements at 2 g L−1 soil. The final pH was adjusted to 5.5 to 6.5.
Traits were measured on the primary tiller of each plant. Traits included DTA, plant height (cm), spike length (cm), and flag leaf length (cm). The latter three traits were assessed postanthesis.
Field Evaluation of Selection Candidates
The SC lines were evaluated in three partially replicated field trials performed in the growing season of 2017 (Fig. 1g). Hartog was included as a check for comparison with the TP field trials.
Each trial was laid out using a row–column design of 500 plots with 30% of lines replicated. Plots were 1 ´ 4 m with a target density of 100 plants m−2. One rainfed trial was performed at Warwick (WAR17rf-SC) with 12 columns and 42 rows. One irrigated (GAT17ir-SC) and one rainfed (GAT17rf-SC) trial were performed at Gatton with 14 columns and 36 rows each. Prior to sowing, soil tests were performed to determine N and P concentrations and parasitic nematode densities. Nematode densities were found to be lower than those known to cause damage to wheat cultivars. All plots in each trial were pheno-typed for DTA, plot height, and grain yield, with the exception that plot height data were not available for the Warwick SC trial (WAR17rf-SC). A summary of these trials is given in Table 1.
Analysis of Field Trial Results
Analysis was performed using R software version 3.3.2 (R Core Team, 2016) and the R package ASReml-r (Butler et al., 2009). Grain yield, DTA, and plant height were analyzed using a general mixed model approach, where means were adjusted for environmental effects within each TP and SC trial for each line (Gilmour et al., 1997; Smith et al., 2001; Kelly et al., 2007). This was done by calculating best linear unbiased estimates (BLUEs) using the following spatial mixed model from Laird and Ware (1982):
y = Xb + Zu + e [1]
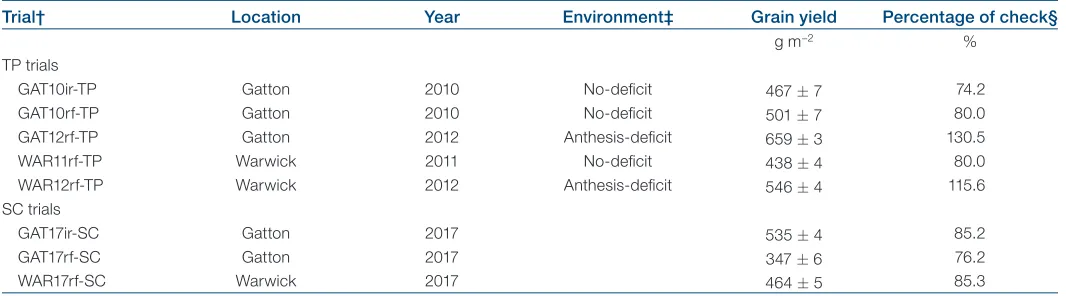
where y was an n´ 1 vector of phenotype records, where n is the number of phenotypic observations; X and Z were design matrices associated with the fixed and random effects, respec-tively; and b was a vector of fixed effects including genotype, a linear column term, and a linear row term. The linear column and row terms modeled the global variation across the field in the row and column directions. Random effects, u, included replicate, a row term, and a column term. The random column and row terms modeled the extraneous variation within the field induced by management practices such as irrigation and harvesting. Finally, e was a vector of random residual effects. Apart from genotype and replicate, variables were only included if their effects were statistically significant (p < 0.05) within that trial. To calculate overall grain yield BLUEs for a grouping of field trials, a multienvironment trial analysis was performed Table 1. Summary of training population (TP) and selection candidate (SC) trials and mean grain yield.
Trial† Location Year Environment‡ Grain yield Percentage of check§
g m−2 %
TP trials
GAT10ir-TP Gatton 2010 No-deficit 467 ± 7 74.2
GAT10rf-TP Gatton 2010 No-deficit 501 ± 7 80.0
GAT12rf-TP Gatton 2012 Anthesis-deficit 659 ± 3 130.5
WAR11rf-TP Warwick 2011 No-deficit 438 ± 4 80.0
WAR12rf-TP Warwick 2012 Anthesis-deficit 546 ± 4 115.6
SC trials
GAT17ir-SC Gatton 2017 535 ± 4 85.2
GAT17rf-SC Gatton 2017 347 ± 6 76.2
WAR17rf-SC Warwick 2017 464 ± 5 85.3
† Suffix “ir” is irrigated and “rf” is rainfed, trials were carried out at Gatton (GAT) or Warwick (WAR), and year is included in the trial name.
‡ Environmental classification was carried out by Chenu et al. (2013).
for yield (193 + 350 = 543 ´ 1), where nSC is the number of SC lines (350); e was an (nTP + nSC) ´ 1 vector of random residual effects; and Z was a design matrix relating BLUEs to lines. The GEBVs were assumed distributed g ~ N(0, Gs2
g) and e ~ N(0, Is2
e), where G is the realized genomic relationship matrix of size (nTP + nSC) ´ (nTP + nSC). The G matrix was calculated using the method described by VanRaden (2008), Method 1; I was an identity matrix; s2
g was the genetic variance and s2e was the residual variance.
When SB-PCs traits were included in addition to TP grain yield, the following multivariate model was used to generate SC GEBVs for yield and variance components:
1 1 1 0 1 1
0
n
i n i i i i
= + +
y 1 Z g e
y 1 Z g e
m
m
[3]
where variables were as in the univariate model but with addi-tional traits included up to the ith trait. For example, for two traits it was assumed that
(
)
1
2
~N 0,
⊗ g G T g where 2 g1 g12 2 g12 g2 s s s s = T
is the variance-covariance matrix of TP grain yield and an SB-PC; and
(
)
1 11
2 22
0 ~ 0, , where
0 N ⊗ = e R
I R R
e R
is the residual variance-covariance matrix of TP grain yield and an SB-PC. G was the realized genomic relationship matrix with GÄT as the Kronecker product of G and T. This equation was extended for multiple traits (e.g., two SB-PCs as well as grain yield).
Heritability and Genetic Correlations
Narrow-sense heritability (h2), or “genomic heritability” (de los Campos et al., 2015), of traits were estimated using variance components generated from the univariate GBLUP model, described above, as follows:
(
)
2 g 2 2 2 g e h s s s =+ [4]
where s2
g was the additive genetic variance attributed to line and s2
e was the residual variance.
Genetic correlations (rg) between traits, including grain yield from different trials, were calculated using variance components generated from the multivariate model as described above. Only two traits were included concurrently for the genetic correlation calculation as follows:
with a similar model to that above but with all variables nested within a fixed term for each trial.
Analysis of Speed Breeding Traits and
Principal Component Analysis
The line means of SB traits were adjusted for environmental effects, using the same R software package and model as for field-based phenotypes, although the random effects were the pot and plant position within the pot to calculate the BLUEs for each trait for each line. The genetic correlations between SB traits were calculated using the variance components estimated in the genomic best linear unbiased predictor (GBLUP) multi-variate model described below in Eq. [3], where the BLUEs of SB traits were used as the phenotypic observations and two SB traits were included pairwise. To perform the PCA, the eigenvalues and vectors of a square matrix (4 ´ 4), consisting of bivariate genetic correlations (rg) between all four SB traits of the TP and SC lines (grain yield was not used to calculate any of these correlations), were generated through the “eigen()” command in the R statistical software Base package. The proportion of variation explained by each PC was determined by dividing the corresponding eigenvalue by the sum of all eigenvalues. The trait loadings on the first and second PCs were then used to generate two new “phenotypes” for each line (PC1 and PC2). This was done for each line by multiplying the PC trait loading by its corresponding trait value and summing the four resultant values. These were then used in further analyses as described below, referred to as SB-PCs (Fig. 1f ).
Genotyping
The TP and SC populations were both genotyped with genome-wide single nucleotide polymorphism (SNP) markers using genotyping-by-sequencing (Elshire et al., 2011). Genotyping of the TP population was performed before the SC popula-tion was created to calculate the GEBVs for parent selecpopula-tion; however, once the SC population was genotyped, the SNPs of both populations were recalled together. A total of 6471 polymorphic markers were identified, from which markers containing >50% missing data and a minor allele frequency of <2.5% were removed, leaving a total of 4943 markers. Missing data were imputed using random forest imputation of 500 trees with the R package missForest (Stekhoven and Bühlmann, 2011; Stekhoven 2015).
Genomic Breeding Value Estimation
The realized genomic relationship matrix was created using the R package rrBLUP (Endelman, 2011) with all TP and SC lines included. The ASReml-R statistical package was used to calculate GEBVs and estimate variance components from the GBLUP method (Habier et al., 2007; VanRaden, 2008; Hayes et al., 2009). As environmental effects were incorporated earlier in the calculation of the BLUEs, only the population mean (m) was required as a fixed effect. The univariate model was
y = 1nm + Zg + e [2]
2 g12 g 2 2
g1 g2
r s
s s
= [5]
where rg was the genetic correlation between Trait 1 and Trait 2; s2
g12 was the genetic covariance between the two traits; and s2
g1 and s2g2 were the genetic variances of Trait 1 and Trait 2, respectively.
An approximation of the standard error of genetic correla-tions (Zar, 1999) was calculated as
( )
g2g
1 2
r x r
n
− =
− [6]
where n was the number of pairs used to derive the correlation, specifically nTP + nSC.
Genomic Prediction and Validation
Only the grain yield phenotypes of the TP were used in univar-iate models. Two multivarunivar-iate models were used that included, first, TP grain yield and the first SB-PC of the TP and SC lines (MV-PC1), and second, TP grain yield and the first and second SB-PCs of the TP and SC lines (MV-PC1–2). Grain yield phenotypes of the SC population were never included within the prediction model and only grain yield of the TP and SB-PCs were used to predict the GEBVs of the SC lines. Predictive ability was determined by taking the mean of the Pearson’s correlation coefficient of SC grain yield GEBVs and SC grain yield BLUEs, calculated for each of the SC field trials performed at Gatton and Warwick, as described above (Fig. 1f ). Prediction accuracy contrasts with that of prediction ability in that, for prediction accuracy, the correlation between the GEBVs and estimated breeding values (EBVs, here as BLUEs) is divided by the square root of the heritability. This correction is to account for the error of phenotyping and therefore the differ-ence between the EBV and true breeding value, which cannot be directly measured. However, heritability is highly sensitive to environmental effects and could cause overinflation of the estimate of accuracy. Therefore, to be conservative, predictive ability has been used here. The standard error of the predic-tion ability correlapredic-tion was given by 1 n−3 (Fisher, 1921),
where n is the number of lines, specifically nSC.
Indirect Speed Breeding Phenotypic Selection
To determine the possibility of using indirect selection for plant height and DTA under SB conditions and compare with that of direct selection in the field, the predicted relative efficiency was calculated for the TP and SC population. This was the ratio between the predicted correlated response of these traits in the field to selection under SB conditions (numerator) and predicted direct response of selection of the same traits in the field (denom-inator), as described by Falconer and Mackay (1996):
g
CRx y y
x x
i r h
R = i hx [7]
where CRx is the predicted correlated response of the trait in the field from indirect selection of the trait under SB; Rx is the
predicted response to direct selection of the trait in the field; iy is the selection intensity of the secondary trait under SB; ix is the selection intensity of the field-based trait; hy is the narrow-sense heritability of the SB trait; hx is the narrow-sense heritability of the field-based trait; and rg is the genetic correlation between the field-based and SB traits, as defined in Eq. [5]. Selection intensity can be varied in practice, although to highlight the effect of the heritability and correlation of secondary traits with grain yield, intensity was considered constant within calcula-tions here. By looking at both the TP and SC lines, in multiple trials, the consistency of this approach in different populations could be determined. Plant height and DTA were measured both in the field and under SB conditions, as described above.
RESULTS
The TP and SC population trials performed at Gatton and Warwick produced a relatively narrow range in mean grain yields across trials (Table 1). The highest yield in a TP trial was produced during the GAT12rf-TP trial, which was classified as experiencing anthesis-deficit, and the lowest yield was at WAR11rf-TP, which was clas-sified as no-deficit (Table 1). In the SC trials, both the highest and lowest grain yields were produced at Gatton, the highest being the GAT17ir-SC trial and the lowest the GAT17rf-SC trial. With the exclusion of GAT12rf-TP and WAR12rf-TP, all TP and SC trials appeared relatively similar in yield production when compared with the check cultivar, Hartog, included in each trial (Table 1).
Relationship between the Training
Population and Selection Candidates
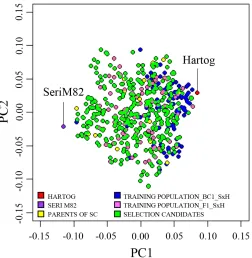
The genetic relationship between the TP and SC is important to prediction ability, and therefore the PCs of the genetic markers were plotted to visually assess their relatedness. This plot confirmed the TP and SC lines were closely related as shown by their dispersal throughout the same cluster (Fig. 2). As expected, the two parents were on the extremes of the first PC. Also anticipated, there was clear clustering of the backcross TP lines towards the recurrent parent, Hartog, indicating they were more genetically distant from the SC lines clustering closer to SeriM82. It was determined that PC1 and PC2 accounted for 12 and 7% of the genetic variation, respectively.
Heritability and Genetic Correlations
The heritability of the target and secondary traits are important to determine the benefit that may be derived from multivariate GS and indirect selection. All SB traits of both the TP and SC lines had a higher heritability than grain yield from all TP field trials (Table 2). Heritabilities for the TP and SC were estimated in separate SB trials, so they should not be directly compared between populations.
and environmental types, although the trials performed at Gatton had the lowest heritability of all trial groupings.
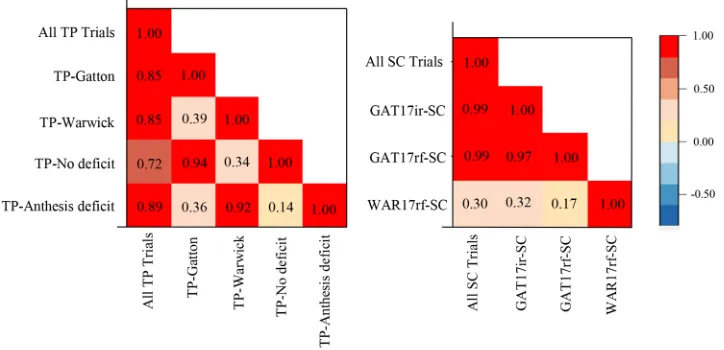
The genetic correlations among grain yields of the TP field trials were strong between those performed at Gatton and trials classified as experiencing no water deficit and between trials performed at Warwick and those classified as experiencing water deficit at anthesis (Fig. 3, left). This was also the case for all TP trial groupings and when all TP trials were considered collectively. However, correla-tions were consistently weak between both Gatton and no-deficit TP trials and the Warwick and anthesis-deficit TP trials.
The results of the TP trials were mirrored in the SC trials in that there were strong genetic correlations between the two Gatton SC trials, whereas the correla-tions of both these trials with the trial at Warwick were weak (Fig. 3, right). The strength of the relationship with Warwick remained low when all SC trials were consid-ered collectively.
Principal Component Analysis of Speed
Breeding Traits
The genetic correlations between SB traits were used to derive their PCs. The genetic correlations among SB traits of the TP and SC population were mainly moderate to moderately strong (Table 3). The PCs resulting from the PCA of these genetic correlations showed that the majority of the variation was captured in the first two
PCs and <10% was explained by the third and fourth PCs combined. The proportion of total variation captured by each PC were 0.64 for PC1, 0.29 for PC2, 0.05 for PC3, and 0.03 for PC4. Therefore, only PC1 and PC2 were used for further analyses.
The genetic correlations between the target and secondary traits, in this case the SB-PCs, are important in determining the benefit that may be derived from multi-variate GS. The genetic correlation of grain yield at Gatton and no-deficit TP trials with SB-PC1 and SB-PC2 were slightly stronger than that between Warwick trials and the SB-PCs (Table 4). Those between anthesis-deficit TP trials and the SB-PCs were much weaker than all other TP trial groupings. In the SC trials, the genetic correla-tions were strong between grain yield of the Gatton SC trials and SB-PC1 and SB-PC2. This contrasted with the relationship between the Warwick SC trial and the SB-PCs, which was weak and opposite in direction. The genetic correlations between individual SB traits and yield from each trial is provided in Supplemental Table S1.
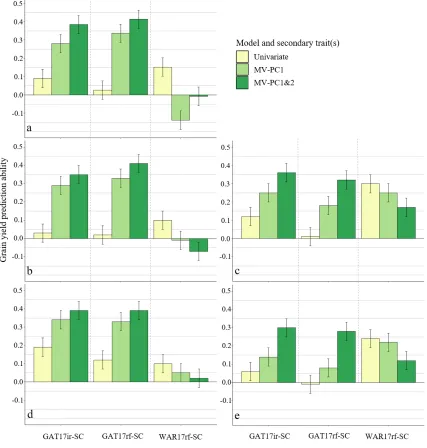
Multivariate Grain Yield Genomic Prediction
Including Speed Breeding Traits
Using univariate and multivariate (MV-PC1 and MV-PC1&2) models, the grain yield of each SC trial was
Fig. 2. Scatter diagram of Principal Component (PC) 1 and 2 vectors calculated by the principal component analysis (PCA) of 4943 genotyping-by-sequencing (GBS) single nucleotide polymorphism (SNP) markers of the training population (TP), selection candidates (SC), and parents (SeriM82 and Hartog). SxH, SeriM82 ´ Hartog.
Table 2. Narrow-sense heritability (h2) of speed breeding (SB) traits measured on the training population (TP) and selection candidates (SCs), grown and phenotyped in separate SB glasshouse trials, and h2 of grain yield from all TP and SC field trials.
Trait h2 value
Speed breeding traits Training population
Days to anthesis 0.60
Height 0.54
Spike length 0.57
Flag leaf length 0.51
Selection candidates
Days to anthesis 0.30
Height 0.71
Spike length 0.43
Flag leaf length 0.34
Grain yield TP trials†
All TP trials 0.20
Gatton (GAT10ir-TP, GAT10rf-TP, GAT12rf-TP) 0.14 Warwick (WAR11rf-TP, WAR12rf-TP) 0.23 No-deficit (GAT10ir-TP, GAT10rf-TP, WAR11rf-TP) 0.24 Anthesis-deficit (GAT12rf-TP, WAR12rf-TP) 0.29 SC trials
GAT17ir-SC 0.37
GAT17rf-SC 0.46
WAR17rf-SC 0.48
predicted with a grain yield dataset from all the TP trials (Fig. 4a), all Gatton TP trials (Fig. 4b), all Warwick TP trials (Fig. 4c), all no-deficit classified TP trials (Fig. 4d), or all anthesis-deficit classified TP trials (Fig. 4e). This was to test first whether multivariate models would improve grain yield prediction ability, and second how prediction ability would vary depending on the TP used and the SC environment predicted into. The MV-PC1&2 prediction models had a significantly higher grain yield prediction ability than univariate prediction models using grain yield data from any TP grouping to predict into
either SC trial in Gatton (GAT17ir-SC or GAT17rf-SC, Fig. 4a–4e). This was even the case when TP grain yield data were only from Warwick trials (Fig. 4c). The increase was up to fourfold compared with the univariate model. In contrast, when predicting grain yield of the Warwick SC trial (WAR17rf-SC), there was no increase in predic-tion ability when SB-PCs were included, regardless of the TP data used (Fig. 4a–4e). Furthermore, the best predic-tion from a univariate model was found when Warwick or anthesis-deficit TP grain yield data were used to predict into Warwick SC trial (Fig. 4c and 4e).
When Warwick or anthesis-deficit TP grain data were used to predict grain yield of SC trials in Gatton, it appeared that the addition of SB-PC2 enabled a greater prediction ability increase than when Gatton or no-deficit TP grain yield data was used (compare Fig. 4c and 4e with Fig. 4b and 4d). There was no addi-tional benefit from including grain yield data from all TP trials (Fig. 4a). In this situation, there was still a significant increase in prediction ability of multivariate models predicting into Gatton but multivariate predic-tion for the Warwick SC trial was significantly lower than univariate prediction. To determine if selection for yield was merely selecting lines with a longer time between anthesis and maturity, the average number of DTA of the predicted 10 highest and 10 lowest yielding lines for each SC trial were compared (data not shown). Using the univariate models, the differences in DTA between these subsets was always <1 d for all SC trials, and using the MV-PC1&2 models, the differences were always <4 d.
Indirect Selection under Speed Breeding
To compare indirect phenotypic selection under SB with direct phenotypic selection in the field the genetic corre-lations of the SB trait and the field-equivalent trait were
Fig. 3. Left: heat map of genetic correlations amongst grain yield of all training population (TP) field trials combined and groupings of TP trials based on location (Gatton or Warwick) or environmental characterization (no-deficit or anthesis-deficit). Trials included in each group are identified in Table 2. Right: heat map of genetic correlations among grain yields of the selection candidate (SC) field trials.
Table 3. Genetic correlations among speed breeding (SB) traits of the training population and selection candidates.
SB trait DTA† Height lengthSpike Flag leaf length
DTA 1.00
Height 0.71 1.00
Spike length 0.41 0.41 1.00
Flag leaf length 0.46 0.28 0.74 1.00 † DTA, days to anthesis.
Table 4. Genetic correlations between training population (TP) and selection candidate (SC) trial grain yield and the first and second principal components (PC1 and PC2) of speed breeding (SB) traits measured on both populations.
Genetic correlations
Trial SB-PC1 SB-PC2
TP trial groups
Gatton (GAT10ir-TP, GAT10rf-TP, GAT12rf-TP) 0.68 0.52 Warwick (WAR11rf-TP, WAR12rf-TP) 0.43 0.33 No-deficit (GAT10ir-TP, GAT10rf-TP, WAR11rf-TP) 0.55 0.39 Anthesis-deficit (GAT12rf-TP, WAR12rf-TP) 0.03 0.10
Mean 0.42 0.34
SC trials
GAT17ir-SC 0.90 0.79
GAT17rf-SC 0.89 0.71
WAR17rf-SC −0.17 −0.12
determined, after which the predicted relative efficiency of indirect selection was calculated. Both the TP and SC lines were investigated separately for the predicted response to indirect selection of plant height and DTA in each trial to determine whether results were consistent across populations and locations or environments. The genetic correlations between plant height and DTA phenotyped in the field and under SB conditions in the TP were weaker than those in
the SC populations, which were strong regardless of the field environment at Gatton (Table 5). However, this was still relatively strong for plant height in the TP.
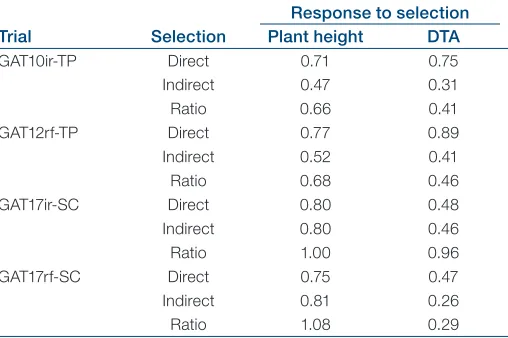
The predicted response to indirect and direct selection of plant height was consistent over all TP trial environments, with direct selection showing approximately a 1.5 times higher predicted response than indirect selection (Table 6). Predicted response to selection of DTA across the different
trials was also relatively stable, although the predicted response to indirect selection for DTA was lower than that for plant height. For DTA, the predicted response to direct selection was more than twice that for indirect selection.
The predicted response to indirect selection of plant height in the SC population (using Eq. [7]) was similar to that of predicted direct selection response in both the Gatton field trials, as was predicted indirect selection response of DTA in the irrigated field trial. The predicted response to indirect selection of DTA in the dryland trial was less than half of that of predicted direct selection in that environment (Table 6).
DISCUSSION
The aims of this study were to develop an SB-derived spring wheat population and determine whether SB traits measured on this population could increase the grain yield predic-tion ability in multivariate GS models in comparison with univariate GS models. This was to determine the potential of a breeding strategy incorporating SB and GS to increase genetic gain for yield. Indirect phenotypic selection of plant height and DTA under SB conditions for improvement of wheat populations prior to field trials was also explored using predicted responses to selection under SB and in the field.
Speed Breeding Enabled Rapid Population
Development
This study demonstrated the rapid creation of a new spring wheat SC population, from intercrossing of parents to the F5 generation, in little over a year (15 mo). Under ideal SB conditions, creation of an inbred population could have been achieved in ?12 mo, depending on the genotypes; however, this was not reached here due to other glass-house activities requiring shorter photoperiods. The newly SB-developed lines produced high yields and, when mean trial yield was expressed as a percentage of the check cultivar, the SC population was generally comparable with the TP in terms of yield in the same location and with the same watering regime (i.e., irrigated or rainfed). Large yearly rainfall differences were observed between TP trials within the same location that also contrasted in yield (Supplemental Table S2), which may have affected the similarity between SC and TP yields in these locations, in these instances. This demonstrates comparative development to spring wheat plants grown in diurnal field conditions and how robust advancement of breeding populations can be achieved in a short time in the SB system. Rapid development of a TP
and SC population could be incorporated in an efficient breeding strategy to allow selection sooner (Fig. 5a, 5c, and 5e). As previously shown in a range of species, SB condi-tions enable fast generation turnover that is ideal for SSD programs (Ghosh et al., 2018). However, this study is the first to report the full process of population development using the SB protocol and subsequent use of the population in a GS program.
Development of the SC population under SB using SSD presents the opportunity to phenotype for SB traits during one of the advanced generations, such as the F5. Although this was not performed in the current study, the F5 was phenotyped under SB using the same growing method as was used for the SSD process to create the population. This indicates population development of SC lines could be efficiently combined with phenotyping of SB traits and multivariate GS applied to the F5 generation to determine which lines could be advanced to field trials and to be used as the parents of the next round of crossing (Fig. 5c), thus allowing more selection cycles in a given time.
Multivariate Genomic Selection with Speed
Breeding Traits Significantly Improved Grain
Yield Prediction Ability
Regardless of the TP used, the inclusion of SB-PCs in multivariate GS models significantly increased grain yield
Table 5. Genetic correlation between field-based plant height and days to anthesis (DTA) measured on the training population (TP) or selection candidates (SC) in field trials and the same traits measured on the same lines under speed breeding (SB) conditions. Details of the trials are given in Table 1.
Genetic correlation
Field-based trait SB trait GAT10ir-TP GAT12rf-TP GAT17ir-SC GAT17rf-SC
Plant height Height 0.65 0.71 0.95 0.96
DTA DTA 0.40 0.40 0.84 0.90
Table 6. Predicted response to direct phenotypic selection in the field (h) in the training population (TP) trials, GAT10ir-TP and GAT12rf-GAT10ir-TP, and the selection candidate (SC) tri-als, GAT17ir-SC and GAT17rf-SC, for plant height and days to anthesis (DTA), indirect phenotypic selection (h.rg) under speed breeding for the same traits, and the ratio between both modes of selection. Details of the TP and SC trials are given in Table 1.
Response to selection Trial Selection Plant height DTA
GAT10ir-TP Direct 0.71 0.75
Indirect 0.47 0.31
Ratio 0.66 0.41
GAT12rf-TP Direct 0.77 0.89
Indirect 0.52 0.41
Ratio 0.68 0.46
GAT17ir-SC Direct 0.80 0.48
Indirect 0.80 0.46
Ratio 1.00 0.96
GAT17rf-SC Direct 0.75 0.47
Indirect 0.81 0.26
prediction ability, compared with that of univariate models, when predicting performance in irrigated or dryland trials at Gatton. It is well understood that the extent of the genetic correlation between a secondary and target trait is key to whether the prediction accuracy will be increased (Schaeffer, 1984; Thompson and Meyer, 1986). The SB-PCs shared very strong, positive genetic correlations with yield obtained in two SC trials at Gatton yet showed extremely low and negative correlations with grain yield in the SC trial at Warwick. Similarly, the genetic correla-tions between yield of the no-deficit TP trial subsets and SB-PC1 were also higher than those between yield of the anthesis-deficit TP trial subsets and the SB-PCs.
In addition to genetic correlations, the heritability of secondary traits may have contributed to the increase in
prediction ability (Lorenzana and Bernardo, 2009; Daet-wyler et al., 2010). Grain yield showed low heritability across all TP trials, which is often the case due to its suscep-tibility to environmental influences (Babar et al., 2007). Jia and Jannink (2012) found the prediction accuracy of a low-heritability trait could be improved by using a high-heritability trait within multivariate prediction, allowing a less heritable trait to effectively “borrow”’ information from the higher one. All SB traits had a higher heritability than grain yield across all TP trials and in general were moderate, which supports their ability to improve predic-tion of grain yield (Henderson and Quaas, 1976; Combs and Bernardo, 2013; Guo et al., 2014).
Although a close genetic relationship was observed between the TP and SC population, which, as previously
stated, is required for accurate prediction, the prediction ability of the univariate models was generally low. As discussed, previous studies on multivariate GS to improve wheat has involved phenotyping the SC population in the field, which negates the time-saving benefit of GS and is not realistic in a breeding program context. Furthermore, including yield secondary traits on only the TP and not also measuring these traits on the SC did not result in an increase in prediction ability. Here, the rapid growth enabled by SB meant SC lines could be phenotyped for secondary traits prior to GS. This provided the model with more infor-mation, directly from the SC lines, enabling an increase in prediction ability in comparison with the univariate models, which included only yield of the TP. As can be seen in Fig. 5c, within the proposed breeding strategy, SC lines could be phenotyped for yield secondary traits prior to application to GS and field trials, thus maintaining the time-saving benefit of GS in addition to increasing the accuracy of selections. Further cycles of selection within this strategy would involve updating of the GS model through recalcu-lation of the PCA for SB traits as the SC popurecalcu-lations are phenotyped and data are collected from yield trials (Fig. 5).
Inclusion of Speed Breeding Trait Principal
Components Facilitated Prediction
Reducing multiple traits into their PCs allowed all traits to be incorporated simultaneously into the prediction models, and by using the genetic correlations between SB traits, only the variation of these traits determined by genetic components was included. This would be difficult with all traits separately, but by incorporating only the first two PCs, most variation explained by the SB traits was captured. The use of PCA may also ease uncertainty around which traits to include in the prediction model. Genetic correlations and heritability varied for most traits between environments, indicating that the most beneficial to use as a secondary trait in one environment may not be best in another. By routinely measuring a core set of SB traits and using their PCs, predictions may possible to calculate without computational constraints.
Environment of Training Population
Evaluation Affected Prediction Ability
The ability to predict grain yield was strongly influenced by the environment in which the TP was evaluated, although this was more difficult when predicting into Warwick. When predicting Gatton SC trial performance, multivar-iate prediction ability was high regardless of the location or environment type of the TP trials used. Conversely, only TP data from Warwick or anthesis-deficit trials could predict grain yield in the Warwick SC trial. This may be attributable to the context dependency of adaptive traits. For instance, a trait may enhance performance in a high-water-stress environment but could have a negative effect in
a low-water-stress environment (Ceccarelli, 1989). Cooper et al. (1997) found that prediction accuracy of wheat perfor-mance using data from a low-stress environment diminished with increasingly water-limited target environments. The environment in which the TP is phenotyped will affect the alleles that are favored in the prediction model. Training data across a limited number of environments or locations can result in promotion of lines adapted to a narrow range of environmental conditions and potentially lead to the discarding of lines with good performance in other condi-tions (Jarquín et al., 2017). The strong correlation between grain yield at Gatton and no-deficit TP trials indicates that environments sampled at Gatton were, in general, lower-stress compared with Warwick, where grain yield was closely correlated with that of the anthesis-deficit trials. Correla-tions between grain yield of the SC trials also reflected this contrast between Gatton and Warwick. Despite one trial at Gatton being irrigated and the other rainfed (dryland), grain yields from both trials were closely correlated but only weakly correlated with the Warwick SC trial. This is supported by climate data. The Warwick SC trial had lower rainfall than the Gatton SC trials both before and after anthesis, and both Warwick TP trials had lower total rainfall during the growing seasons than those at Gatton, even when they were characterized as the same environmental classi-fication, (i.e., no-deficit or anthesis-deficit; Supplemental Table S2). In fact, for >20 yr, Warwick has had fewer days of rainfall than Gatton (Supplemental Table S3). This indi-cates that, in general, Warwick is a drier environment than Gatton. The mean temperatures experienced by Gatton and Warwick during the growing seasons of the TP trials or SC trials were relatively narrow in range and therefore not expected to have greatly affected the comparisons between the locations (Supplemental Table S2). Even though both these locations are within southeast Queensland, the region is known for highly variable climatic conditions (Chenu et al., 2013), and large genotype ´ environment interactions are common between wheat trials (Brennan et al., 1981). Consideration of these factors is increasingly important with projections indicating increased water stress not only within this region (Watson et al., 2017), but also in other important wheat-producing regions worldwide (Ray et al., 2013).
Indirect Speed Breeding Selection Has
Potential to Rapidly Improve Populations
1983). In the case of plant height, in Western Australia, a shorter wheat stem is desirable for the dry climate, where assimilates are directed more to grain filling rather than straw production (Siddique and Whan, 1993). Plant height and DTA were assessed under both SB and field conditions in two populations across multiple environments, allowing determination of the predicted field response to SB pheno-typic selection, using the genetic correlations between the traits and their heritability. Plant height under SB had consistently strong genetic correlations with field-based height across a range of environments and the predicted response to indirect selection was at times as effective as the predicted response to direct field selection across popula-tions and trials (the predictive relative efficiency ranging 66–100%, Supplemental Table S1). Using indirect selection under SB, populations could be rapidly adapted to meet requirements of their target locations. The need to increase or decrease height or time to anthesis would depend on the population, target location, and segregating genes present in the population (Cane et al., 2013). In addition, the examples shown here were based on one cycle of selec-tion on inbred lines. If successive generaselec-tions of selecselec-tion were performed, genetic variation would decrease if new genetic material was not introduced and would reduce the extent to which traits were modified. Although selection was only predicted in the current study, the consistency of the relationship between these two traits under SB and the field, in multiple trials, is encouraging. Expected response to indirect selection of grain yield was also calculated (data not shown); however, this was low, suggesting that GS is better at predicting this complex trait.
In conclusion, an efficient spring wheat breeding strategy has been proposed combining SB and GS. Pheno-typing for yield-correlated SB traits could occur during the final stages of rapid population development through SSD, at which time multivariate GS would determine which lines to progress to field trials and subsequent cycles of selection. The potential of this strategy is strongly supported by the findings of this study. The potential of indirect selection for important yield-related traits under SB conditions was also explored, and further investiga-tion to validate the results could support fast populainvestiga-tion improvement prior to field trials. In using these approaches, the rate of genetic gain in cereals could be accelerated, and further advances in crop improvement could be more rapidly achieved.
Supplemental Material
Supplemental material is available online for this article.
Conflict of Interest
The authors declare that there is no conflict of interest.
Author Contribution Statement
A. Watson designed and carried out SB and SC trials, field phenotyping, and data analysis. L.T. Hickey carried out SC trials and field phenotyping and consulted on experi-mental design. L.T. Hickey and J. Rutkoski conceptually designed the project. J. Rutkoski made parent selections for the SC population and advised on data analysis. J. Chris-topher was involved in creation of the TP and field trials. J. Poland generated genetic marker data and performed bioinformatics for subsequent analysis. B.J. Hayes advised on data analysis and consulted on experimental design. A. Watson wrote the manuscript, and all the authors revised and edited the draft.
Acknowledgments
A. Watson was supported by an Australian Post-Graduate Award and the Grains Research and Development Corpora-tion (GRDC) Industry Top-Up Scholarship (GRS11008). L.T. Hickey was supported by an Australian Research Council Early Career Discovery Research Award (DE170101296). The authors give thanks to Professor David Jordan and Dr. Emma Mace for their advice on data analysis. The authors also thank the field staff at the Queensland Department of Agriculture in Warwick and at the University of Queensland Gatton farm, and Stuart Meldrum for assistance with field trials at Gatton and Warwick. The authors also wish to acknowledge the support provided by the glasshouse managers at the St. Lucia campus of the University of Queensland.
References
Abdi, H., and L.J. Williams. 2010. Principal component analy-sis. Wiley Interdiscip. Rev. Comput. Stat. 2:433–459. doi:10.1002/wics.101
Babar, M.A., M. van Ginkel, M.P. Reynolds, B. Prasad, and A.R. Klatt. 2007. Heritability, correlated response, and indirect selec-tion involving spectral reflectance indices and grain yield in wheat. Aust. J. Agric. Res. 58:432–442. doi:10.1071/AR06270 Bolormaa, S., J. Pryce, B. Hayes, and M. Goddard. 2010. Multi-variate analysis of a genome-wide association study in dairy cattle. J. Dairy Sci. 93:3818–3833. doi:10.3168/jds.2009-2980 Brandariz, S.P., and R. Bernardo. 2018. Maintaining the accuracy
of genome-wide predictions when selection has occurred in the training population. Crop Sci. 58:1226–1231. doi:10.2135/ cropsci2017.11.0682
Brennan, P., D. Byth, D. Drake, I. De Lacy, and D. Butler. 1981. Determination of the location and number of test environ-ments for a wheat cultivar evaluation program. Aust. J. Agric. Res. 32:189–201. doi:10.1071/AR9810189
Butler, D., B. Cullis, A. Gilmour, and B. Gogel. 2009. asreml: Asreml () fits the linear mixed model. R package version 3.0. Comprehensive R Arch. Network, Vienna.
Calus, M.P.L., and R.F. Veerkamp. 2011. Accuracy of multi-trait genomic selection using different methods. Genet. Sel. Evol. 43:26–40. doi:10.1186/1297-9686-43-26
Cane, K., H.A. Eagles, D.A. Laurie, B. Trevaskis, N. Vallance, R.F. Eastwood, and P.J. Martin. 2013. Ppd-B1 and Ppd-D1
Ceccarelli, S. 1989. Wide adaptation: How wide? Euphytica 40:197–205.
Chenu, K., R. Deihimfard, and S.C. Chapman. 2013. Large-scale characterization of drought pattern: A continent-wide mod-elling approach applied to the Australian wheatbelt–spatial and temporal trends. New Phytol. 198:801–820. doi:10.1111/ nph.12192
Christopher, J., M. Christopher, R. Jennings, S. Jones, S. Fletcher, A. Borrell, et al. 2013. QTL for root angle and number in a population developed from bread wheats (Triticum aestivum) with contrasting adaptation to water-limited environments. Theor. Appl. Genet. 126:1563–1574. doi:10.1007/s00122-013-2074-0
Christopher, J.T., M. Veyradier, A.K. Borrell, G. Harvey, S. Fletcher, and K. Chenu. 2014. Phenotyping novel stay-green traits to capture genetic variation in senescence dynamics. Funct. Plant Biol. 41:1035–1048. doi:10.1071/FP14052 Combs, E., and R. Bernardo. 2013. Accuracy of genome-wide
selection for different traits with constant population size, heritability, and number of markers. Plant Genome 6(1). doi:10.3835/plantgenome2012.11.0030
Cooper, M., R.E. Stucker, I.H. DeLacy, and B.D. Harch. 1997. Wheat breeding nurseries, target environments, and indirect selection for grain yield. Crop Sci. 37:1168–1176. doi:10.2135/ cropsci1997.0011183X003700040024x
Daetwyler, H.D., R. Pong-Wong, B. Villanueva, and J.A. Woolliams. 2010. The impact of genetic architecture on genome-wide evaluation methods. Genetics 185:1021–1031. doi:10.1534/genetics.110.116855
de los Campos, G., D. Sorensen, and D. Gianola. 2015. Genomic heritability: What is it? PLoS Genet. 11:e1005048. doi:10.1371/ journal.pgen.1005048
El-Dien, O.G., B. Ratcliffe, J. Klápště, C. Chen, I. Porth, and Y.A. El-Kassaby. 2015. Prediction accuracies for growth and wood attributes of interior spruce in space using genotyping-by-sequencing. BMC Genomics 16:370–386. doi:10.1186/ s12864-015-1597-y
Elshire, R.J., J.C. Glaubitz, Q. Sun, J.A. Poland, K. Kawa-moto, E.S. Buckler, and S.E. Mitchell. 2011. A robust, simple genotyping-by-sequencing (GBS) approach for high diversity species. PLoS One 6:e19379. doi:10.1371/journal. pone.0019379
Endelman, J.B. 2011. Ridge regression and other kernels for genomic selection with R package rrBLUP. Plant Genome 4:250–255. doi:10.3835/plantgenome2011.08.0024
Falconer, D.S., and T.F. Mackay. 1996. Introduction to quantita-tive genetics. 4th ed. Pearson, London.
Fernandes, S.B., K.O. Dias, D.F. Ferreira, and P.J. Brown. 2018. Efficiency of multi-trait, indirect, and trait-assisted genomic selection for improvement of biomass sorghum. Theor. Appl. Genet. 131:747–755. doi:10.1007/s00122-017-3033-y
Fisher, R.A. 1921. On the ‘probable error’ of a coefficient of cor-relation deduced from a small sample. Metron 1:3–32. Ghosh, S., A. Watson, O.E. Gonzalez-Navarro, R.H.
Ramirez-Gonzalez, L. Yanes, M. Mendoza-Suárez, and L.T. Hickey. 2018. Speed breeding in growth chambers and glasshouses for crop breeding and model plant research. Nat. Protoc. 13:2944–2963. doi:10.1038/s41596-018-0072-z
Gilmour, A.R., B.R. Cullis, and A.P. Verbyla. 1997. Account-ing for natural and extraneous variation in the analysis of field experiments. J. Agric. Biol. Environ. Stat. 2:269–293. doi:10.2307/1400446
Guo, G., F. Zhao, Y. Wang, Y. Zhang, L. Du, and G. Su. 2014. Comparison of single-trait and multiple-trait genomic pre-diction models. BMC Genet. 15:30. doi:10.1186/1471-2156-15-30
Habier, D., R. Fernando, and J. Dekkers. 2007. The impact of genetic relationship information on genome-assisted breeding values. Genetics 177:2389–2397. doi:10.1534/genetics.107.081190 Hayes, B.J., P.M. Visscher, and M.E. Goddard. 2009. Increased
accuracy of artificial selection by using the realized rela-tionship matrix. Genet. Res. 91:47–60. doi:10.1017/ S0016672308009981
Heffner, E.L., A.J. Lorenz, J.-L. Jannink, and M.E. Sorrells. 2010. Plant breeding with genomic selection: Gain per unit time and cost. Crop Sci. 50:1681–1690. doi:10.2135/crop-sci2009.11.0662
Henderson, C., and R. Quaas. 1976. Multiple trait evaluation using relatives’ records. J. Anim. Sci. 43:1188–1197. doi:10.2527/ jas1976.4361188x
Heslot, N., J.L. Jannink, and M.E. Sorrells. 2015. Perspectives for genomic selection applications and research in plants. Crop Sci. 55:1–12. doi:10.2135/cropsci2014.03.0249
Jarquín, D., C. Lemes da Silva, R.C. Gaynor, J. Poland, A. Fritz, R. Howard, et al. 2017. Increasing genomic-enabled predic-tion accuracy by modeling genotype ´ environment inter-actions in Kansas wheat. Plant Genome 10(2). doi:10.3835/ plantgenome2016.12.0130
Jia, Y., and J.L. Jannink. 2012. Multiple-trait genomic selection methods increase genetic value prediction accuracy. Genetics 192:1513–1522. doi:10.1534/genetics.112.144246
Kelly, A.M., A.B. Smith, J.A. Eccleston, and B.R. Cullis. 2007. Accuracy of varietal selection using factor analytic models for multi-environment plant breeding trials. Crop Sci. 47:1063– 1070. doi:10.2135/cropsci2006.08.0540
Laird, N.M., and J.H. Ware. 1982. Random effects models for lon-gitudinal data. Biometrics 38:963–974. doi:10.2307/2529876 Liu, Y., Y. Tao, Z. Wang, Q. Guo, F. Wu, X. Yang, et al. 2017.
Identification of QTL for flag leaf length in common wheat and their pleiotropic effects. Mol. Breed. 38:11. doi:10.1007/ s11032-017-0766-x
Lorenz, A.J., S. Chao, F.G. Asoro, E.L. Heffner, T. Hayashi, H. Iwata, et al. 2011. Genomic selection in plant breeding. Adv. Agron. 110:77–123. doi:10.1016/B978-0-12-385531-2.00002-5 Lorenzana, R.E., and R. Bernardo. 2009. Accuracy of
geno-typic value predictions for marker-based selection in bi-parental plant populations. Theor. Appl. Genet. 120:151–161. doi:10.1007/s00122-009-1166-3
Lupton, F.G.H. 1966. Translocation of photosynthetic assimilates in wheat. Ann. Appl. Biol. 57:355–364. doi:10.1111/j.1744-7348.1966.tb03829.x
Meuwissen, T.H.E., B.J. Hayes, and M.E. Goddard. 2001. Predic-tion of total genetic value using genome-wide dense marker maps. Genetics 157:1819–1829.
Neyhart, J.L., T. Tiede, A.J. Lorenz, and K.P. Smith. 2017. Evaluat-ing methods of updatEvaluat-ing trainEvaluat-ing data in long-term genome-wide selection. G3: Genes, Genomes, Genet. 7:1499–1510. doi:10.1534/g3.117.040550
Olivares-Villegas, J.J., M.P. Reynolds, and G.K. McDonald. 2007. Drought-adaptive attributes in the Seri/Babax hexaploid wheat population. Funct. Plant Biol. 34:189. doi:10.1071/ FP06148
Pszczola, M., R.F. Veerkamp, Y. de Haas, E. Wall, T. Strabel, and M.P. Calus. 2013. Effect of predictor traits on accuracy of genomic breeding values for feed intake based on a limited cow reference population. Animal 7:1759–1768. doi:10.1017/ S175173111300150X
Pugsley, A.T. 1983. The impact of plant physiology on Austra-lian wheat breeding. Euphytica 32:743–748. doi:10.1007/ BF00042154
R Core Team. 2016. R: A language and environment for statistical computing. R Found. Stat. Comput., Vienna.
Ray, D.K., N.D. Mueller, P.C. West, and J.A. Foley. 2013. Yield trends are insufficient to double global crop produc-tion by 2050. PLoS One 8:e66428. doi:10.1371/journal. pone.0066428
Richard, C.A., L.T. Hickey, S. Fletcher, R. Jennings, K. Chenu, and J.T. Christopher. 2015. High-throughput phenotyping of seminal root traits in wheat. Plant Methods 11:13. doi:10.1186/ s13007-015-0055-9
Rutkoski, J., J. Poland, S. Mondal, E. Autrique, L.G. Pérez, J. Crossa, et al. 2016. Canopy temperature and vegetation indices from high-throughput phenotyping improve accuracy of pedi-gree and genomic selection for grain yield in wheat. G3: Genes, Genomes, Genet. 6:2799–2808. doi:10.1534/g3.116.032888 Sainani, K.L. 2014. Introduction to principal components analysis.
PM&R 6:275–278. doi:10.1016/j.pmrj.2014.02.001
Schaeffer, L.R. 1984. Sire and cow evaluation under multiple trait models. J. Dairy Sci. 67:1567–1580. doi:10.3168/jds.S0022-0302(84)81479-4
Siddique, K.H.M., and B.R. Whan. 1993. Ear:stem ratios in breed-ing populations of wheat: Significance for yield improvement. Euphytica 73:241–254. doi:10.1007/BF00036703
Sivapalan, S., L. O’Brien, G. Ortiz-Ferrara, G.J. Hollamby, I. Bar-clay, and P. Martin. 2003. Corrigendum to: A comparative study for yield performance and adaptation of some Australian and CIMMYT/ICARDA wheat genotypes grown at selected locations in Australia and the WANA region. Crop Pasture Sci. 54:331. doi:10.1071/AR02039_CO
Smith, A., B. Cullis, and R. Thompson. 2001. Analyzing variety by environment data using multiplicative mixed models and adjustments for spatial field trend. Biometrics 57:1138–1147. doi:10.1111/j.0006-341X.2001.01138.x
Stekhoven, D.J. 2015. missForest: Nonparametric missing value imputation using random forest. Astrophysics Source Code Library, Houghton, MI.
Stekhoven, D.J., and P. Bühlmann. 2011. MissForest- non-para-metric missing value imputation for mixed-type data. Bioin-formatics 28:112–118. doi:10.1093/bioinBioin-formatics/btr597 Sun, J., J.E. Rutkoski, J.A. Poland, J. Crossa, J.-L. Jannink, and
M.E. Sorrells. 2017. Multitrait, random regression, or simple repeatability model in high-throughput phenotyping data improve genomic prediction for wheat grain yield. Plant Genome 10(2). doi:10.3835/plantgenome2016.11.0111
Sun, X.C., R. Fernando, and J. Dekkers. 2016. Contributions of linkage disequilibrium and co-segregation information to the accuracy of genomic prediction. Genet. Sel. Evol. 48:77. doi:10.1186/s12711-016-0255-4
Thompson, R., and K. Meyer. 1986. A review of theoretical aspects in the estimation of breeding values for multi-trait selection. Liv-est. Prod. Sci. 15:299–313. doi:10.1016/0301-6226(86)90071-0 Tiede, T., and K.P. Smith. 2018. Evaluation and retrospective
optimization of genomic selection for yield and disease resis-tance in spring barley. Mol. Breed. 38:55. doi:10.1007/s11032-018-0820-3
VanRaden, P.M. 2008. Efficient methods to compute genomic pre-dictions. J. Dairy Sci. 91:4414–4423. doi:10.3168/jds.2007-0980 Villareal, R., E. del Toro, A. Mujeeb0-Kazi, and S. Rajaram.
1995. The 1BL/1RS chromosome translocation effect on yield characteristics in a Triticum aestivum L. cross. Plant Breed. 114:497–500. doi:10.1111/j.1439-0523.1995.tb00843.x Watson, A., S. Ghosh, M.J. Williams, W.S. Cuddy, J. Simmonds,
M.-D. Rey, et al. 2018. Speed breeding is a powerful tool to accelerate crop research and breeding. Nat. Plants 4:23–29. doi:10.1038/s41477-017-0083-8
Watson, J., B. Zheng, S. Chapman, and K. Chenu. 2017. Projected impact of future climate on water-stress patterns across the Australian wheatbelt. J. Exp. Bot. 68:5907–5921. doi:10.1093/ jxb/erx368
Zar, J.H. 1999. Biostatistical analysis. Prentice Hall, Upper Saddle River, NJ.