Article
Visual Motion Onset Brain–Computer Interface
Jair Pereira Junior1,2,†, Caio Teixeira1,3,†and Tomasz M. Rutkowski1,‡,*
1 University of Tsukuba, Tsukuba, Japan
2 Federal University of ABC (UFABC), Santo Andre, Sao Paulo, Brazil
3 University of Campinas (UNICAMP), Campinas, Sao Paulo, Brazil
* Correspondence: [email protected]
† These authors contributed equally to this work. ‡ Current address: The University of Tokyo, Tokyo, Japan
Abstract: The paper presents a study of two novel visual motion onset stimulus-based brain–computer interfaces (vmoBCI). Two settings are compared with afferent and efferent to a computer screen center motion patterns. Online vmoBCI experiments are conducted in an oddball event–related potential (ERP) paradigm allowing for “aha–responses” decoding in EEG brainwaves. A subsequent stepwise linear discriminant analysis classification (swLDA) classification accuracy comparison is discussed based on two inter–stimulus–interval (ISI) settings of 700 and 150 ms in two online vmoBCI applications with six and eight command settings. A research hypothesis of classification accuracy non–significant differences with various ISIs is confirmed based on the two settings of 700 ms and 150 ms, as well as with various numbers of ERP response averaging scenarios. The efferent in respect to display center visual motion patterns allowed for a faster interfacing and thus they are recommended as more suitable for the no–eye–movements requiring visual BCIs.
Keywords:Brain-computer interface (BCI); visual motion perception; neurotechnology application; EEG; realtime brain signal decoding.
1. Introduction
A brain–computer interface (BCI) is a neurotechnology that utilizes only central nervous system (CNS) signals (brainwaves) of a user to create a new communication channel with others or to control external devices without depending on any muscle activity [1]. The BCI technology has provided a support already to patients’ life improvement who suffer from severe paralysis due to diseases like an amyotrophic lateral sclerosis (ALS) [1]. The successful alternative options have been developed recently to utilize spatial auditory [2,3] or tactile (somatosensory) modes [4,5]. Meanwhile, the visual BCI seems to offer still the superior communication options in comparison with the above modalities [1,6–11], yet they require intentionally controlled eye–movements, which some of locked–in syndrome (LIS) users cannot maintain [12,13].
We present results of a novel study utilizing two strategies of the visual motion onset patterns [14,15] for BCI purposes with stimuli presented as afferent or efferent to a centre of the field of vision, the fovea. The vmoBCI patterns used in the presented experiments are shown in Figures1aand1bfor afferent and efferent movements, respectively. A goal of this study is to compare and test a BCI performance (a classification accuracy) of the novel vmoBCI paradigm in function of two inter–stimulus interval (ISI) settings. Namely the ISI equal to 700 ms (a very easy case) and 150 ms (a harder case due to fast repetition of the presented visual movement patterns and larger overlap of the brainwave ERPs) are evaluated in the paper.
Results obtained with ten healthy users in online BCI experiments with stepwise linear discriminant analysis (swLDA) classifier [16] and two different averaging settings are analyzed and discussed. From now on the paper is organized as follows. In the next section we present results. Discussion, materials and methods used in order to capture, process and classify the brainwave response in application to the proposed vmoBCI follow. Conclusions summarize the paper.
Preprints (www.preprints.org) | NOT PEER-REVIEWED | Posted: 4 October 2016 doi:10.20944/preprints201609.0126.v2
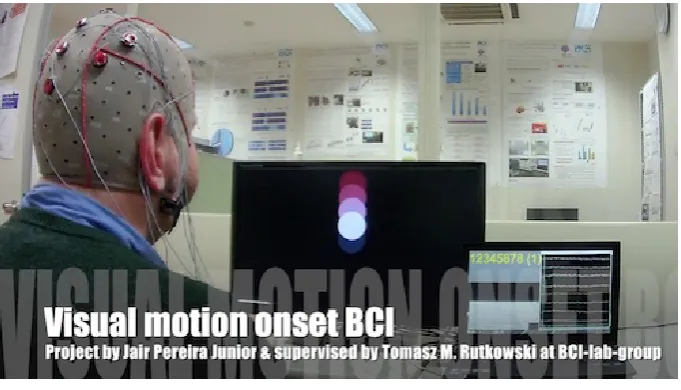
(a) A screenshot from a video available online (https://youtu.be/ JbdazbFntek) presenting the afferent visual motion onset BCI paradigms with stimuli trajectories towards the screen center
(b) A screenshot from a video available online (https://youtu.be/ UaxIQdOctcQ) presenting the efferent visual motion onset BCI paradigms with stimuli trajectories towards the screen center
Figure 1.The user wearing EEG cap seats in front of a computer display with the visual motion onset BCI paradigms.(a)An afferent visual motion case with six stimuli.(b)An efferent visual motion case with eight patterns. In the both photographs the EEG brainwave signals are presented on smaller computer displays with numbers representing the target movements to be recognized by the user. Published with permission of the depicted user.
3 of 10
2. Results
The results of brainwave ERPs have been summarized as simple grand mean averaged time series with standard error bars in Figures2a,2b,3a, and3b. Those results have clearly shown a very small impact of the two tested ISIs of 700 ms and 150 ms, as well as the afferent and efferent visual motion settings summarized in Figures2and3, respectively.
More interesting results have been elucidated with an area under curve (AUC) analysis for ERP feature distributions as reported in Figures4and5. The AUC scores, visualizing the EEG features separability for a subsequent classification, were higher (AUC > 0.65) for the efferent motion cases depicted in Figures5aand5bfor ISIof 700 ms and 150 ms, respectively. The AUC analysis results were confirmed also with vmoBCI classification accuracies summarized in Tables1and2for afferent and efferent vmoBCI online experiments using ten and five brainwave ERP averaging scenarios. The mean accuracies were non–significantly differing, as tested with pairwise rank–sum Wilcoxon method, among the tested afferent and efferent cases with variousISIand averaging settings.
Table 1. Afferent visual motion onset BCI accuracy results (a chance level of 16.7% due to six commands used)
User number ISI=700 ms ISI=150 ms
10 trials 5 trials 10 trials 5 trials
#1 100.0% 83.3% 100.0% 100.0%
#2 16.7% 50.0% 66.7% 83.3%
#3 100.0% 83.3% 100.0% 66.7%
#4 100.0% 100.0% 100.0% 66.7%
#5 100.0% 100.0% 100.0% 66.7%
Average accuracy 83.3±37.2% 83.3±20.4% 93.3±14.9% 76.7±14.9%
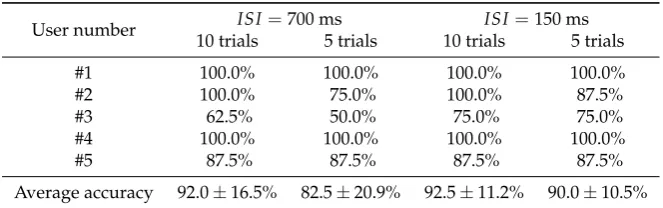
Table 2. Efferent visual motion onset BCI accuracy results (a chance level of 12.5% due to eight commands used)
User number ISI=700 ms ISI=150 ms
10 trials 5 trials 10 trials 5 trials
#1 100.0% 100.0% 100.0% 100.0%
#2 100.0% 75.0% 100.0% 87.5%
#3 62.5% 50.0% 75.0% 75.0%
#4 100.0% 100.0% 100.0% 100.0%
#5 87.5% 87.5% 87.5% 87.5%
Average accuracy 92.0±16.5% 82.5±20.9% 92.5±11.2% 90.0±10.5%
3. Discussion
The aim of this study was to test the ISI variability impact on the vmoBCI classification accuracy results in various brainwave averaging scenarios of the proposed visual motion onset paradigm. The online results obtained with the swLDA classifier did not show significant differences for the both afferent and efferent motion scenarios.
The results are very promising for future online applications with patients suffering from LIS allowing for speeding up the BCI stimuli presentation without significant classification degradation.
Preprints (www.preprints.org) | NOT PEER-REVIEWED | Posted: 4 October 2016 doi:10.20944/preprints201609.0126.v2
(a)ISI=700 ms.
(b)ISI=150 ms.
Figure 2.Grand mean averaged brainwave ERP responses in afferent vmoBCI. The green traces depict the attended targets with P300 responses and blue the non–targets. The intervals surrounding the mean traces depict standard errors.
5 of 10
(a)ISI=700 ms.
(b)ISI=150 ms.
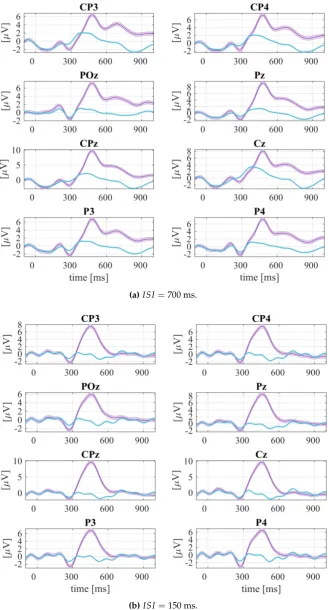
Figure 3.Grand mean averaged brainwave ERP responses in efferent vmoBCI. The green traces depict the attended targets with P300 responses and blue the non–targets. The intervals surrounding the mean traces depict standard errors.
Preprints (www.preprints.org) | NOT PEER-REVIEWED | Posted: 4 October 2016 doi:10.20944/preprints201609.0126.v2
max(AUC) at 453 ms 0.48 0.5 0.52 0.54 0.56 0.58 0.6 0.62
min(AUC) at 293 ms
0.48 0.5 0.52 0.54 0.56 0.58 0.6 0.62 Averaged targets
0 300 600
CP3 CP4 POz Pz CPz Cz P3 P4 [ µ V] -2 0 2 4 6 Averaged non-targets
0 300 600
CP3 CP4 POz Pz CPz Cz P3 P4 [ µ V] -2 0 2 4 6
Targets vs. non-targets AUC scores
0 300 600
time [ms] CP3 CP4 POz Pz CPz Cz P3 P4 AUC 0.5 0.55 0.6
(a)ISI=700 ms.
max(AUC) at 387 ms
0.48 0.5 0.52 0.54 0.56 0.58 0.6
min(AUC) at 63 ms
0.48 0.5 0.52 0.54 0.56 0.58 0.6 Averaged targets
0 300 600
CP3 CP4 POz Pz CPz Cz P3 P4 [ µ V] -1 0 1 2 3 Averaged non-targets
0 300 600
CP3 CP4 POz Pz CPz Cz P3 P4 [ µ V] -1 0 1 2 3
Targets vs. non-targets AUC scores
0 300 600
time [ms] CP3 CP4 POz Pz CPz Cz P3 P4 AUC 0.5 0.55 0.6
(b)ISI=150 ms.
Figure 4.AUC analysis of ERP responses in afferent vmoBCI. The left column head topographic plots depict the latencies with the best (maximum) and worse (minimum) of AUC scores. The right column summarizes the ERP responses in form of matrices of all channels and AUC traces at the bottom.
7 of 10
max(AUC) at 488 ms
0.5 0.55 0.6 0.65
min(AUC) at 305 ms
0.5 0.55 0.6 0.65
Averaged targets
0 300 600 900 CP3 CP4 POz Pz CPz Cz P3 P4 [ µ V] -2 0 2 4 6 8 Averaged non-targets
0 300 600 900 CP3 CP4 POz Pz CPz Cz P3 P4 [ µ V] -2 0 2 4 6 8
Targets vs. non-targets AUC scores
0 300 600 900
time [ms] CP3 CP4 POz Pz CPz Cz P3 P4 AUC 0.5 0.55 0.6 0.65
(a)ISI=700 ms.
max(AUC) at 465 ms
0.5 0.55 0.6 0.65
min(AUC) at 281 ms
0.5 0.55 0.6 0.65
Averaged targets
0 300 600 900 CP3 CP4 POz Pz CPz Cz P3 P4 [ µ V] -2 0 2 4 6 8 Averaged non-targets
0 300 600 900 CP3 CP4 POz Pz CPz Cz P3 P4 [ µ V] -2 0 2 4 6 8
Targets vs. non-targets AUC scores
0 300 600 900
time [ms] CP3 CP4 POz Pz CPz Cz P3 P4 AUC 0.5 0.55 0.6 0.65
(b)ISI=150 ms.
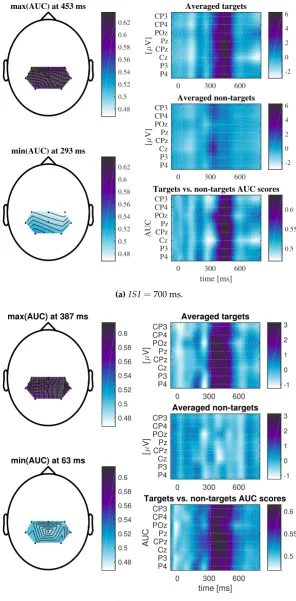
Figure 5.AUC analysis of ERP responses in efferent vmoBCI. The left column head topographic plots depict the latencies with the best (maximum) and worse (minimum) of AUC scores. The right column summarizes the ERP responses in form of matrices of all channels and AUC traces at the bottom.
Preprints (www.preprints.org) | NOT PEER-REVIEWED | Posted: 4 October 2016 doi:10.20944/preprints201609.0126.v2
4. Materials and Methods
The visual motion onset stimuli were delivered as colored moving objects on a computer display in moving towards the center (afferent) and off–center (efferent) trajectories as presented in Figures 1a and 1b. The animations were programmed in Processing.org visual programming environment. There were six afferent and eight efferent pattens tested delivered in random order in order to elicit P300 brainwave responses in an oddball style paradigm [1]. The inter–stimulus intervals (ISIs) of 700 ms and 150 ms were chosen. The two different ISI setups were tested in order to evaluate a possible impact of the fast stimulation repetitions on user’s BCI performance (the resulting BCI accuracy) in two different brainwave event related potential (ERP) averaging scenarios using ten or five responses. During the EEG experiments, the users were instructed to watch center of a computer screen and to minimize eye–movements as shown in Figures1aand1b, as well as in online videos from the experiment1. The users responded mentally by confirming/counting only to the instructed visual motion patterns while ignoring the others. The EEG signals were captured with a portable EEG amplifier system g.USBamp (g.tec Medical Instruments, Austria). Eight active wet EEG electrodes were used to capture brainwaves with attentional modulation elucidated, within the event related potentials (ERPs), the so–called “aha-” or P300-responses [1]. The EEG electrodes were attached to the head locationsCP3, CP4, POz, Pz, CPz, Cz, P3, andP4as in 10/10 intentional system . A reference electrode was attached to a left earlobe and a ground electrode on the forehead atFPz position respectively.
The details of the experimental procedures and the research targets of the tpBCI paradigm were explained in detail to the five human users, who agreed voluntarily to participate in the study. The electroencephalogram (EEG) vmoBCI experiments were conducted in accordance with The World Medical Association Declaration of Helsinki - Ethical Principles for Medical Research Involving Human Subjects. The experimental procedures were approved and designed in agreement with the ethical committee guidelines of the Faculty of Engineering, Information and Systems at University of Tsukuba, Tsukuba, Japan (experimental permission no. 2013R7). The average age of the users was of 26.8±10.7 years.
The EEG signals were recorded and preprocessed online by an in–house extended BCI2000 application [17,18] and segmented (“epoched”) as features drawn from ERP intervals of 0∼700 ms. The sampling rate was set to 512 Hz, the high pass filter at 0.1 Hz, and the low pass filter at 40 Hz. The ISI were of 700 ms or 150 ms in two different experimental runs. Each user performed two sessions of selecting six or eight patterns (a spelling of a sequence of digits associated with each tactile pressure pattern) in afferent and efferent visual motion settings, respectively. We performed offline analysis of the collected online EEG datasets in order to test a possible influence of the two ISI settings on the vmoBCI accuracy (compare ERP results in Figures2a,2b,3a, and 3bdepicting an impact of faster ISI on the ERP shapes). The swLDA [16] classifier was applied next, with features drawn from the 0 ∼700 ms ERP intervals, with removal of the least significant input features, havingp > 0.15, and with the final discriminant function restricted to contain a maximum of 60 features.
5. Conclusions
The approach presented shall help, if not to reach the goal, to get closer to our objective of the more user friendly visual BCI design. Thus, we can expect that patients suffering from LIS, as well as healthy users, will be able to use the more perceptually friendly BCI interfaces, according to their intact sensory modalities. We expect that the proposed visual motion onset paradigm shall offer a more efficient and comfortable stimulus–driven BCI alternative.
1 Online demo videos from the vmoBCI experiments: afferent –https://youtu.be/JbdazbFntekand efferent –https://
youtu.be/UaxIQdOctcQcases.
9 of 10
Although the statistical analysis did not yield significant differences between the tested afferent and efferent motion cases, the users preferred the efferent stimuli resulting with better speeds as shown in the example with single ERP classification documented in an online video2.
Still there remains a long path to go before providing a natural and comfortable visual motion onset BCI end–user solution, yet our research has progressed toward this goal as presented in this paper.
Author Contributions:TMR conceived the visual motion onset BCI paradigm; JPJ, CT and TMR designed and performed the experiments; TMR analyzed the data; TMR wrote the paper.
Conflicts of Interest:The authors declare no conflict of interest.
Abbreviations
The following abbreviations are used in this manuscript:
BCI: Brain–computer interface BMI: Brain–machine interface ERP: Event–related potential ISI: Inter–stimulus–interval
swLDA: Stepwise linear discriminant analysis classification
vmoBCI: Visual motion onset stimulus–based brain–computer interface
Bibliography
1. Wolpaw, J.; Wolpaw, E.W., Eds.Brain-Computer Interfaces: Principles and Practice; Oxford University Press, 2012.
2. Chang, M.; Nishikawa, N.; Struzik, Z.R.; Mori, K.; Makino, S.; Mandic, D.; Rutkowski, T.M. Comparison of P300 Responses in Auditory, Visual and Audiovisual Spatial Speller BCI Paradigms. Proceedings of the Fifth International Brain-Computer Interface Meeting 2013; Graz University of Technology Publishing House, Austria: Asilomar Conference Center, Pacific Grove, CA USA, 2013; p. Article ID: 156.
3. Rutkowski, T.M.; Cichocki, A.; Mandic, D.P. Spatial auditory paradigms for brain computer/machine interfacing. International Workshop On The Principles and Applications of Spatial Hearing 2009 (IWPASH 2009) - Proceedings of the International Workshop; , 2009; p. P5.
4. Rutkowski, T.M.; Mori, H. Tactile and bone-conduction auditory brain computer interface for vision and hearing impaired users. Journal of Neuroscience Methods2015,244, 45 – 51.
5. Mori, H.; Matsumoto, Y.; Struzik, Z.R.; Mori, K.; Makino, S.; Mandic, D.; Rutkowski, T.M. Multi-command Tactile and Auditory Brain Computer Interface based on Head Position Stimulation. Proceedings of the Fifth International Brain-Computer Interface Meeting 2013; Graz University of Technology Publishing House, Austria: Asilomar Conference Center, Pacific Grove, CA USA, 2013; p. Article ID: 095.
6. Martinez, P.; Bakardjian, H.; Cichocki, A. Fully online multicommand brain-computer interface with visual neurofeedback using SSVEP paradigm.Computational intelligence and neuroscience2007,2007, 13–13. 7. Halder, S.; Hammer, E.M.; Kleih, S.C.; Bogdan, M.; Rosenstiel, W.; Birbaumer, N.; Kübler, A. Prediction of
Auditory and Visual P300 Brain-Computer Interface Aptitude. PLoS ONE2013,8, e53513.
8. Sakurada, T.; Kawase, T.; Komatsu, T.; Kansaku, K. Use of high-frequency visual stimuli above the critical flicker frequency in a SSVEP-based BMI.Clinical Neurophysiology2014.
9. Aminaka, D.; Makino, S.; Rutkowski, T.M. Classification Accuracy Improvement of Chromatic and High–Frequency Code–Modulated Visual Evoked Potential–Based BCI. InBrain Informatics and Health; Guo, Y.; Friston, K.; Aldo, F.; Hill, S.; Peng, H., Eds.; Springer International Publishing, 2015; Vol. 9250, Lecture Notes in Computer Science, pp. 232–241.
2 Online demo video showing the efferent vmoBCI case in the single ERP averaging case –https://youtu.be/UaxIQdOctcQ.
Preprints (www.preprints.org) | NOT PEER-REVIEWED | Posted: 4 October 2016 doi:10.20944/preprints201609.0126.v2
10. Aminaka, D.; Makino, S.; Rutkowski, T.M. Chromatic and High–frequency cVEP–based BCI Paradigm. 2015 37th Annual International Conference of the IEEE Engineering in Medicine and Biology Society (EMBC). IEEE Engineering in Medicine and Biology Society, IEEE Press, 2015, pp. 1906–1909.
11. Aminaka, D.; Shimizu, K.; Rutkowski, T.M. Multiuser Spatial cVEP BCI Direct Brain-robot Control. Proceedings of the Sixth International Brain-Computer Interface Meeting: BCI Past, Present, and Future; Verlag der Technischen Universitaet Graz: Asilomar Conference Center, Pacific Grove, CA USA, 2016; p. 70.
12. Patterson, J.R.; Grabois, M. Locked-in syndrome: a review of 139 cases. Stroke 1986, 17, 758–64, [http://stroke.ahajournals.org/content/17/4/758.full.pdf+html].
13. Kaufmann, T.; Holz, E.M.; Kuebler, A. Comparison of tactile, auditory and visual modality for brain-computer interface use: A case study with a patient in the locked-in state. Frontiers in Neuroscience
2013,7.
14. Kremláˇcek, J.; Kuba, M.; Chlubnová, J.; Kubová, Z. Effect of stimulus localisation on motion-onset VEP. Vision Research2004,44, 2989–3000.
15. Guo, F.; Hong, B.; Gao, X.; Gao, S. A brain computer interface based on motion-onset VEPs. Engineering in Medicine and Biology Society, 2008. EMBS 2008. 30th Annual International Conference of the IEEE. IEEE, 2008, pp. 4478–4481.
16. Krusienski, D.J.; Sellers, E.W.; Cabestaing, F.; Bayoudh, S.; McFarland, D.J.; Vaughan, T.M.; Wolpaw, J.R. A comparison of classification techniques for the P300 Speller. Journal of Neural Engineering2006,3, 299. 17. Schalk, G.; Mellinger, J. A Practical Guide to Brain–Computer Interfacing with BCI2000; Springer-Verlag
London Limited, 2010.
18. Matsumoto, Y.; Makino, S.; Mori, K.; Rutkowski, T.M. Classifying P300 responses to vowel stimuli for auditory brain-computer interface. Signal and Information Processing Association Annual Summit and Conference (APSIPA), 2013 Asia-Pacific, 2013, pp. 1–5. Paper ID 388.
c
2016 by the authors; licenseePreprints, Basel, Switzerland. This article is an open access article distributed under the terms and conditions of the Creative Commons Attribution (CC-BY) license (http://creativecommons.org/licenses/by/4.0/).