RVC OPEN ACCESS REPOSITORY – COPYRIGHT NOTICE
This is the author’s accepted manuscript of the following article:
Hubel, T. Y., Hristov, N. I., Swartz, S. M. and Breuer, K. S. (2016) 'Wake structure and kinematics in two insectivorous bats', Philosophical Transactions of the Royal Society B: Biological Sciences, 371(1704).
The final publication is available at Royal Society via https://doi.org/10.1098/rstb.2015.0385. The full details of the published version of the article are as follows:
TITLE: Wake structure and kinematics in two insectivorous bats
AUTHORS: Hubel, T. Y., Hristov, N. I., Swartz, S. M. and Breuer, K. S.
JOURNAL TITLE: Philosophical Transactions of the Royal Society B: Biological Sciences
PUBLICATION DATE: September 2016
PUBLISHER: Royal Society
Wake structure and kinematics in two
insectivorous bats
Tatjana Y. Hubel1,2, Nickolay I. Hristov3,4, Sharon M. Swartz1,3, Kenneth S. Breuer1,3
1School of Engineering, and 3Department of Ecology and Evolutionary Biology, Brown University,
Providence, RI 02912, USA
2Structure and Motion Laboratory, Royal Veterinary College, Hatfield AL97TA, UK 4Center for Design Innovation, Winston Salem, NC 27101-4019, USA
Keywords: bat flight, wake structure, flapping flight
ABSTRACT
We compare kinematics and wake structure over a range of flight speeds (4.0-8.2 ms
-1) for two bats that pursue insect prey aerially, Tadarida brasiliensis and Myotis
velifer. Body mass and wingspan are similar in these species, but M. velifer has broader wings and lower wing loading. By using high speed videography and particle image velocimetry of steady flight in a wind tunnel, we show that 3D kinematics and wake structure are similar in the two species at the higher speeds studied, but differ at lower speeds. At lower speeds, the two species show significant differences in mean angle of attack, body-wingtip distance and sweep angle. The distinct body vortex seen at low speed in T. brasiliensis and other bats studied to date is considerably weaker or absent in M. velifer. We suggest that this could be influenced by morphology: 1) the narrower thorax in this species likely reduces the body-induced discontinuity in circulation between the two wings; and 2) the wing loading is lower, hence the lift coefficient required for weight support is lower. As a result, in M. velifer, there may be a decreased disruption in the lift generation between the body and the wing and the strength of the characteristic root vortex is greatly diminished, both suggesting
INTRODUCTION
To fly, animals face a host of physical and biological challenges. The rich diversity of extant flapping flyers encompasses many variations on basic themes, whether one considers aerodynamic force production, control of trajectories in three-dimensional aerial environments, or how flight is employed to obtain food, escape predation or injury, and to reproduce. As the comparative biology of animal flight continues to mature, it has been possible to discern important commonalities in how flying animals interact with the physical world. For example, insects, bats, and birds cruise at similar Strouhal numbers (St=frequency×amplitude/speed; predictor of the unsteadiness of the flow over the wing) [1]; passive rotational damping plays a key role in turning dynamics for all flying animals studied to date [2]; and for some modes of flight, high lift is generated by a stable leading edge vortex in multiple kinds of animals [3-7].
Within these basic similarities, however, distinct differences occur among flying animals at many levels of organization. Body size profoundly influences multiple aspects of flight, from fluid dynamics to muscle physiology to wing loading. Hence flight is experienced quite differently by insects with wings less than one mm in length (e.g. [8]) compared to large migratory birds or raptors (e.g. [9, 10]). Because the four known evolutionary origins of flight are phylogenetically distant, the basic anatomy and material composition of the flight apparatus are fundamentally different in insects, pterosaurs, birds, and bats. Major differences in the mechanical properties of wing tissues can be observed among groups of flying animals (see, for example, [11-15]), and these have significant consequences for flight function. Details of patterns of wing motion, too, differ between insects, birds, and bats. At a finer taxonomic scale, within each of the major lineages of flying animals, wingbeat kinematics can vary substantially among species (e.g.[16-18]). Similarly, some aspects of wake architecture may be characteristic of insects, birds, or bats (see [7]), but there is variation within each group that appears to be associated with kinematics, wing morphology or both (insects: hawkmoths[19]vs locusts[19, 20]; birds:
Morphology, kinematics and flight performance are interrelated, and may be
associated with diverse aspects of a given species’ ecology [25]. However, although correlations between wing geometry and ecology have been sought for several decades (e.g. [25-29], the power of detailed fluid dynamics analysis to improve
understanding of functional differences between species whose flight apparatus shares many similarities has yet to be fully realized (but see [20, 30]).
The choice of study species that exemplify particular traits, from lineages of known phylogenetic relatedness, can provide new insight into associations among wing structure, aerodynamics, and flight capabilities. To date, all but one of the bat species whose wakes have been studied in detail have been similar in feeding ecology (fruit- and nectar-feeding) and were drawn from two rather distantly related families, the Pteropodidae and Phyllostomidae [23, 31-34]. Species of these two families generally have short wings and relatively high wing loading [25, 35] and have similar wake structure over the wingbeat cycle. In contrast, the molossid Tadarida brasiliensis, the Brazilian free-tailed bat, differs from frugivores and nectarivores in flight ecology, wing kinematics, morphology, and wake dynamics [24, 25]. This aerial hunter resembles the common swift (Apus apus) in wing form and wake architecture [24, 36]. This suggests that in both birds and bats, ecology, flight performance,
morphology and aerodynamics can show common patterns of interrelationship, despite fundamental differences in the structure of the flight apparatus in these distantly related flying vertebrates [24].
Here we explore whether there are differences in kinematics and wake structure between two bat species whose ecology is broadly similar but differs in notable ways on a finer scale. For this comparison, we chose species from distantly related families:
Myotis velifer (Vespertilionidae) and Tadarida brasiliensis (Molossidae), who last shared a common ancestor more than 50 million years ago [37]. The two species often share roost sites, are comparable in weight and wingspan and are aerial insectivores, catching their prey on the wing.
associated with great agility (rate at which turns can be initiated) and high efficiency when flying at higher speeds [25, 43, 44]. However, this wing shape requires higher flight speeds to generate sufficient lift to support body weight, suggesting they may also possess lower maneuverability (turning radius at given speed) and poorer
performance at lower speeds [25]. In contrast, M. velifer does not migrate, and instead hibernates in winter. This species hunts closer to the ground, where it likely
encounters more obstacles, such as vegetation and rock formations [45]. It has been reported that the flight of M. velifer is more direct, with less flutter, than that of other species of the genus [39], but not as straight as T. brasiliensis. M. velifer shows a slightly higher aspect ratio than average, though still lower than T. brasiliensis[46].
M. velifer’s low wing loading, relatively long wings and round wing tips are
hypothesized to be associated with slow, economic and maneuverable flight [25, 43, 47].
In this study we compare the kinematics and wake architecture of M. velifer and T. brasiliensis, and hypothesise that these will reflect differences in wing shape and ecology of these two species. We also explored flight speed-dependence of the differences between the species. Due to their ecology, we expected that the migratory
T. brasiliensis might be more tuned towards fast flight, while M. velifer would favour slightly lower speeds. We discuss our findings in the context of similar studies on bats with different ecology and morphology (fruit- and nectar-feeding) and birds with similar aerial foraging strategies.
MATERIALS AND METHODS
We used particle image velocimetry (PIV) and high speed videography to investigate the wake structure of two bat species, M. velifer and T. brasiliensis. Wake structure and kinematics for T. brasiliensis have previously been published [24].
Bats
Morphological descriptors of each individual were extracted from high speed video of flights at low speed (all trials < 5.5 ms-1) using the direct linear transformation (DLT) method[48] for 3D reconstruction.
We selected the point of the wingbeat cycle at which wing extension was greatest, typically close to the middle of the downstroke. Half wingspan (b) was defined as the maximum distance between the point midway between the scapulae and the wingtip at mid-downstroke, and wing chord (c) as the maximum distance between wrist and the tip of the fifth digit (Fig. 1). Wing area (S) was the area enclosed by markers at the midline point between the scapulae, wrist, wingtip, tip of the digit V, and foot. To assess the effect of estimating area by five points instead of the wing outline, we compared area estimated by these two alternatives from dorsal views of low speed flights (one per bat, Fig. 2). Images were selected at maximum wing extension during the downstroke and processed using Adobe Illustrator (Adobe, San Jose, CA). Wing area estimated from a full outline was 1.4% smaller compared to the five point-estimate for T. brasiliensis and 0.7% for M. velifer. We deemed this difference insubstantial relative to the additional data processing required to compute wing area by the full outline method.
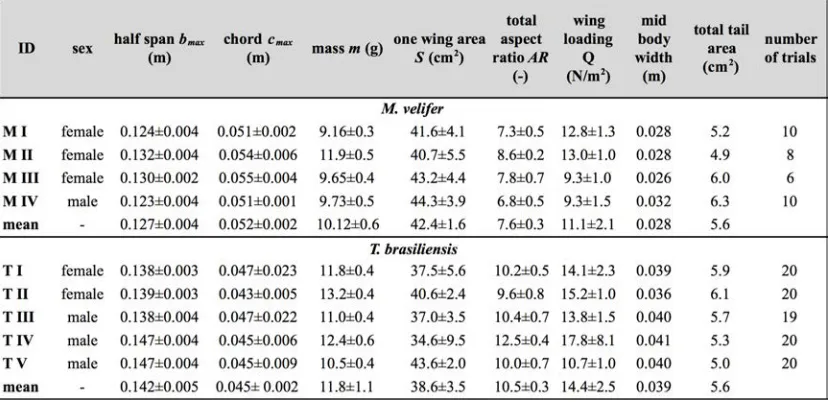
We computed aspect ratio (AR)as 2*(b2/S), and wing loading (Q)as 0.5*mg/S. Tail area and width of the trunk were extracted from the dorsal view of one trial per individual at low speed (Fig. 2). We calculated means and standard deviations for each bat for chord, half wingspan, body mass, wing area, aspect ratio, and wing loading from all complete wingbeat cycles in trials at speeds between 4.0 ms-1 and 5.5 ms-1 (Table 1). Values for morphological parameters such as wingspan and chord measured in this manner in flight can differ from those measured on bats placed in a maximally flattened posture with wing joints maximally extended, but are more directly relevant for specific flight conditions under study [49].
Experimental setup
pixel, lens 85 mm, f/1.4) were positioned downstream from the bats in the test section, stacked vertically to capture slightly overlapping images, yielding a
composite image with final size of 0.25 m x 0.45 m (width x height). Kinematics were recorded by three high-speed video cameras (Photron 1024 PCI, 200Hz, shutter speed 1/1000 s) positioned outside the wind tunnel. 3-D kinematics were reconstructed from five anatomical markers: dorsal midline (between scapulae), wrist, tip of 3rd and 5th digits, and foot (Fig. 1a), using the DLT method. PIV and kinematics were sampled at 200 Hz, producing approximately 25-40 recordings per wingbeat.
Although stationary feeders can be used to train nectar-feeding bats to fly at a given position in a wind tunnel, this approach is not appropriate to insectivorous bats. Instead, the bats flew upstream through the test section somewhat faster than the free stream velocity, although far more slowly than in the presence of no wind. They subsequently landed on a mesh screen after they passed through the measurement volume. The bat was released in front of the PIV cameras and recording was triggered manually after the bat passed the position of the laser sheet. Net or total flight speed (Ut) was the sum of wind tunnel and forward flight speeds. The synchronization
between kinematic and PIV measurements required correction of the “Doppler shift” in the time-resolved PIV fields due to the additional speed of the bats flying towards the front of the wind tunnel [32].
Trials were saved for analysis only when the bat flew straight and level in the middle of the wind tunnel test section, and within the limited observation area of the PIV system. Approximately one in five trials were usable. Bats flew up to 15 times in one session, and individuals rested at least one day between sessions. Flights were
rewarded with a mealworm. The bat’s weight was measured before the first flight and adjusted by the weight of the mealworms consumed over the course of the
experiment. We collected an average of 20 usable trials per individual for T.
brasiliensis and about 9 usable trials per individual for M. velifer. Both species flew over range of speeds with M. velifer covering speeds between 3.8 and 8.2 ms-1 and T.
brasiliensis covering speeds between 4.0 and 9.3 ms-1. We only compared
overlapping speeds from 4.0 ms-1 to 8.2 ms-1, removing one trial below 4.0 ms-1 from
PIV analysis software, DaVis v. 7.2 (LaVision Inc., Ypsilanti, MI, USA) was used to generate the velocity vector fields by applying sequential cross-correlation with multi-pass iterations in decreasing size (128x128 pixel, 2 iterations to 64x64 pixel, 2
iterations, 50% overlap). Vectors with a peak ratio Q of < 1.2 and an average
neighbourhood variation of >1.5 × rms were replaced by post-processing interpolation
and the application of a simple 3 × 3 smoothing filter. Vector fields were then
exported and further processing was conducted in MATLAB (Mathworks Inc., Natick, MA, USA).
Vorticity and swirl were computed to visualize wake structures [24, 33, 50]. Vector fields and vorticity were displayed using a +5 s-1 vorticity threshold (<5% of
maximum vorticity value in trial) to reduce noise. Swirl is closely related to velocity, but distinguishes between shear and rotation [50 ]. By using positive swirl values, thus only displaying rotational information, noise is greatly reduced in the isosurface reconstructions. Vorticity was smoothed using a 3 × 3 smoothing filter, swirl was
calculated, and a threshold of 25 (<1% of maximum swirl value in trial) was applied to eliminate remaining noise. The rotational direction and circulation was determined from vorticity.
Four vortices have been identified in the typical wake of bats [33, 51]: a wingtip vortex, a wing root vortex and a distal wing vortex pair. The circulation for each vortex, over the course of the wingbeat cycle, was calculated by identifying the vortex location manually and integrating vorticity over the surrounding adjacent area after applying a 5 s-1 threshold.
Kinematics were analysed by interpolating information to 40 time points per wingbeat cycle, starting at the upper reversal point of the wingtip. Two surface planes were defined to characterize 3D wing orientation (Fig. 1a): the armwing, defined by wrist, sternum and 5th digit, and handwing, defined by wrist, digit V and wing tip. The following parameters were calculated (Fig. 1):
Flapping frequency, f, wingbeats per second
Downstroke ratio, τ, downstroke period/total wingbeat period, defined by vertical
wingtip motion
Wing stroke amplitude, Θtip, maximum angle of excursion of shoulder to wingtip
over the wingbeat cycle
Span ratio, SR, ratio of upstroke to downstroke wingspan when the wing passed through the horizontal plane (Fig. 1b)
Stroke plane angle, β, angle between a line connecting the wingtip at the upper and
lower reversal point in the side view (xz plane) relative to the horizontal Angle of attack, α, the angle between the armwing surface and the effective air
velocity, the vector sum of net bat speed (Ut), and wing velocity (Fig.1c) (αmd is
at mid-downstrokeand αmean is the average α over the wingbeat cycle)
Wrist sweep angle, φ, rotation of the handwing relative to the armwing, along the axis
defined by wrist and the fifth digit (decrease in φ is a backwards sweeping
motion)
Wrist flexion angle, θ, rotation of the handwing in the axis perpendicular to the
armwing (angle above 180° corresponds to downward flexion)
Analysis
We analysed no more than three wing beat cycles per trial, for a total of 215 wing beat cycles (99 trials) for T. brasiliensis and 70 wing beat cycles (35 trials) for M. velifer. A significance level of 5% was used for all tests, which were performed using SPSS 17.0 (SPSS Inc., Chicago, IL, USA).
estimates of the variance (REML). Wingbeat cycle was treated as a repeated measure and individual as a random effect. To counteract the problem of multiple
comparisons, p-values were corrected using the sequential Holm-Bonferroni method
(p’-values). We then explored the data further by comparing species, as well as
allowing for polynomial functions of second and third order in case of a non-linear
relationship between parameter and speed [52]. Best fit was determined based on
log-likelihood ratio (-2LL) (Fig. 3).
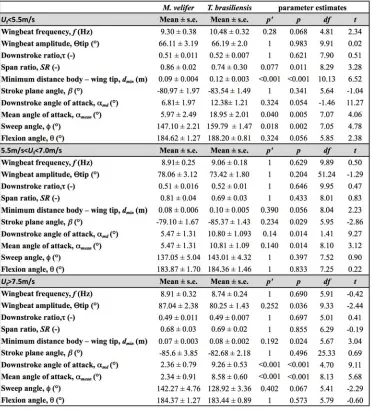
To visualize differences in dynamics and kinematics in relation to speed and to facilitate comparison between the two species (Table 2), we grouped trials into three net flight speed categories: low, 4.0 to 5.5 ms-1; medium, 5.5 ms-1 to 7 ms-1 and high, 7 ms-1 to 8.2 ms-1. Because M. velifer and T. brasiliensis differ little in body mass, we did not normalize the data by flight speed or wing chord. Wing chord-normalised kinematics are presented in supplementary material (Suppl. Fig. 1). A mixed-effect model with individual as random effect, wingbeat cycle as repeated measure, species as fixed effect, and Holm-Bonferroni correction, was used to compare kinematic parameters among the speed groups. To compare wing trajectories and circulation among groups graphically, we first computed averages of the respective variables for all wingbeat cycles within a trial, then averaged all trials for each bat before
computing averages for all bats (see Fig. 4,6). Standard errors are calculated over individuals.
RESULTS
Kinematics
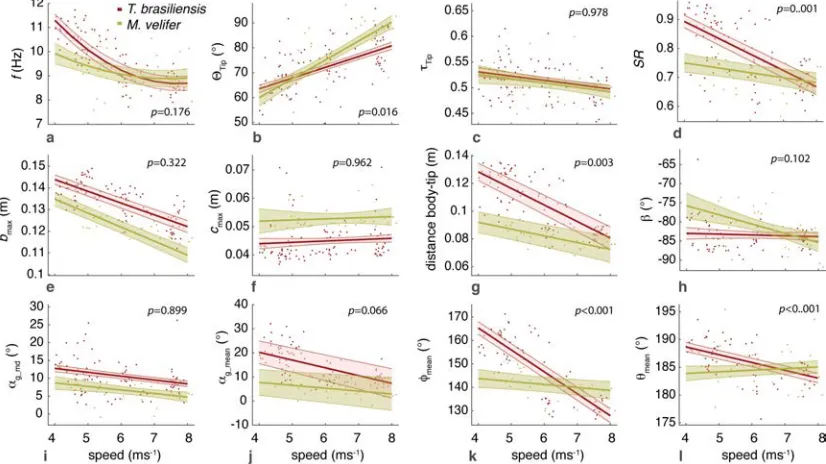
Those flight parameters that change significantly with flight speed change less in M. velifer than T. brasiliensis (Fig. 3). In addition, the two species differ substantially more in their kinematics at low speed (Fig. 3).
Although variation in flight parameters with flight speed is subtle, several parameters change significantly in M. velifer (Suppl. Table 1, speed treated as continuous
speed, while wingbeat amplitude increases (p’<0.001). Frequency (p’=0.098), span ratio (p’=0.895), downstroke angle of attack (p’=1.000), sweep (p’=1.000) and flexion (p’=1.000) angles, downstroke ratio (p’=0.895), stroke plane angle
(p’=0.678), wing chord (p’=1.000) do not change significantly with flight speed. In contrast, in T. brasiliensis, all kinematic parameters except stroke plane angle (p’=0.956) and maximum wing chord (p’=0.956) change significantly with speed. Frequency (p’=0.001), downstroke ratio (p’=0.004), span ratio (p’=0.004), maximum span (p’=0.005), minimum body-wingtip distance (p’=0.005), downstroke angle of attack (p’=0.005), mean angle of attack (p’=0.005), sweep angle (p’=0.005) and flexion angle (p’=0.005) all decreased, while wingbeat amplitude (p’=0.002) was the only parameter that increased significantly (Suppl. Table 1, [24]).
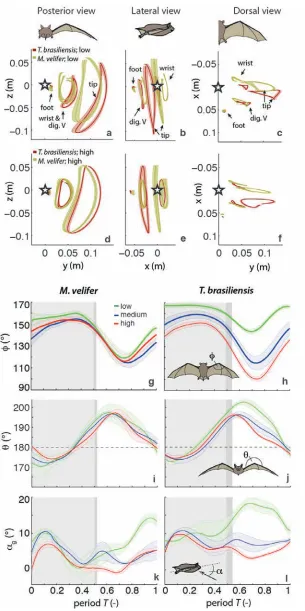
Closer examination of the differences between flight speeds as well as between species were achieved separating kinematics into three flight speed categories. Wing position trajectories confirm that the large-scale spatial geometry of wingbeat
kinematics changes little with speed at the velocities we assessed in M. velifer (Fig. 4a-f,g,i,k, Suppl. Table 1, Table 2). We observed a small shift in absolute position of wingtip and wrist as observed from above, but no accompanying change in pattern of motion (Fig. 4c,f). Differences between speeds are more pronounced in T.
brasiliensis, apparent in the much more extended wing during the upstroke at low speeds (Fig. 4a,d,h,j). M. velifer showsless speed-dependent variation in trajectory of the wrist and digits, wing flexion, sweep angle, and angle of attack than T.
brasiliensis (Fig. 4). Stroke plane is almost vertical in both M. velifer and T.
brasiliensis, and does not change significantly with speed in either species (see above and Suppl. Table 1), nor does this angle differ significantly between the two species (p=0.102, Fig. 3h; also see Fig. 4b,e; Table 2).
In all, kinematics in M. velifer and T. brasiliensis are very similar. When specific kinematic parameters are compared within each speed class, using the mixed effect model with Bonferroni correction (Table 2), no significant difference remains at medium speed and only the angle of attack at mid-downstroke (αmd,p’<0.001) and
mean angle of attack (αmean, p’<0.001) differ significantly at high speeds. The main
angle (p’=0.018), which are greater in T. brasiliensis than M. velifer.
Wake structure
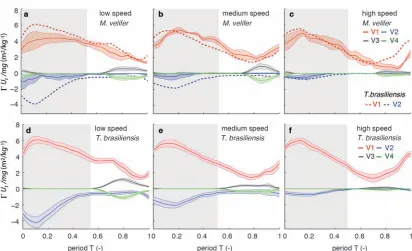
The wakes of M. velifer, visualized from the 2D velocity fields and their subsequent 3D reconstructions, were characterized by the vortex structures typically observed in the wakes of flying bats: a tip vortex (V1), a near-body or root vortex (V2), and a distal vortex pair (V3, V4) observed at the end of the upstroke [23, 24, 32-34, 51, 53] (Fig. 5, Suppl. Fig. 2). Wake patterns of individual wing beat cycles showed
considerable variation, even at similar speeds, but a general pattern can be discerned within the variation. At low speeds, the wingtip vortex was usually present throughout the wingbeat cycle. At moderate and higher speeds, the tip vortex was often greatly diminished during the upstroke, sometimes to a degree that it was no longer
detectable, suggesting that part of the upstroke is aerodynamically passive. The root vortex, shed from wing root at the base of the wing at the body wall, and a distal vortex pair (also known as a “reverse vortex loop”) were detected in some of the trials at all speeds, but frequently fell below the detection threshold of vorticity and swirl. Their occurrence and strength (circulation) diminished as speed increased. Based on the vorticity field, we determined occurrence (O, reported as percentage of all trials within speed group) for the root vortex and distal vortex pair in the three speed categories for both M. velifer and T. brasiliensis (Table 3). Vortex structure varied with speed in both M. velifer and T. brasiliensis (Fig. 5, Fig. 6). The wakes of M. velifer and T. brasiliensis are similar at high speed, where both species are characterized by wakes dominated by a tip vortex that has notable circulation primarily during the downstroke and little vorticity in the upstroke. They are less similar at lower speeds, in which M. velifer often lacks a detectable root vortex, and in the 50% of trials in which it is visible, it is always considerably weaker than in T. brasiliensis (Fig. 6).
DISCUSSION
Flying animals vary greatly in the architecture of the flight apparatus and their
of aerodynamic force production. Researchers have observed some structural features in the wakes of most bat species studied to date, particularly wingtip, wing root and distal paired vortices, for flight behaviour from hovering to moderately high speeds.
Strong tip vortices are universally present throughout bat downstrokes, confirming their dominant role as a signature of lift generation [23, 24, 31, 33]. In most cases, tip vortices persist through the upstroke although they decline in strength, indicating that the upstroke as well as the downstroke is aerodynamically active [31, 33]. However, in T. brasiliensis, at high flight speeds, the tip vortex is greatly diminished or absent for a substantial part of the upstroke, indicating that it is largely aerodynamically passive [24].
Root vortices indicate diminished lift generation over the body relative to the wings; in extreme cases, the body generates no lift, and each wing operates as an independent lifting surface [20, 33, 55, 56]. In this case, root vortices have the same strength as the tip vortices. The distal vortex pair indicates negative lift generation at the distal part of the wing by showing a reversed rotational direction relative to the tip and root vortex pair [51], and it arises at the end of the upstroke, when negative angles of attack are high at the distal part of the wing. Both T. brasiliensis and M. velifer show wingtip, root, and paired distal vortices to various degrees and depending on flight speeds.
The wake structure is directly related to kinematics and morphology; kinematics might be a direct result of the morphology, but it is difficult to separate these factors. Our detailed analysis shows M. velifer and T. brasiliensis are similar in kinematics and wake structure at higher speeds, but show notable differences at lower speeds (Fig. 3,4, Table 2). Despite those differences at low speeds, the flight style of these insectivorous aerial hunters looks similar when compared to that of the frugivorous
phylogenetic; kinematics of phyllostomid fruit- and nectar-feeding bats Glossophaga soricina [57], Leptonycteris yerbabuenae [52], Carollia perspicillata and Artibeus jamaicensis (unpublished data) are similar to those of pteropodids [49] and not to the species in this study (see Suppl. Movie 1-4). In particular,they all show relatively tilted stroke planes, especially at low flight speeds, and substantial flexion in the handwing [52, 57].
Previous studies suggest fruit- and nectar-feeding bats shed root vortices over a broad range of flight speeds [23, 33]. Both aerial hunters in this study show only very weak or non-detectable root vortices at high flight speeds. Moreover, while T. brasiliensis
generates strong root vortices at low speed, M. velifer shows little or no vorticity at the wing root at low speed (Table 3, Fig. 5,6). Weak root vortices over a range of speeds, as shown by M. velifer, have previously been observed in the pied flycatchers (Ficedula hypoleuca) and the blackcaps (Sylvia atricapilla) [4, 21].
An ideal wing has an elliptical circulation distribution and generates a uniform downwash [58, 59]. Span efficiency, a measure of deviation from this ideal, has recently been used to quantify differences in flight performance between species [4, 20, 54]. The instrumentation configuration employed in these experiments (varying distance between the animal and the PIV plane, and the relatively small half-span measurement volume) does not allow sufficiently high resolution quantification of span efficiency. Deformation of the wake and the large variation of the wingspan during the stroke cycle can introduce errors in the determination of both lift and span efficiency [19, 20]. However, although quantitative assessment of aerodynamic efficiency was not feasible, qualitative assessment, using the wake structure, was possible. Root vortices have been observed in diverse taxa [21, 24, 31-33, 36, 56, 60, 61]; they indicate that the circulation over the body is less than over the wings, and have been linked to either a broad body disrupting the downwash profile [56] or the petiolation of the wing [61]. While span efficiency is not a direct measure of flight efficiency, because it neglects analysis of parasite and profile drag, it has been shown to be a good indicator of flight cost [20]. Lower span efficiency (due to lower body lift) is understood to result in a lower lift-to-drag ratio and therefore higher
performance metrics for bodies with very unfavourable lift-to-drag ratios, especially at higher speeds, at which parasite and profile drag increase.
The lack of root vortices at higher speeds in M. velifer and T. brasiliensis suggests efficient flight in both species and corresponds to the predicted low cost of transport in the migratory T. brasiliensis at its ranging speeds.M. velifer is similar, however, to
T. brasiliensis in this respect, despite its different flight ecology, which, based on current records, does not include extensive commuting flight. We suggest that comparisons of flight efficiency at the upper extreme of free-flight speed ranges, exceeding the speeds measured in this study, might be particularly informative.
Strong root vortices appear in T. brasiliensis at lower speeds, at which M. velifer
shows much weaker (lower circulation) and less frequent root vortices. This contrast in wake architecture between the two insectivorous bats suggests a larger difference between body and wing circulation for T. brasiliensis than M. velifer. This difference might arise from any of a number of mechanisms, includingdifferences in lift
generation by the body and/or tail surfaces, differences in body width, or differences in wing loading. Each of these is considered in the following discussion.
Tails play a significant role in lift generation in birds, especially at lower speeds, evidenced by the generation of a distinct tail vortex pair [4, 36]. However, unlike that of birds, the bat tail is connected to the wings via the legs and therefore does not have the potential to be an independent control and lifting surface. Bat species studied to date have little or no tail membrane and bat wakes show no evidence of significant aerodynamic function for the tail [23, 33, 51]. However, both M. velifer and T. brasiliensis possess substantial tail membranes, and, in common with many
insectivorous bats, use tail membranes to capture prey. The ratio of tail to wing area is similar in the two species, (T. brasiliensis: 7.3 ± 0.9%; M. velifer: 6.6 ± 0.6%), and neither showed evidence of tail vortices at any speed. However, we cannot
unequivocally exclude that interspecific differences in tail membrane morphology, such as aspect ratio, could influence the wake structure near the body.
(Fig. 4a-f). Although this approximation has to be treated with some caution, average foot-body angle over the wingbeat cycle suggests a slightly steeper angle for M. velifer (T. brasiliensis: 3.2 ± 5.3°; M. velifer: 9.0 ± 5.1°) which would be better for lift generation, and would thus result in weaker root vortices at low speed than observed in T. brasiliensis. A second potential explanation for the differences in root vortex structure could be that the body of T. brasiliensis is wider than that of M. velifer, which may result in a bigger disruption between the wings (body width 13.8 ± 0.77% of mid-downstroke wingspan in T. brasiliensis, N = 5; 9.5 ± 0.9% in M. velifer, N = 4) (Fig. 2). Lastly, differences in wing loading could contribute to the differences in the root vortex strength at low speed. It has been estimated that wing loading, Q, is almost twice as high for T. brasiliensis as M. velifer [25]. This parameter can,
however, vary substantially depending on the measurement method and current body weight, which fluctuates with many factors. Using the maximum wing area measured in-flight (not including body and tail), our measurements suggest approximately 20% lower wing loading in M. velifer than T. brasiliensis (11.1 ± 2.1 vs 14.4 ± 2.5N/m2), primarily due to lower body mass, coupled with larger wing chord (Table 1).
Although the wing circulation, Γ, for both species is comparable (Γ ∝ Q c), the
coefficient of lift, CL, which scales with wing loading at a given speed, is significantly lower in M. velifer. This reasoning suggests that the induced drag coefficient, CDi, which correlates with the strength of the tip and root vortices, is sharply reduced in M. velifer (CDi ∝ CL2/AR). This argument is further supported by the observation that T. brasiliensis generally shows higher angles of attack than M. velifer, consistent with the generation of a lower coefficient of lift.
preserved in at higher speeds due to considerably higher wing loading than any of the other species (approx. 26 Nm-1).
Both insectivorous bats show wake structures that are associated with economic flight at higher speeds. This comes as no surprise for T. brasiliensis given their extended travel distances. At lower speeds, M. velifer seems to have better flight efficiency, indicated by the lack of root vortices, than T. brasiliensis. However, the complicated relationship between flight performance, morphology and kinematics makes it impossible to conclusively identify a deterministic role of the parameters we
investigated, such as wing loading, aspect ratio, and body width on wake architecture.
Based on the cases in which span efficiency has been used to compare flight
performance between species [4, 20, 54], it has been proposed that birds have superior aerodynamic performance to that of bats [54]. This conclusion relies on the fact that the frugivorous bat species investigated (G. soricina and L. yerbabuenae) have lower lift generation associated with the body region than the birds (flycatchers and
blackcaps), and as a result, possess relatively low span efficiency. However, the aerial hunting bats in the present study showed weak root vortices at high speeds, indicating the participation of the body in lift generation, and thus suggesting a higher span efficiency, perhaps comparable to the aerial-hunting birds. This wide variation in nature of bat wakes emphasizes the aeromechanical diversity of the order, and consequently, generalisations about bat aerodynamic performance should be made with caution. Further studies that sample a greater diversity of species are needed to elucidate the degree to which the morphologies, kinematics and aerodynamics of birds and bats result from phylogenetic constraints and/or ecological requirements.
ACKNOWLEDGEMENTS
ETHICS
All experiments and animal husbandry complied with a protocol approved by the Brown University IACUC and with USDA regulations.
COMPETING INTERESTS
We have no competing interests.
REFERENCES:
[1] Taylor, G.K., Nudds, R.L. & Thomas, A.L.R. 2003 Flying and swimming animals cruise at a Strouhal number tuned for high power efficiency. Nature 425, 707-‐ 711.
[2] Hedrick, T.L., Cheng, B. & Deng, X. 2009 Wingbeat Time and the Scaling of Passive Rotational Damping in Flapping Flight. Science 324, 252-‐255.
[3] Ellington, C.P., van den Berg, C., Willmott, A.P. & Thomas, A.L.R. 1996 Leading-‐ edge vortices in insect flight. Nature 384, 626-‐630.
[4] Muijres, F.T., Bowlin, M.S., Johansson, L.C. & Hedenstrom, A. 2012 Vortex wake, downwash distribution, aerodynamic performance and wingbeat kinematics in slow-‐flying pied flycatchers. J. R. Soc. Interface 9, 292-‐303. [5] Muijres, F.T., Johansson, L.C., Barfield, R., Wolf, M., Spedding, G.R. &
Hedenström, A. 2008 Leading-‐Edge Vortex Improves Lift in Slow-‐Flying Bats. Science 319, 1250-‐1253.
[6] Warrick, D.R., Tobalske, B.W. & Powers, D.R. 2009 Lift production in the hovering hummingbird. Proceedings of the Royal Society B: Biological Sciences
276, 3747-‐3752.
[7] Bomphrey, R.J. 2012 Advances in animal flight aerodynamics through flow measurement. Evolutionary Biology 39, 1–11.
[8] Miller, L.A. & Peskin, C.S. 2009 Flexible clap and fling in tiny insect flight. J. Exp. Biol. 212, 3076-‐3090.
[9] Portugal, S.J., Hubel, T.Y., Fritz, J., Heese, S., Trobe, D., Voelkl, B., Hailes, S., Wilson, A.M. & Usherwood, J.R. 2014 Upwash exploitation and downwash avoidance by flap phasing in ibis formation flight. Nature 505, 399-‐402. (doi:10.1038/nature12939).
[10] Reynolds, K.V., Thomas, A.L. & Taylor, G.K. 2014 Wing tucks are a response to atmospheric turbulence in the soaring flight of the steppe eagle Aquila nipalensis. J. R. Soc. Interface 11. (doi:10.1098/rsif.2014.0645).
[11] Cheney, J., Konow, N., Middleton, K., Breuer, K., Roberts, T., Giblin, E. & Swartz, S. 2014 Membrane muscle function in the compliant wings of bats. Bioinsp. Biomim. 9, 025007. (doi:10.1088/1748-‐3182/9/2/025007). [12] Laurent, C.M., Palmer, C., Boardman, R.P., Dyke, G. & Cook, R.B. 2014 Nanomechanical properties of bird feather rachises: exploring naturally
[13] Lingham-‐Soliar, T. 2014 Feather structure, biomechanics and biomimetics: the incredible lightness of being. Journal of Ornithology 155, 323-‐336.
[14] Smith, C., Herbert, R., Wootton, R. & Evans, K. 2000 The hind wing of the desert locust (Schistocerca gregaria Forskal). II. Mechanical properties and functioning of the membrane. J. Exp. Biol. 203, 2933-‐2943.
[15] Vincent, J.F. & Wegst, U.G. 2004 Design and mechanical properties of insect cuticle. Arthropod. Struct. Dev. 33, 187-‐199.
[16] Altshuler, D.L., Bahlman, J.W., Dakin, R., Gaede, A.H., Goller, B., Lentink, D., Segre, P.S. & Skandalis, D.A. 2015 The biophysics of bird flight: functional relationships integrate aerodynamics, morphology, kinematics, muscles, and sensors 1. Can. J. Zool. 93, 961-‐975.
[17] Dudley, R. 2002 The biomechanics of insect flight: form, function, evolution, Princeton University Press.
[18] Swartz, S. & Konow, N. 2015 Advances in the study of bat flight: the wing and the wind. Can. J. Zool. 93, 977-‐990.
[19] Bomphrey, R.J., Henningsson, P., Michaelis, D. & Hollis, D. 2012 Tomographic particle image velocimetry of desert locust wakes: instantaneous volumes
combine to reveal hidden vortex elements and rapid wake deformation. J. R. Soc. Interface 9, 3378-‐3386.
[20] Henningsson, P. & Bomphrey, R.J. 2013 Span efficiency in hawkmoths. J. R. Soc. Interface 10, 1742-‐5662 (doi:10.1098/rsif.2013.0099).
[21] Johansson, L.C. & Hedenström, A. 2009 The vortex wake of blackcaps (Sylvia atricapilla L.) measured using high-‐speed digital particle image velocimetry (DPIV). J. Exp. Biol. 212, 3365-‐3376.
[22] Henningsson, P. & Hedenstrom, A. 2011 Aerodynamics of gliding flight in common swifts. J. Exp. Biol. 214, 382-‐393.
[23] Muijres, F.T., Johansson, L.C., Winter, Y. & Hedenström, A. 2011 Comparative aerodynamic performance of flapping flight in two bat species using time-‐
resolved wake visualization. J. R. Soc. Interface 211, 2909-‐2918.
[24] Hubel, T.Y., Hristov, N.I., Swartz, S.M. & Breuer, K.S. 2012 Changes in
kinematics and aerodynamics over a range of speeds in Tadarida brasiliensis, the Brazilian free-‐tailed bat. J. R. Soc. Interface 9, 1120-‐1130.
[25] Norberg, U.M. & Rayner, J.M.V. 1987 Ecological morphology and flight in bats (Mammalia; Chiroptera): wing adaptations, flight performance, foraging strategy and echolocation. Phil. Trans. R. Soc. Lond. B 316, 335-‐427.
[26] Brewer, M.L. & Hertel, F. 2007 Wing morphology and flight behavior of pelecaniform seabirds. J. Morphol. 268, 866-‐877.
[27] Johansson, F., Söderquist, M. & Bokma, F. 2009 Insect wing shape evolution: independent effects of migratory and mate guarding flight on dragonfly wings. Biol. J. Linn. Soc. 97, 362-‐372.
[28] Lockwood, R., Swaddle, J.P. & Rayner, J.M. 1998 Avian wingtip shape reconsidered: wingtip shape indices and morphological adaptations to migration. J. Avian Biol., 273-‐292.
[29] Marchetti, K., Price, T. & Richman, A. 1995 Correlates of wing morphology with foraging behaviour and migration distance in the genus Phylloscopus. J. Avian Biol., 177-‐181.
[31] Hedenström, A., Muijres, F., von Busse, R., Johansson, L., Winter, Y. & Spedding, G. 2009 High-‐speed stereo DPIV measurement of wakes of two bat species flying freely in a wind tunnel. Exp. Fluids 46, 923-‐932.
[32] Hubel, T., Hristov, N., Swartz, S.M. & Breuer, K.S. 2009 Time-‐resolved wake structure and kinematics of bat flight. Exp. Fluids 46, 933-‐943.
[33] Hubel, T.Y., Riskin, D.K., Swartz, S.M. & Breuer, K.S. 2010 Wake structure and wing kinematics: the flight of the lesser dog-‐faced fruit bat, Cynopterus
brachyotis. J. Exp. Biol. 213, 3427-‐3440.
[34] von Busse, R., Waldman, R.M., Swartz, S.M., Voigt, C.C. & Breuer, K.S. 2014 The aerodynamic cost of flight in the short-‐tailed fruit bat (Carollia perspicillata): comparing theory with measurement. J. R. Soc. Interface 11, 20140147.
[35] Hedenström, A. & Johansson, L.C. 2015 Bat flight: aerodynamics, kinematics and flight morphology. The Journal of experimental biology 218, 653-‐663.
[36] Henningsson, P., Muijres, F.T. & Hedenström, A. 2010 Time-‐resolved vortex wake of a common swift flying over a range of flight speeds. J. R. Soc. Interface 8, 807-‐816.
[37] Shi, J.J. & Rabosky, D.L. 2015 Speciation dynamics during the global radiation of extant bats. Evolution 69, 1528-‐1545.
[38] Glass, B.P. 1982 Seasonal movements of Mexican freetail bats, Tadarida brasiliensis mexicana, banded in the Great Plains. Southwest. Nat. 27, 127-‐133. [39] Barbour, R.W.D., Barbour, W.H.R.W. & Davis, W.H. 1969 Bats of America. [40] Williams, T.C., Ireland, L.C. & Williams, J.M. 1973 High altitude flights of the free-‐tailed bat, Tadarida brasiliensis, observed with radar. J. Mammal. 54, 807-‐ 821.
[41] Wilkins, K.T. 1989 Tadarida brasiliensis. Mamm. Species 331, 1-‐10. [42] Nowak, R.M. 1994 Walker's bats of the world, JHU Press.
[43] Norberg, U.M. 1990 Vertebrate flight: mechanics, physiology, morphology, ecology and evolution. Berlin, Springer-‐Verlag.
[44] Findley, J.S., Studier, E.H. & Wilson, D.E. 1972 Morphologic properties of bat wings. J. Mammal. 53, 429-‐444.
[45] Fitch, J.H., Shump, K.A. & Shump, A.U. 1981 Myotis velifer. Mamm. Species
149, 1–5.
[46] Rayner, J.M. 1991 On the aerodynamics of animal flight in ground effect. Philosophical Transactions of the Royal Society of London B: Biological Sciences
334, 119-‐128.
[47] Aldridge, H. 1986 Manoeuvrability and ecological segregation in the little brown (Myotis lucifugus) and Yuma (M. yumanensis) bats (Chiroptera:
Vespertilionidae). Can. J. Zool. 64, 1878-‐1882.
[48] Abdel-‐Aziz, Y. & Karara, H., 1971, Direct linear transformation into object space coordinates in close-‐range photogrammetry, Proceedings of the Symposium on Close-‐Range Photogrammetry Falls Church, Virginia, U.S.A., 1-‐18
[49] Riskin, D.K., Iriarte-‐Diaz, J., Middleton, K.M., Breuer, K.S. & Swartz, S.M. 2010 The effect of body size on the wing movements of pteropodid bats, with insights into thrust and lift production. J. Exp. Biol. 213, 4110-‐4122.
[50] Adrian, R.J., Christensen, K.T. & Liu, Z.C. 2000 Analysis and interpretation of instantaneous turbulent velocity fields. Exp. Fluids 29, 275-‐290.
[52] Von Busse, R., Hedenstrom, A., Winter, Y. & Johansson, L.C. 2012 Kinematics and wing shape across flight speed in the bat, Leptonycteris yerbabuenae. Biology Open 1, 1226-‐1238. (doi:10.1242/bio.20122964).
[53] Hedenström, A., Johansson, L.C., Wolf, M., von Busse, R., Winter, Y. & Spedding, G.R. 2007 Bat flight generates complex aerodynamic tracks. Science
316, 894-‐897.
[54] Muijres, F.T., Johansson, L.C., Bowlin, M.S., Winter, Y. & Hedenstrom, A. 2012 Comparing Aerodynamic Efficiency in Birds and Bats Suggests Better Flight Performance in Birds. PLoS ONE 7, e37335.
(doi:10.1371/journal.pone.0037335).
[55] Henningsson, P., Spedding, G.R. & Hedenström, A. 2008 Vortex wake and flight kinematics of a swift in cruising flight in a wind tunnel. J. Exp. Biol. 211, 717-‐730.
[56] Bomphrey, R.J., Taylor, G.K. & Thomas, A.L. 2009 Smoke visualization of free-‐flying bumblebees indicates independent leading-‐edge vortices on each wing pair. Exp. Fluids 46, 811-‐821.
[57] Wolf, M., Johansson, L.C., von Busse, R., Winter, Y. & Hedenstrom, A. 2010 Kinematics of flight and the relationship to the vortex wake of a Pallas' long tongued bat (Glossophaga soricina). J. Exp. Biol. 213, 2142-‐2153.
[58] Spedding, G. & McArthur, J. 2010 Span efficiencies of wings at low Reynolds numbers. Journal of Aircraft 47, 120-‐128.
[59] Anderson, J.D. 2001 Fundamentals of aerodynamics. 3rd ed, Tata McGraw-‐ Hill Education.
[60] Henningsson, P., Michaelis, D., Nakata, T., Schanz, D., Geisler, R., Schröder, A. & Bomphrey, R.J. 2015 The complex aerodynamic footprint of desert locusts revealed by large-‐volume tomographic particle image velocimetry. J. R. Soc. Interface 12, 20150119.
[61] Brodsky, A. 1991 Vortex formation in the tethered flight of the peacock butterfly Inachis io L.(Lepidoptera, Nymphalidae) and some aspects of insect flight evolution. J. Exp. Biol. 161, 77-‐95.
[62] Davies, N.B. 1977 Prey selection and the search strategy of the spotted flycatcher (Muscicapa striata): a field study on optimal foraging. Anim. Behav. 25, 1016-‐1033.
FIGURES
Figure 1: Anatomical features, marker positions and kinematic parameters. (a) dorsal view; φ, sweep angle, proximal plane is shaded green, distal plane is shaded blue, (b) front view; θ, flex angle; Θ ,amplitude angle (c) simplified side view (wing only); α =
angle of attack, β = stroke plane angle, Ut = total forward speed, vwing = wing velocity at wrist.
Figure 3: Variation in kinematic parameters across flight speed for M. velifer and T.
brasiliensis. (a) frequency, (b) amplitude, (c) downstroke ratio, (d) span ratio, (e)
medium and high speeds, trajectories based on the mean of all individual means in these groups, shaded intervals indicate standard error between individual means. Trajectories displayed at low (a – c) and high (d – f) speeds (medium speed not displayed). (i – l): Speed-‐dependent wrist kinematics M. velifer and T. brasiliensis at low, medium and high speeds; downstroke indicated by shading (downstroke shorter at higher speeds, darker shading indicates period of variation). (g, h) Wrist sweep angle: φ. (i, j) Wrist flexion
angle: θ, dashed line indicates no flexion between proximal and distal wing or ‘flat plate’
condition. (k, l) Angle of attack based on armwing or proximal plane.
Figure 6: Average circulation for each vortex (V1–V4) normalised by speed and body weight (tip vortex: V1, root vortex: V2, distal vortex pair: V3 and V4) for different speed categories. (a-‐c) M. velifer, (d-‐f) T. brasiliensis at (a,d) low, (b,e) medium and (c,f) high speeds. Dashed lines in a-‐c show normalised circulations for tip (V1) and root (V2) vortices in T. brasiliensis. Shaded intervals: Mean +-‐ s.e. of individual means, grey shading denotes downstroke.
TABLES
Table 1: Morphology of study subjects and number of trials analysed for each individual. Note: body width and tail area were from frames of high speed video at time of
maximum wing extension (one per individual). All other means (+ S.D.) were extracted from flights at low speed from of a total of 25 wingbeat cycles in M. velifer and 57 in T.
Table 2: Kinematics in Myotis velifer and Tadarida brasiliensis for three flight speed categories. Means, p-‐ and p’ corrected p-‐values (using sequential Bonferroni), degrees of freedom and t-‐values.
Table 3: Percentage occurrence, O, of root (V2) and distal vortex pair (V3/V4) in relation to species and speed category, based on manual assessment of vorticity fields with a noise reduction threshold of + -‐5 s-‐1 vorticity.
SUPPLEMENTARY MATERIAL
Suppl. Fig. 1: a – f: Average trajectory of the wingtip, wrist, tip of digit V (dig. V), and ankle in body-‐referenced coordinate system, normalized by wing chord for M. velifer (green) and T. brasiliensis (brown). Star indicates body marker position. For graphic comparison trials were grouped in low, medium and high speeds. Trajectories displayed from low (a – c) and high (d – f ) speeds (medium speed not displayed).
Suppl. Fig. 2: Vector velocity fields and streamwise velocity for and M velifer (a-‐d, at speed 4.81 ms-‐1) T. brasiliensis (e-‐l, at speed 5.1 ms-‐1). Mid upstroke (a, e), upper reversal point (b, f), mid downstroke (c, g), lower reversal point (d, h). Star: position of midline trunk marker, wrist trajectory: black line. wingtip trajectory: green line, location of marker at point of cycle depicted in image indicated by open circle (wrist = black, wingtip = green). V1: tip vortex, V2: root vortex, V3 and V4: distal vortex pair.
Suppl. Table 1: Change in kinematics with flight speed in (a) M. velifer and (b) T.
brasiliensis. p’-‐values: p-‐values corrected using sequential Bonferroni. (N = 5
individuals; n = 71 wingbeat cycles). Grey arrows indicate significance for only uncorrected p-‐values. Linear mixed effect model.