Interpersonal Affect Improvement Strategies Questionnaire
Belén López-Pérez & Ellie Wilson
Plymouth University, School of Psychology, UK
Daniel Morillo
Facultad de Psicología, Universidad Autónoma de Madrid
*Correspondence should be addressed to Belén López-Pérez (B-214 School of Psychology, Plymouth University, Drake Circus, PL4 8AA, Plymouth, UK)
Email address: [email protected]
This is the peer reviewed version of the following article: (Lopez-Perez, B., Morillo, D. & Wilson, E. Interpersonal Affect Improvement Strategies Questionnaire. European Journal of
Psychological Assessment). This article may be used for non-commercial purposes in accordance
Abstract
This research outlines the development and validation of a new self-report measure to assess the tendency to use different interpersonal affect improvement strategies within the normal adult population (Interpersonal Affect Improvement Strategies Questionnaire; IAISQ). The scale is based on the interpersonal affect classification (Niven, Totterdell, & Holman, 2011) and accurately distinguishes between the two primary means suggested in that model: positive engagement and acceptance. Through four studies we tested the factor structure, reliability, content, criterion, and predictive validity of the scale.
Development and Validation of the Interpersonal Affect Improvement Strategies
Questionnaire
Interpersonal emotion regulation (ER) is any process with the motivation to change (i.e., improve or worsen) others’ affective states (Niven, Totterdell, & Holman,2009; Niven, Totterdell, Stride, & Holman, 2011). Although most research has traditionally focused on intrapersonal ER (e.g., Eisenberg, 2000; Gross, 2007; Thompson, 1994), recent studies have started looking at interpersonal ER, its consequences, and underlying motivations (e.g., Berrios, Totterdell, & Niven, 2014; Netzer, Van Kleef, & Tamir, 2015; Zaki & Williams, 2013). In fact, no previous measurement existed until the emergence of two overarching classifications: Williams’ (2007) Interpersonal Emotion Management (IEM) model and Niven et al.’s (2009) Interpersonal Affect Classification (IAC).
validity was appropriate as situation modification, attention deployment, and cognitive change scales correlated positively with empathy and emotional intelligence, whereas modification of the emotional response scale showed a negative correlation. Finally, the questionnaire also showed good predictive validity as the scores on situation modification and cognitive change positively impacted the trust in one’s supervisor. Although the psychometric properties were adequate, its application was focused exclusively in the organizational setting (Little et al., 2012) and therefore, its validity outside that context is still pending. Furthermore, the formulation of some of the items is repetitive (e.g., “when others are experiencing undesirable emotions, I tell them not to express them” vs. “I encourage others not to express their emotions”), which may artificially increase the internal consistency of the subscales.
feel valued). Affect worsening would include: negative engagement (i.e., any strategy to engage with the target’s feelings and behaviors in order to make them feel worse) and rejection (i.e., a lack of care for the target). The model makes a further distinction in each primary motive suggesting secondary means people may use to change others’ mood. Namely, in affect improving, positive engagement would comprise affective engagement (i.e., engaging directly with the target’s feelings through listening, talking about the target’s situation, reminding the target they did fine before, etc.) and cognitive engagement (i.e., changing the way a target thinks about a situation through highlighting others’ support, rationalizing, etc.). The primary mean of acceptance would comprise the secondary means of humor (i.e., improving the target’s mood through acting silly, laughing, etc.) and attention (i.e., any action that implies giving the target consideration or diverting their attention away) (see Appendix A). Although the IAC suggested different secondary means, only primary means have been tested in regard to the effect of using different strategies in the agent and the target’s well-being (e.g., Niven, Macdonald, & Holman, 2012).
differing correlations with personality, emotion regulation ability, and health-impairment scales. However, it does not allow the assessment of specific strategies, either by secondary or primary means, but a general tendency to engage in interpersonal affect improvement and worsening, which limits the scope of information which can be gained from this questionnaire.
Present Research
Given the limitations of the existing measures, the aim of this research is to create the IAISQ (Interpersonal Affect Improvement Strategies Questionnaire) in order to assess the specific strategies people may use to improve others’ mood, based on the model by Niven et al (2009). We argue it is important to make a distinction between different forms of affect improvement for different reasons. Firstly, previous research has shown different developmental patterns for concrete affect improvement strategies (López-Pérez, Wilson, Dellaria, & Gummerum, 2016). In this regard, positive engagement strategies were used significantly more by older children, whereas acceptance strategies were used most frequently by younger children. Secondly, research from the organizational setting has shown how the use of cognitive strategies may impact positively on the trust in a supervisor, whereas attentional or behavioral strategies (e.g., acceptance) may have no impact at all (Little et al., 2012).
interpersonal ER by allowing researchers to compare people’s reports on the strategies outlined from different theoretical models. Thus, it may help to determine whether both interpersonal ER models are complimentary or whether one may be more predictive than other for a specific outcome. Finally, as Niven et al.’s (2009) classification has not been tested empirically, we aim to explore whether the suggested items relying on the IAC capture (a) the four concrete strategies suggested in the model (i.e., affective engagement, cognitive engagement, humor, and acceptance); (b) a more global classification focused on the primary means (i.e., positive engagement and acceptance); or (c) a general tendency to employ affect improvement strategies, as found by Nivel et al. (2011). In order to test this, in Study 1 we presented the development of the questionnaire and tested its reliability and factor structure through an Exploratory Factor Analysis (EFA). In Study 2 we assessed the questionnaire’s factor structure validity with a cross-validation sample, and construct and convergent validity with other measures. Study 3 introduced a preliminary study of the predictive validity of the IAISQ, testing whether the scales of positive engagement and acceptance predicted what people reported doing to improve people’s mood with a time lapse of a week. Finally, in Study 4 we continued testing the IAISQ predictive validity with a qualitative approach through the use of diaries during a two-week period of time and testing whether the IAISQ scales may predict those responses one month later.
Study 1: Development of the IAISQ
tested whether they may be grouped in four factors (according to the secondary means), in two factors (according to the primary means), or in a single affect improvement factor.
Method
Participants. Two-hundred and twenty-nine individuals (55% females), aged between 18 and 74 years (M = 33.72 years, SD = 13.63) completed the 29-item IAISQ scale.
Participants were recruited through a participation pool system at the authors’ institution where people can sign up to participate in studies in exchange for credit or economic rewards (£4/30 minutes). Concerning their education, 11% had finished high school, 27% had obtained an associate’s degree, 48% a bachelor’s degree, and 14% a master’s or doctorate degree. Sample size was determined according to best practices in Exploratory Factor Analysis, having at least a ratio between 5 and 10 participants per item (Costello & Osborne, 2005).
Procedure
Item generation. The item-development followed a three-step process, using a
intended to measure. From these ratings, 40 items were selected to assess the four constructs. After that, we asked twenty external judges, who signed up to complete the task through the authors’ institution participation pool system, (9 females and 11 males; age range from 21 to 34, Mage = 26.05 and SDage = 5.09) to complete a categorization task where they were instructed to assign the items to five possible categories: ‘affective engagement’ (e.g., ‘When a relative comes to me upset, I will remind them that they have done well in a similar situation before’); ‘cognitive engagement’ (e.g., ‘When my friends are confused about a situation, I discuss the different options with them’); ‘humor’ (e.g., ‘When a friend is low I will tell them a joke’); ‘attention’ (e.g., ‘I will try to focus a friend’s attention away if I see something is making them upset’); and ‘not sure’. We decided to use twenty judges as Tullis & Wood (2004) found that the reliability from card-sort tasks does not substantially increase when samples exceed twenty. Twenty-nine items out of the original forty were correctly identified in the intended category by all judges and were kept for the application of the scale.
Scale Administration. Participants signed up to the study through the participation
system at the authors’ institution and received £4 or a credit for their participation. After signing the consent form participants were asked to complete the 29-item version of the IAISQ. When finishing, participants were debriefed.
Data analysis. Mplus 7 software was used to conduct an Exploratory Factor Analysis
The number of factors to retain was determined on the basis of the goodness-of-fit indices (GOF), as well as an optimal implementation parallel analysis (Timmerman & Lorenzo-Seva, 2011). The GOF indices used in this study were: (a) The Root Mean Square Error of Approximation (RMSEA); (b) the Comparative Fit Index (CFI); and (c) the Tucker-Lewis Index (TLI). RMSEA is considered acceptable at values lower than 0.06 (Hu & Bentler, 1999). CFI and TLI are considered to give evidence of acceptable fit at values over a .90 threshold (Bentler & Bonett, 1980), and an excellent fit at .95 (Hu & Bentler, 1999).
To conduct the parallel analysis, the package psych in R 3.1.2 was used; the polychoric correlation matrix was used, along with the Weighted Least Squares factor extraction method (number of iterations = 100, threshold = 95% quantile of the random correlation matrix distribution).
Results and Discussion
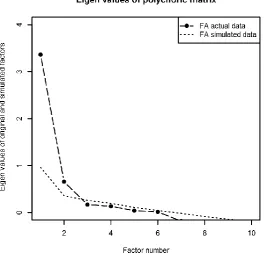
Figure 1 shows the results of the parallel analysis. According to this, the final questionnaire was determined to be properly modelled by two latent factors. This solution accounted for 43.64% of the total variance, and it showed an acceptable fit, with an RMSEA of 0.079 (p (RMSEA > 0.06) > .05), CFI = .967, and TLI = .943). The single factor solution, however, lacked acceptable fit (RMSEA = 0.132, CFI = .874, and TLI = .838) and it fit significantly worse than the 2-factor solution (Δχ2 = 90.392, p-value < .0005).
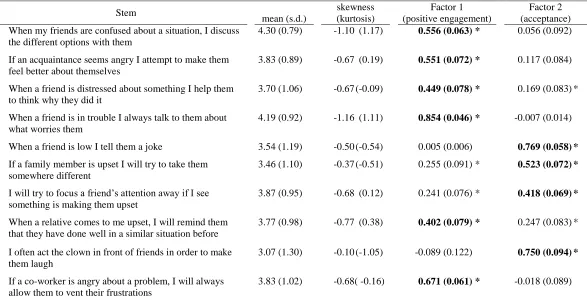
The correlation between the two latent factors was positive (r = .436; s.e. = 0.095), which suggests that there is a tendency to use both types of strategies or neither of them. The first factor included 6 items categorized a priori as belonging to either ‘cognitive’ or ‘affective engagement’ in the secondary means interpretation, that is, ‘positive engagement’ according to the primary means interpretation (see Appendix A). The second factor included four items categorized previously as either ‘attention’ or ‘humor’, that is, ‘acceptance’ according to the primary means interpretation. Thus, our results replicated the two primary motives suggested by the IAC (Niven et al., 2009), rather than the distinction of four different strategies or a single interpersonal affect improvement factor. We computed the reliability of each scale through McDonald’s (1999) omega, being .78 for Factor 1 (i.e., positive engagement) and .74 for Factor 2 (i.e., acceptance).
In sum, the obtained results suggested that the proposed items, based on the four secondary motives, did not reflect a four-factor structure, but instead a two-factor model based on the primary means suggested by the IAC. In actual fact, during the refinement iterations at least one four-factor solution was reached, but it was hardly interpretable because: a) the structure was too complex, with several items loading in two or three factors, and b) the four factors did not clearly group items that were theoretically expected to measure the same dimension. By contrast, the final solution captured the primary means distinction, so that items were grouped in factors according to the expected concrete strategies. That is, ‘positive engagement’ comprised items of affective and cognitive engagement, whereas ‘acceptance’ comprised items of humor and attention. The different factor solutions with the 29 original items, including parallel analysis, model fit indices, and item loadings, can be found in Appendix B.
Results from Study 1 showed a two-factor solution, which captured the two primary means suggested by Niven et al. (2009). Furthermore, these two factors showed appropriate internal consistency. However, further tests were needed in order to conclude about the IAISQ construct and convergent validity. To that aim, in the present study we assessed the relation between the IAISQ scales and several measures. Additionally, we evaluated whether the obtained factor structure could be replicated in a larger sample through CFA.
Concerning construct validity, we expected both factors of the IAISQ to correlate positively with the scales of the EROS (i.e., intrinsic and extrinsic affect improvement), as they both assess the same construct (i.e., affect improvement), and previous research has also shown the close link between intrapersonal and interpersonal ER (Niven et al., 2011). Concerning the correlation with the scales of the IEM we expected both IAISQ factors to correlate positively with the IEM’s scales of situation modification, attention deployment, and cognitive change, as these strategies are aimed at improving the target’s affect (Little et al., 2012). However, we expected higher correlations between cognitive change and IAISQ’s positive engagement, as this factor contains strategies aimed at changing the target’s style of thinking. Furthermore, we also expected a higher correlation between attentional deployment and IAISQ’s acceptance, as the latter also comprised attention deployment in its definition and in its items. Finally, we expected no correlation between both IAISQ factors and the scale modulation of response, as this latter strategy does not aim to help the target to improve their mood but suppress their emotional experience instead.
Finally, we also explored gender differences in interpersonal ER as previous research has pointed out that they may be at the root of possible gender differences in emotionality. Research on emotionality has found mixed results in regard to whether women tend to be more emotional than men. Studies focused on self-report measures have indeed found such effect (e.g., Lucas & Gohm, 2000); however, studies conducted with physiological measures have found mixed results (e.g., Kelly, Tyrka, Anderson, Price, & Carpenter, 2008; Kring & Gordon, 1998). Given that women and men may differ in their emotionality levels, they may vary in ER (McRae, Oschner, Mauss, Gabrieli & Gross, 2008). From an intrapersonal ER perspective, there have been mixed results, as some studies have found gender differences (e.g., Eschenbeck, Kohlmann & Lohaus, 2007; Garnefski, Teerds, Kraaij, Legerstee, & Van Den Kommer, 2004; Nolen-Hoeksema & Aldao, 2011) whereas others have not (e.g., Barrett, Robin, Pietromonaco & Eysell, 1998; McRae et al., 2008). At an interpersonal ER level, there is no previous literature in regard to whether there are gender differences associated with the use of specific strategies. Thus, we cannot pose any hypothesis. However, it is important to test for gender invariance (i.e., if there were gender differences in the structure) as this will not also provide more information about the scale functioning but it will also expand our knowledge about possible gender differences in the interpersonal domain of emotion regulation.
Method
Participants. Five hundred and seventeen people (59% female), aged between 18 and 76 years (M = 35.84 years, SD = 12.58) completed the 10-item IAISQ scale along with other measures. Participants were recruited at the authors’ institution through the participation pool
system in exchange for course credit or £4. Concerning their education level, 12% had finished high-school, 26% had a professional degree, 50% had a Bachelor’s degree, and 12%
achieve a power of at least .80 with 26 degrees of freedom for the test of close fit, as the
minimum sample size recommended for these parameters is around 363 people (MacCallum,
Browne, & Sugawara, 1996).
Measures
Participants completed a number of measures in addition to the identical Interpersonal Affect Improvement Strategies Questionnaire (IAISQ) as in Study 1. All measures completed by participants have been reported.
Emotion Regulation of Others and Self (EROS; Niven et al., 2011). We used two out of the four scales, 12 items in total, to assess extrinsic and intrinsic affect improving. Extrinsic affect improvement is a 6-item scale which assesses the tendency to deliberately attempt to improve another person’s feelings (e.g., “I listened to someone’s problems to improve their mood”; α = .87 in this study). Intrinsic affect improvement is a 6-item scale which evaluates the tendency to deliberately attempt to improve one’s own feelings (e.g., “I did something I enjoyed to improve my mood”; α = .89 in this study).
emotional response (i.e., suppressing emotional responses; e.g., “I encourage others to keep their emotions for themselves”; α = .85 in this study).
Extraversion and Agreeableness (NEO-FFI; Costa & McCrae, 1992). We selected these traits as previous research showed a positive relation between them and interpersonal ER (Niven et al., 2009). Extraversion is a 12-item scale which assesses the tendency to be sociable, talkative, and to seek stimulation in the company of others (e.g., “I really enjoy talking to people”; α = .75 in this study). Agreeableness is a 12-item scale which evaluates the tendency to be compassionate and cooperative (e.g., “I would rather cooperate with someone than compete with them”; α = .84 in this study).
Procedure. Participants signed up through the participation system at the author’s institution. After signing the consent form, participants were asked to complete the four scales in a random order in order to validate the IAISQ. When finishing, participants were debriefed.
supposed to load on each scale. Then, based on this strategy, successive, increasingly parsimonious models were fit to the dataset, until an interpretable solution was found.
Finally, gender differences were tested using a multigroup CFA analysis. We started from the factor structure previously obtained. However, instead of WLSMV, we applied a ML estimation (i.e., considering the items as continuous variables).
Results and Discussion
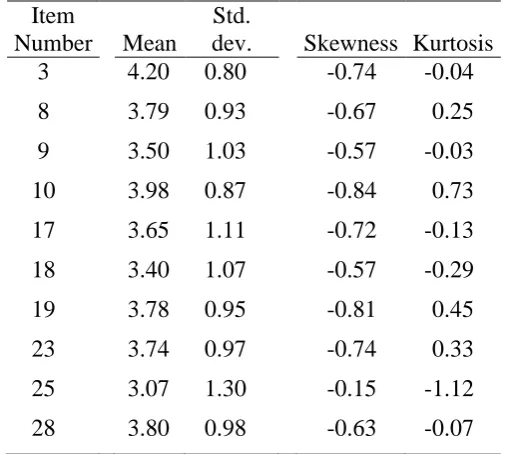
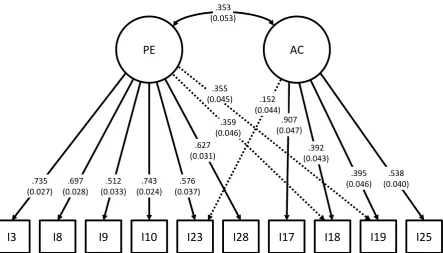
Confirmatory Factor Analysis (CFA). We assumed that the latent factor structure would be an independent cluster solution, such that each item would only load in one out of the two possible factors, according to the secondary means classification prediction. Given that the GOF indices were not satisfactory (RMSEA = 0.100; CFI = .928; and TLI = .905), we decided to include some crossed loadings in the model. These additional parameters showed significant, relatively high values in the EFA (see Table 1), and had the highest modification indices; thus, they were not due to capitalization on chance (i.e., chance fluctuations from the sample). This final solution showed an acceptable fit (RMSEA = 0.072, p (RMSEA > 0.06) > .05, CFI = .966, TLI =.951; see Figure 2). The descriptive statistics of the items in the cross-validation sample are summarized in Table 2. Although a single factor solution did not show appropriate fit through EFA, we tested again this possibility through CFA. As in the previous study, the resulting model did not show an acceptable fit (RMSEA = 0.169; CFI = .836; and TLI = .779).
between factors was also positive (r = .35; s.e. = .053). We computed the reliability of the scales with McDonald’s (1999) omega obtaining a value of .82 for Factor 1 (i.e., positive engagement) and .70 for Factor 2 (i.e., acceptance).
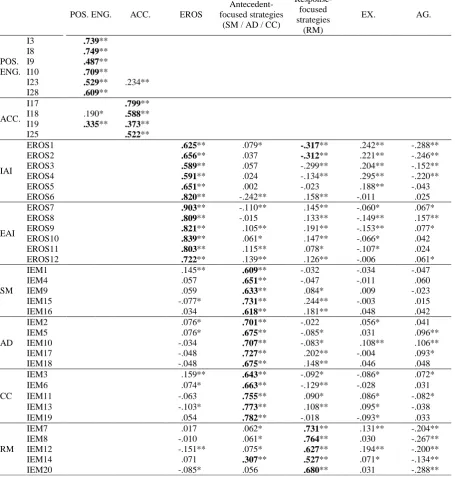
Convergent and Discriminant Validity. The solution found by the ESEM analysis consisted of five factors, besides the two IAISQ latent trait factors, having a good fit (RMSEA = 0.044, p (RMSEA < 0.06) < .001, CFI = .934, TLI =.924). The structure matrix is shown in Table 3, and the factor correlations in Table 4. Table 3 shows that the EROS items were indistinguishable in terms of the dimension measured. Rather, they collapsed into a single factor that was labelled as EROS. This result may be due to the high correlation found in previous literature between intrapersonal and interpersonal ER (Niven et al., 2011). Thus, this suggests that the design of the EROS does not allow discriminating between intrapersonal and interpersonal tendencies in affect improvement.
Concerning the IEMS questionnaire, the scales of situation modification, attention deployment, and cognitive change collapsed into a single factor. We labelled this factor “antecedent-focused strategies”, as according to the PMER these strategies aim to change the emotional response before it takes place through targeting the individual’s situation, attention, or cognition (Gross, 2007). The items of the response modulation scale loaded on a different factor. We labelled this factor “response-focused strategy”, as it aims to change the expression of the emotional response once it has taken place (Gross, 2007). Given the obtained factors, we did not test for correlations between the IAISQ scales and the original IEMS scales.
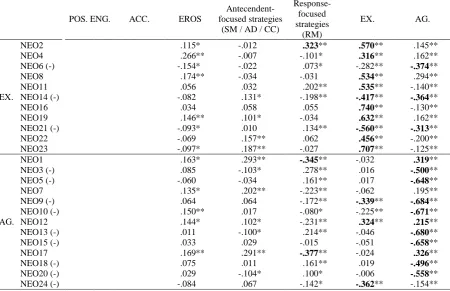
Concerning the correlation between the obtained factors, it is important to note that the correlations with the original EROS and IEMS scales was not testable as the structure found did not replicate the original one. On the other hand, the scales positive engagement and acceptance correlated positively with the EROS factor as expected, as this includes items which target affect improvement in general (Table 4). Both scales also correlated positively with the antecedent-focused strategies factor which comprised the scales situation modification, attention deployment, and cognitive change of the IEM questionnaire. Regarding the factor of response-focused strategy which comprised items of response modulation, results showed a negative correlation with positive engagement and no significant correlation with acceptance. Given that the items of response modulation are focused on suppression (i.e., the tendency to inhibit one’s or others’ feelings; Gross, 2007) we expected no relation with positive engagement, as positive engagement entails improving the feelings of others without attempting to stop them feeling a certain way, but instead listening to the target, making them talk, giving them advice, or trying to change the way they think about the situation. Finally, both positive engagement and acceptance were positively related to the factors of extraversion and agreeableness (see Table 4). This result is coherent with previous research which found a positive correlation between those traits and extrinsic affect improvement (Niven et al., 2012).
invariance was also found between both groups (ΔS-Bχ2 = 11.07, df = 7, p-value = .135; ΔCFI = .004).
Given that partial scalar invariance can be assumed between the two groups, we tested for differences in the distribution of latent traits in the two groups. Neither the model with equal variances (ΔS-Bχ2 = 4.32, df = 2, p-value = .115; ΔCFI = .003) nor the model with equal covariance’s (ΔS-Bχ2 = 0.00, df = 1, p-value = 1.000; ΔCFI = -.001) did show a significant worse fit than the partial scalar model. Thus, these tests supported structural invariance of the model (Dimitrov, 2010). The model with equal means, however, had significantly worse fit than the structural invariant model (ΔS-Bχ2 = 23.97, df = 1, p-value < .001; ΔCFI = .019). From the structural invariant model, we can see that the mean of the distribution of positive engagement for women was 0.426 above the mean for men (z = 4.066, p-value < .001). Although the mean of the distribution of acceptance for women was 0.153 below the mean for men, the value was not significant (z = -1.419, p-value = .156).
Study 3: Testing the IAISQ Predictive Validity in the Laboratory
In the previous studies we tested the IAISQ reliability, factor structure, and its validity in regard to other dispositional measures. In order to test the IAISQ predictive validity (i.e., whether the IAISQ may predict people’s actual interpersonal affect improving means), we asked participants to write down what they usually do in order to improve someone else’s mood, and one week later we asked them to complete the IAISQ. We expected that a higher score of positive engagement in the IAISQ may predict the regular use of positive engagement strategies. Following the same logic, we expected that a higher score in acceptance in the IAISQ may predict the regular use of acceptance strategies.
Method
Participants. Eighty-nine people (54% female) with an age range from 18 to 74 years (M = 35.91; SD = 12.69) took part in this study in exchange for course credit or £4 at the authors’ institution. Concerning their education, 21% had finished high school, 29% had obtained an associate’s degree, 40% a bachelor’s degree, and 10% a master’s or doctorate degree.
Procedure
Coding. Participants’ responses were coded into numerical values using the
definitions of the different primary means (Niven et al., 2009) by two independent coders blind to the research hypotheses. Each statement was coded as: positive engagement (i.e., any strategy that engages with the target’s feelings and cognitions in order to make them feel better) and/or acceptance (i.e., giving the target attention, using humor to improve the target’s mood, and making them feel valued). When participants mentioned two incidents that may fit in different categories the coders registered both events. However, this was only the case for five participants. Inter-rater agreement was excellent, κ = .88 (Cohen, 1960). Disagreements were discussed and consequently resolved by the two coders. Appendix C summarizes the definitions and gives examples of responses coded within each category.
Results and Discussion
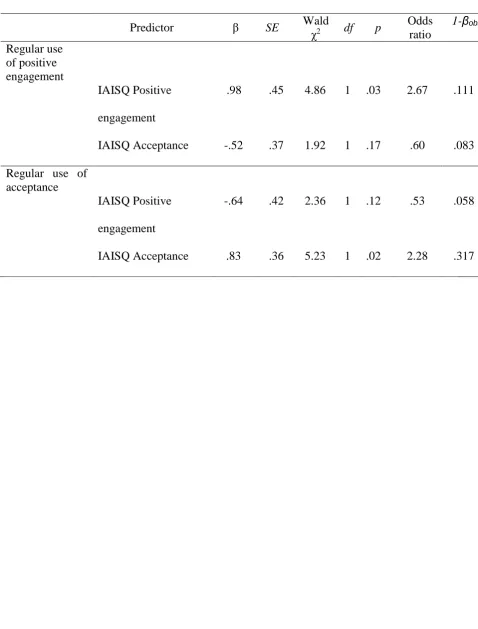
As each open answer was coded into two variables (i.e., positive engagement and acceptance) as either present (1) or absent (0), we ran a logistic regression analysis for each variable, entering the results of the IAISQ scales as predictors. Thus, for the regular use of positive engagement, results showed that the positive engagement scale of the IAISQ predicted it, whereas the scale of acceptance did not (see Table 5). For the regular use of acceptance, results showed the reverse pattern such that the scale of positive engagement did not predict it whereas the scale of acceptance did (see Table 5).
usually do, but instead they may have recalled the most intense or most recent episode. Finally, due to sample size restrictions in the study design, the observed power for the effects studied was rather low. Hence, these findings may be used as a guide to obtain higher power in future replications aimed to test these effects.
Study 4: Testing the IAISQ Predictive Validity outside the Laboratory with a Diary
Method
In order to overcome the limitation of Study 3 in this study we asked participants to register during a two-week period of time any situation where they aimed to improve someone’s mood using a qualitative diary (Waddington, 2005).
Method
Participants. Twenty-two people (68% female) with an age range from 21 to 58 years-old (M = 30.95; SD = 10.99) took part. Participants were recruited at the authors’ institution through the participation pool system in exchange for course credit. Concerning their education, 11% had finished high school, 20% had obtained an associate’s degree, 54% a bachelor’s degree, and 15% a master’s or doctorate degree.
Procedure
participants were sent a link so they could complete the IAISQ. After the completion of the questionnaire participants were debriefed.
Coding. Participants’ responses in the category “what they did in order to improve the
target’s mood” were coded into numerical values using the definitions of the different means (Niven et al., 2009) by two independent coders blind to the research hypotheses. For each participant, the external judges coded each open answer into two variables (i.e., positive engagement and acceptance) as either present (1) or absent (0). Then, two new variables were created computing for each participant the number of times they used a positive engagement strategy and the number of times they used an acceptance strategy. When participants mentioned two incidents that may fit in different categories the coders registered both events. However, this was only the case of 14 out of 204 registered events. Inter-rater agreement was excellent, κ = .91 (Cohen, 1960). Disagreements were discussed and consequently resolved by the two coders. Appendix D gives examples of responses coded within each category.
Results and Discussion
General Discussion
Only recently has interpersonal ER been studied and therefore, there are only a limited number of available measures (e.g., EROS, Niven et al., 2012 and IEMS, Little et al., 2012). Given the limitations of the previous questionnaires we aimed to develop a measure that allowed greater discrimination between the different strategies people may use to improve others’ mood, relying on the primary and secondary means suggested by the IAC (Niven et al., 2009).
In regard to the correlation analyses, the high correlation between positive engagement and acceptance with the factor EROS shows how both measures are based on the same theoretical framework, specifically the IAC. Concerning the correlation with the two obtained factors of the IEMS results showed that the IAISQ scale of acceptance did not correlate with the factor of response-focused strategy, whereas positive engagement correlated negatively. This negative correlation may be due to the fact that positive engagement entails an active engagement with the feelings of others without suppressing them. However, acceptance does not entail engaging actively with the target’s feelings, which may explain the lack of correlation. Despite that, future research may need to investigate these relations further. Finally, regarding the two personality factors the obtained results supported previous findings, as positive engagement and acceptance were positively related to extraversion and agreeableness (Niven et al., 2012).
Given that the pattern of correlations between both IAISQ scales and the other questionnaires were similar one may argue that the IAISQ scales are not assessing different strategies, but a general tendency to improve people’s mood or emotions. However, we found this account untenable for different reasons. First, a model with a single, unidimensional affect improvement factor did not show appropriate fit in either study. Second, we found gender differences only for positive engagement but not for acceptance. Finally, both in Studies 3 and 4 participants’ scores in the IAISQ scales did show a different predictive pattern when people were asked about the strategies they used to improve others’ feelings. Thus, all these results indicate that the scales of positive engagement and acceptance are actually tapping two different constructs.
acceptance. These results are in line with previous findings on intrapersonal ER, which showed that women tend to engage more in emotional support and cognitive change (e.g., Nolen-Hoeksema & Aldao, 2011). Thus, given the link between intrapersonal and interpersonal ER (Niven et al., 2011) it is possible that women’s tendency to engage in those strategies may extend from the intrapersonal to the interpersonal domain.
Although the EROS and the IEMS had adequate psychometric properties, we believe that the IAISQ complements both of them. In regard to the EROS, the IAISQ allows discrimination between different strategies to improve the target’s mood or emotions. Although previous research showed that the affect improvement scales of the EROS could be separated into intrinsic and extrinsic, results of the current research showed that the items from both scales collapsed into a single factor. Furthermore, unlike the EROS, the IAISQ has tested its predictive validity in regard to the actual strategy people reported to use and actually used when improving others’ mood. However, more research should be conducted in order to further test the predictive validity of all the available measures. Furthermore, the IAISQ predictive validity is not only restricted to an organizational setting. Likewise, the IAISQ has assessed invariance across genders, whereas both previous measures have not tested for possible gender differences. Finally, by having another measure available that assesses strategies outlined from a different theoretical model (IAC), it will expand future research by enabling researchers to compare different theoretical frameworks when studying interpersonal ER.
which seems to be a great bias in most self-report measures (e.g., Krumpal, 2013 for review). One limitation of the proposed questionnaire is to not have included interpersonal affect worsening, as Niven et al’s (2009) also considered this construct in their model. Future research may need to develop a scale where capturing the tendency to use different affect worsening primary means (i.e., negative engagement vs. rejection). Third, we acknowledge that the sample size of Studies 3 and 4 may not be large enough to achieve adequate observed power in some effects. However, the obtained results suggest that there is a significant effect that accounts for the predictive validity of the scales and this informs future research of the obtained power when designing similar studies. Finally, future research may need to conduct stringent tests by including other predictors such as personality traits or different
intrapersonal emotion regulation strategies to determine whether the strategies used at an interpersonal level in real life can only be predicted by IAISQ scales or can also be explained by other constructs.
References
Aluja, A., Kuhlman, & M., Zuckerman, M., (2010). Development of the Zuckerman– Kuhlman–Aluja personality questionnaire (ZKA-PQ): a factor/facet version of Zuckerman–Kuhlman personality questionnaire (ZKPQ). Journal of Personality Assessment, 92, 416–431.
Barrett, L.F., Robin L., Pietromonaco, P.R. & Eyssell K.M., (1998). Are women the “more emotional” sex? Evidence from emotional experiences in social context. Cognition & Emotion, 12, 555–578.
Bentler, P. M., & Bonett, D. G. (1980). Significance tests and goodness of fit in the analysis of covariance structures. Psychological Bulletin, 88, 588–606.
Berrios, R., Totterdell, P. & Niven, K. (2014). Why do you make us feel good? Correlated and Interpersonal Consequences of Affective Presence in Speed-dating. European Journal of Personality, 29, 72-82.Cohen, J. (1960). A coefficient of agreement for nominal scales. Educational and Psychological Measurement, 20, 37–46.
Cohen, J. (1988). Statistical power analysis for the behavioral sciences (2nd ed). Hillsdale [etc.]: Lawrence Erlbaum Associates.
Costa Jr, P. T., & McCrae, R. R. (1992). Reply to Ben-Porath and Waller. Psychological Assessment, 4, 20–22.
Costello, A. B., & Osborne, J. W. (2005). Exploratory Factor Analysis: Four recommendations for getting the most from your analysis. Practical Assessment, Research, and Evaluation, 10, 1–9.
Eisenberg, N. (2000). Emotion, regulation and moral development. Annual Review of Psychology, 51, 665–697.
Eschenbeck, H., Kohlmann, C.W., Lohaus, A. (2007). Gender differences in coping strategies in children and adolescents. Journal of Individual Differences, 28, 18–26.
Faul, F., Erdfelder, E., Buchner, A., & Lang, A.-G. (2009). Statistical power analyses using G*Power 3.1: Tests for correlation and regression analyses. Behavior Research
Methods, 41, 1149-1160. Garnefski, N., Teerds, J., Kraaij, V., Legerstee, J., & Van den Kommer, T. (2004). Cognitive emotion regulation strategies and depressive symptoms: differences between males and females. Personality and Individual Differences, 36, 267–276.
Gross, J.J. (2007). Handbook of emotion regulation. New York: Guilford Press.
Hu, L., & Bentler, P. M. (1999). Cutoff criteria for fit indexes in covariance structure analysis: Conventional criteria versus new alternatives. Structural Equation Modeling, 6, 1–55.
Kelly, M. M., Tyrka, A. R., Anderson, G. M., Price, L. H., & Carpenter, L. L. (2008). Sex differences in emotional and physiological responses to the Trier social stress test. Journal of Behavior Therapy and Experimental Psychiatry, 39, 87–98.
Kring, A. M., & Gordon, A. H. (1998). Sex differences in emotion: Expression, experience, and physiology. Journal of Personality and Social Psychology, 74, 686–703.Krumpal, I. (2013). Determinants of social desirability bias in sensitive surveys: a literature review. Quality & Quantity, 47, 2025–2047.
López-Pérez, B., Wilson, E., Dellaria, G. & Gummerum, M. (2016). Developmental differences in children’s interpersonal emotion regulation. Motivation & Emotion.
Lucas, R. E., & Gohm, C. L. (2000). Age and sex differences in subjective well-being across cultures. In E. Diener & E. M. Suh (Eds.), Culture and subjective well-being (pp. 291– 318). Cambridge, MA: MIT Press
MacCallum, R. C., Browne, M. W., & Sugawara, H. M. (1996). Power analysis and determination of sample size for covariance structure modelling. Psychological Methods, 1, 130–149.
McDonald, R. P. (1999). Test theory: A unified treatment. Mahwah, N.J: L. Erlbaum Associates.
McRae, K., Ochsner, K., Mauss, I.B., Gabrieli, J.D.J., & Gross, J.J. (2008). Gender Differences in Emotion Regulation: An fMRI Study of Cognitive Reappraisal. Group Processes Intergroup Relations, 11,143–162.
Muthén, L. K., & Muthén, B. O. (1998-2012). Mplus User’s Guide. Seventh Edition. Los Angeles, CA: Muthén & Muthén.
Netzer, L., Van Kleef, G. A., & Tamir, M. (2014). Interpersonal instrumental emotion regulation. Journal of Experimental Social Psychology, 58, 124–135.
Niven, K., Macdonald, I., & Holman, D. (2012). You spin me right round: Cross-relationship variability in interpersonal emotion regulation. Frontiers in Psychology (Special issue on The Social Dimension of Emotion Regulation).
Niven, K., Totterdell, P., Stride, C. B., & Holman, D. (2011). Emotion Regulation of Others and Self (EROS): The development and validation of a new individual difference measure. Current Psychology: A Journal for Diverse Perspectives on Diverse Psychological Issues, 30, 53–73.
Nolen-Hoeksema, S. (2012). Emotion regulation and psychopathology: the role of gender. The Annual Review of Clinical Psychology, 8, 161–187.
Nolen-Hoeksema. S., & Aldao, A., (2011). Gender and age differences in emotion regulation strategies and their relationship to depressive symptoms. Personality and Individual Differences, 51, 704–708.
Parkinson, B., & Totterdell, P. (1999). Classifying affect regulation strategies. Cognition and Emotion, 13, 277–303.
Sahdra, B. K., Shaver, P. R., & Brown, K. W. (2010). A scale to measure nonattachment: a buddhist complement to western research on attachment and adaptive functioning. Journal of Personality Assessment, 92, 116–127.
Satorra, A., & Bentler, P. M. (1988). Scaling corrections for chi-square statistics in covariance structure analysis. In A. Satorra & P.M. Bentler (1988). Scaling corrections for Chi-square Statistics in Covariance Structure Analysis. Proceedings of theBusiness and Economic Section pp. 313). Virginia: American Statistical Association.
Schipper, M., & Petermann, F. (2013). Relating empathy and emotion regulation: Do deficits in empathy trigger emotion dysregulation? Social Neuroscience, 8, 101–107.
Timmerman, M. E., & Lorenzo-Seva, U. (2011). Dimensionality assessment of ordered polytomous items with parallel analysis. Psychological Methods, 16, 209–220.
Tullis, T., & Wood, L. (2004). How many users are enough for a card sorting study? In Proceedings University Press of America 2004, Minneapolis, June 7–11, 2004.
Waddington, K. (2005). Using diaries to explore the characteristics of work-related gossip: Methodological considerations from exploratory multimethod research. Journal of Occupational and OrganizationalPsychology, 78, 221–236.
Williams, M. (2007). Building genuine trust through interpersonal emotion management: A threat management model of trust and collaboration across boundaries. Academy of ManagementReview, 32, 595–621.
Table 1
Standardized Item Factor Loadings of the EFA Solution
Item
number Stem mean (s.d.)
skewness (kurtosis) Factor 1 (positive engagement) Factor 2 (acceptance) 3 When my friends are confused about a situation, I discuss
the different options with them
4.30 (0.79) -1.10 (1.17) 0.556 (0.063) * 0.056 (0.092)
8 If an acquaintance seems angry I attempt to make them feel better about themselves
3.83 (0.89) -0.67 (0.19) 0.551 (0.072) * 0.117 (0.084)
9 When a friend is distressed about something I help them to think why they did it
3.70 (1.06) -0.67 (-0.09) 0.449 (0.078) * 0.169 (0.083) *
10 When a friend is in trouble I always talk to them about what worries them
4.19 (0.92) -1.16 (1.11) 0.854 (0.046) * -0.007 (0.014)
17 When a friend is low I tell them a joke 3.54 (1.19) -0.50 (-0.54) 0.005 (0.006) 0.769 (0.058) *
18 If a family member is upset I will try to take them somewhere different
3.46 (1.10) -0.37 (-0.51) 0.255 (0.091) * 0.523 (0.072) *
19 I will try to focus a friend’s attention away if I see something is making them upset
3.87 (0.95) -0.68 (0.12) 0.241 (0.076) * 0.418 (0.069) *
23 When a relative comes to me upset, I will remind them that they have done well in a similar situation before
3.77 (0.98) -0.77 (0.38) 0.402 (0.079) * 0.247 (0.083) *
25 I often act the clown in front of friends in order to make them laugh
3.07 (1.30) -0.10 (-1.05) -0.089 (0.122) 0.750 (0.094) *
28 If a co-worker is angry about a problem, I will always allow them to vent their frustrations
3.83 (1.02) -0.68( -0.16) 0.671 (0.061) * -0.018 (0.089)
Table 2
Item Descriptive Statistics in Study 2
Item
Number Mean
Std.
dev. Skewness Kurtosis 3 4.20 0.80 -0.74 -0.04
8 3.79 0.93 -0.67 0.25
9 3.50 1.03 -0.57 -0.03
10 3.98 0.87 -0.84 0.73
17 3.65 1.11 -0.72 -0.13 18 3.40 1.07 -0.57 -0.29
19 3.78 0.95 -0.81 0.45
23 3.74 0.97 -0.74 0.33
Table 3
Standardized Structure Matrix for the ESEM Solution of the Validity Study.
POS. ENG. ACC. EROS
Antecedent-focused strategies
(SM / AD / CC)
Response-focused strategies
(RM)
EX. AG.
POS. ENG.
I3 .739 ** I8 .749 ** I9 .487 ** I10 .709 **
I23 .529 ** .234 ** I28 .609 **
ACC.
I17 .799 **
I18 .190 * .588 ** I19 .335 ** .373 **
I25 .522 **
IAI
EROS1 .625 ** .079 * -.317 ** .242 ** -.288 **
EROS2 .656 ** .037 -.312 ** .221 ** -.246 **
EROS3 .589 ** .057 -.299 ** .204 ** -.152 **
EROS4 .591 ** .024 -.134 ** .295 ** -.220 **
EROS5 .651 ** .002 -.023 .188 ** -.043
EROS6 .820 ** -.242 ** .158 ** -.011 .025
EAI
EROS7 .903 ** -.110 ** .145 ** -.060 * .067 *
EROS8 .809 ** -.015 .133 ** -.149 ** .157 **
EROS9 .821 ** .105 ** .191 ** -.153 ** .077 *
EROS10 .839 ** .061 * .147 ** -.066 * .042
EROS11 .803 ** .115 ** .078 * -.107 * .024
EROS12 .722 ** .139 ** .126 ** -.006 .061 *
SM
IEM1 .145 ** .609 ** -.032 -.034 -.047
IEM4 .057 .651 ** -.047 -.011 .060
IEM9 .059 .633 ** .084 * .009 -.023
IEM15 -.077 * .731 ** .244 ** -.003 .015
IEM16 .034 .618 ** .181 ** .048 .042
AD
IEM2 .076 * .701 ** -.022 .056 * .041
IEM5 .076 * .675 ** -.085 * .031 .096 **
IEM10 -.034 .707 ** -.083 * .108 ** .106 **
IEM17 -.048 .727 ** .202 ** -.004 .093 *
IEM18 -.048 .675 ** .148 ** .046 .048
CC
IEM3 .159 ** .643 ** -.092 * -.086 * .072 *
IEM6 .074 * .663 ** -.129 ** -.028 .031
IEM11 -.063 .755 ** .090 * .086 * -.082 *
IEM13 -.103 * .773 ** .108 ** .095 * -.038
IEM19 .054 .782 ** -.018 -.093 * .033
RM
IEM7 .017 .062 * .731 ** .131 ** -.204 **
IEM8 -.010 .061 * .764 ** .030 -.267 **
IEM12 -.151 ** .075 * .627 ** .194 ** -.200 **
IEM14 .071 .307 ** .527 ** .071 * -.134 **
Table 3 (continued)
POS. ENG. ACC. EROS
Antecendent- focused strategies
(SM / AD / CC)
Response-focused strategies
(RM)
EX. AG.
EX.
NEO2 .115* -.012 .323 ** .570 ** .145 **
NEO4 .266** -.007 -.101 * .316 ** .162 **
NEO6 (-) -.154 * -.022 .073 * -.282 ** -.374 **
NEO8 .174 ** -.034 -.031 .534 ** .294 **
NEO11 .056 .032 .202 ** .535 ** -.140 **
NEO14 (-) -.082 .131 * -.198 ** -.417 ** -.364 **
NEO16 .034 .058 .055 .740 ** -.130 **
NEO19 .146 ** .101 * -.034 .632 ** .162 **
NEO21 (-) -.093 * .010 .134 ** -.560 ** -.313 **
NEO22 -.069 .157 ** .062 .456 ** -.200 **
NEO23 -.097 * .187 ** -.027 .707 ** -.125 **
AG.
NEO1 .163 * .293 ** -.345 ** -.032 .319 **
NEO3 (-) .085 -.103 * .278 ** .016 -.500 **
NEO5 (-) -.060 -.034 .161 ** .017 -.648 **
NEO7 .135 * .202 ** -.223 ** -.062 .195 **
NEO9 (-) .064 .064 -.172 ** -.339 ** -.684 **
NEO10 (-) .150 ** .017 -.080 * -.225 ** -.671 **
NEO12 .144 * .102 * -.231 ** .324 ** .215 **
NEO13 (-) .011 -.100 * .214 ** -.046 -.680 **
NEO15 (-) .033 .029 -.015 -.051 -.658 **
NEO17 .169 ** .291 ** -.377 ** -.024 .326 **
NEO18 (-) .075 .011 .161 ** .019 -.496 **
NEO20 (-) .029 -.104 * .100 * -.006 -.558 **
NEO24 (-) -.084 .067 -.142 * -.362 ** -.154 **
Note. POS. ENG. = Positive Engagement, ACC. = Acceptance, EROS = Emotional Regulation of Others and Self scale, IAI = Internal Affective Improvement, EAI = External Affective Improvement, SM = Situation
Modification, AD = Attentional Deployment, CC = Cognitive Change, RM = Response Modulation, EX. =
Extraversion, AG. = Agreeableness, I# = IAISQ item, EROS# = EROS item, IEM# = Interpersonal Emotional
Table 4
Correlation between Positive Engagement and Acceptance and the Measures used in Study 2
1 2 3 4 5 6 7
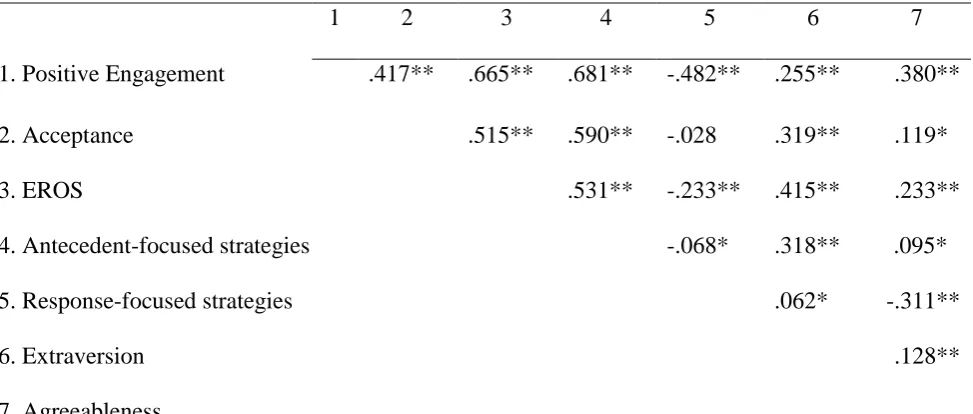
1. Positive Engagement .417** .665** .681** -.482** .255** .380**
2. Acceptance .515** .590** -.028 .319** .119*
3. EROS .531** -.233** .415** .233**
4. Antecedent-focused strategies -.068* .318** .095*
5. Response-focused strategies .062* -.311**
6. Extraversion .128**
7. Agreeableness
Table 5
Results of the Logistic Regression in Study 3
Predictor β SE Wald χ2 df p
Odds ratio
1-βobs Regular use
of positive engagement
IAISQ Positive engagement
.98 .45 4.86 1 .03 2.67 .111
IAISQ Acceptance -.52 .37 1.92 1 .17 .60 .083 Regular use of
acceptance
IAISQ Positive engagement
-.64 .42 2.36 1 .12 .53 .058
Table 6
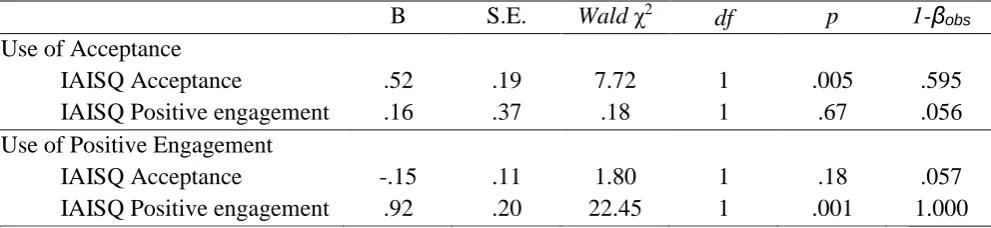
Results of Poisson Regression in Study 4
B S.E. Wald χ2 df p 1-βobs
Use of Acceptance
IAISQ Acceptance .52 .19 7.72 1 .005 .595
IAISQ Positive engagement .16 .37 .18 1 .67 .056
Use of Positive Engagement
IAISQ Acceptance -.15 .11 1.80 1 .18 .057
.355 (0.045)
.359 (0.046)
I3 I8 I9 I10 I23 I28 I17 I18 I19 I25
.735 (0.027)
.697 (0.028)
.512 (0.033)
.743 (0.024)
.576 (0.037) .743
(0.024)
.152 (0.044)
.627 (0.031)
PE AC
.907 (0.047)
.392 (0.043)
.395 (0.046)
.538 (0.040) .353
(0.053)