Patron: Her Majesty The Queen
Rothamsted Research
Harpenden, Herts, AL5 2JQ
Telephone: +44 (0)1582 763133
Web: http://www.rothamsted.ac.uk/
Rothamsted Research is a Company Limited by Guarantee Registered Office: as above. Registered in England No. 2393175. Registered Charity No. 802038. VAT No. 197 4201 51. Founded in 1843 by John Bennet Lawes.
Rothamsted Repository Download
A - Papers appearing in refereed journals
Collins, A. L., Pulley, S., Foster, I. D. L., Gellis, A., Porto, P. and
Horowitz, A. J. 2017. Sediment source fingerprinting as an aid to
catchment management: A review of the current state of knowledge and
a methodological decision-tree for end-users. Journal of Environmental
Management. 194 (1 June), pp. 86-108.
The publisher's version can be accessed at:
•
https://dx.doi.org/10.1016/j.jenvman.2016.09.075
The output can be accessed at:
https://repository.rothamsted.ac.uk/item/8v432/sediment-source-fingerprinting-as-an-aid-
to-catchment-management-a-review-of-the-current-state-of-knowledge-and-a-methodological-decision-tree-for-end-users
.
© 2017. CC-BY terms apply
Research article
Sediment source
fi
ngerprinting as an aid to catchment management:
A review of the current state of knowledge and a methodological
decision-tree for end-users
A.L. Collins
a,*, S. Pulley
b, I.D.L. Foster
b,c, A. Gellis
d, P. Porto
e, A.J. Horowitz
f,1 aSustainable Soils and Grassland Systems Department, Rothamsted Research, Okehampton, EX20 2SB, UKbGeography Department, Rhodes University, Grahamstown, 6140, South Africa
cSchool of Science and Technology, University of Northampton, Northampton, NN2 6JD, UK dU.S. Geological Survey, Baltimore, MD, 21228, United States
eDepartment of Agraria, University Mediterranea of Reggio Calabria, Italy fU.S. Geological Survey, Atlanta, GA, 30093, United States
a r t i c l e i n f o
Article history: Received 12 July 2016 Received in revised form 20 September 2016 Accepted 22 September 2016 Available online 12 October 2016
Keywords:
Suspended sediment sources Sourcefingerprinting Source tracing Mixing model Uncertainty
a b s t r a c t
The growing awareness of the environmental significance of fine-grained sedimentfluxes through catchment systems continues to underscore the need for reliable information on the principal sources of this material. Source estimates are difficult to obtain using traditional monitoring techniques, but sediment sourcefingerprinting or tracing procedures, have emerged as a potentially valuable alternative. Despite the rapidly increasing numbers of studies reporting the use of sediment sourcefingerprinting, several key challenges and uncertainties continue to hamper consensus among the international sci-entific community on key components of the existing methodological procedures. Accordingly, this contribution reviews and presents recent developments for several key aspects of fingerprinting, namely: sediment source classification, catchment source and target sediment sampling, tracer selection, grain size issues, tracer conservatism, source apportionment modelling, and assessment of source pre-dictions using artificial mixtures. Finally, a decision-tree representing the current state of knowledge is presented, to guide end-users in applying thefingerprinting approach.
©2016 The Authors. Published by Elsevier Ltd. This is an open access article under the CC BY license (http://creativecommons.org/licenses/by/4.0/).
1. Introduction to sediment sourcefingerprinting
Reliable quantitative information on fine-grained sediment sources in river catchments is required to help target remedial actions for mitigating the impacts of excessivefine sediment loss on aquatic biology (Kemp et al., 2011; Jones et al., 2012). Such knowledge can also help reduce the contribution of high sediment loads to drinking water treatment costs (Lal and Stewart, 2013), the maintenance of water storage reservoirs (Verstraeten and Poesen, 2000), and navigation routes (Milliman and Meade, 1983). The role offine sediment redistribution as a key vector for the transfer of nutrients and contaminants (Horowitz, 1985; Allan, 1986) across the land-to-water continuum has also been a key driver for the increased need for information on fine-grained sediment
provenance. The use of tracers to infer fine-grained (typically
<63
m
m) sediment provenance qualitatively dates back to the 1970s (Klages and Hsieh, 1975; Wall and Wilding, 1976; Walling et al., 1979). As the popularity of such approaches began to increase, statistical methods were introduced to improve the robustness of source discrimination (Yu and Oldfield, 1989; Walling and Woodward, 1995; Collins et al., 1996, 1997a). In addition, mathe-matical un-mixing modelling was introduced for the quantitative apportionment of sediment provenance (Walling et al., 1993; Walling and Woodward, 1995; Collins et al., 1996, 1997a) because it soon became apparent that no single tracer could discriminate robustly between multiple potential sediment sources. This reali-zation also resulted in the growing application of composite sig-natures combining tracers with differing environmental controls (Walling et al., 1993; Collins et al., 1997a; Devereux et al., 2010). Accordingly, a wide range of tracer properties have been tested and applied in the growing body of studies using thefingerprinting approach (Collins and Walling, 2004; Walling, 2005, 2013;*Corresponding author.
E-mail address:[email protected](A.L. Collins). 1 Retired.
Contents lists available atScienceDirect
Journal of Environmental Management
j o u r n a l h o m e p a g e : w w w . e l s e v i e r . c o m / l o c a t e / j e n v m a n
http://dx.doi.org/10.1016/j.jenvman.2016.09.075
Haddadchi et al., 2013; Guzman et al., 2013; Miller et al., 2015; Collins, 2015). The physical properties tested include colour (Grimshaw and Lewin, 1980; Krein et al., 2003; Croft and Pye, 2004; Martinez-Carreras et al., 2010; Barthod et al., 2015) and grain size (Kurashige and Fusejima, 1997; Weltje and Prins, 2003, 2007; Weltje, 2012). Chemical properties include clay mineralogy (Eberl, 2004; Gingele and De Deckker, 2005), mineral-magnetism (Yu and Oldfield, 1993; Caitcheon, 1998; Maher et al., 2009; Dearing, 2000; Zhang et al., 2008; Hatfield and Maher, 2009), geochem-istry (Collins and Walling, 2002), fallout radionuclides (Wallbrink and Murray, 1993; Krause et al., 2003; Wilkinson et al., 2013; Belmont et al., 2014; Evrard et al., 2016), cosmogenic radionu-clides (Perg et al., 2003), bulk stable isotopes and isotopic ratios (Yang et al., 2008; Fox and Papanicolaou, 2008), and biomarkers (Hancock and Revill, 2013; Alewell et al., 2016; Reiffarth et al., 2016). Biological properties include soil enzymes (Nosrati et al., 2011) and pollen (Brown, 1985). The underlying assumption in the application of these various tracer groups is that they provide a robust basis for discriminating potential sediment sources, although in many instances, source discrimination is tested by
finding a statistical solution using either parametric (Collins et al., 2010a) or Bayesian (Stewart et al., 2014) approaches. Inherent in the sedimentfingerprinting approach are the additional assump-tions that the tracer properties are measurable, conservative (e.g. don't change from source to sink or evolve in a predictable manner), and representative. These assumptions have been and continue to be scrutinized (e.g.Foster and Lees, 2000; Koiter et al., 2013) and represent an area of much needed further research.
Despite the recent growing application of sediment source tracing (Walling, 2013; Guzman et al., 2013; Haddadchi et al., 2013; Miller et al., 2015; Walling and Collins, 2016; Walling and Foster, 2016), there remains a strategic need to continue refining and, perhaps more importantly, standardizing the procedures therein. In response to the many questions being raised in this growingfield, a technical workshop was organised by the International Commis-sion on Continental EroCommis-sion (ICCE) at the 26th International Union of Geodesy and Geophysics meeting in 2015 in Prague to review methodological aspects of sedimentfingerprinting, thus resulting in this special section. The following sections provide a brief overview of some of the issues discussed at that workshop and which are explored in the papers in this volume. The sections herein explore progress and remaining issues related to a number of fundamental steps required for the successful application of sediment source tracing including: source classification and sam-pling, target sediment collection, tracer selection, grain size con-siderations, tracer conservatism, source discrimination, and apportionment modelling and evaluation. The paper culminates in the presentation of a new decision-tree designed to guide end-users through a series of critical decisions needed to apply the
fingerprinting approach to apportionfine-grained sediment sour-ces in river catchments. This decision-tree builds on earlier versions of methodologicalflow charts including those presented inLees (1999), Foster and Lees (2000), Walling and Collins (2000), Collins and Walling (2004), andWalling et al. (2003a, 2006), and critically, captures both historical and recent research experiences and lessons.
2. Sediment source classification
A key consideration in the application of sediment fi nger-printing relates to the classification of potential catchment sources. The fundamental distinction (Collins and Walling, 2004) made here concerns individual source types (e.g. surface or land use-based versus subsurface i.e., stream banks) and spatial (e.g. geological units or tributary sub-catchments) sediment sources. Some recent
work has combined traditional sedimentfingerprinting with par-ticle tracking techniques to increase the resolution of land use-based source types (Collins et al., 2010a, 2013a). In some cases, the classification of sediment source types has been founded on the primary processes of sediment generation including mass wasting, and sheet, rill and gully erosion (Wallbrink and Murray, 1993; Gellis et al., 2009; Gellis and Walling, 2011; Miller et al., 2015); whereas others have combined sediment source types and spatial units (e.g. Collins et al., 1997b; Walling et al., 1999; Juracek and Ziegler, 2009; Wilkinson et al., 2009).
Classification of sediment source groups is most commonly performeda priorito align source apportionment estimates with land use patterns and corresponding management goals (e.g.Peart and Walling, 1986; Walling and Woodward, 1995; Collins et al., 1997a; Owens et al., 1999; Porto et al., 2005; Collins et al., 2010a,b,c,d; Smith and Blake, 2014; Lamba et al., 2015; Foucher et al., 2015). Classification by land use has clear practical advan-tages, as sediment loss assigned to cultivated or pasture land within a catchment, for example, can be targeted by relevant management strategies based on on-farm interventions such as minimum tillage or compaction management. Tracer concentrations in a land use-based source group are likely to be controlled by numerous fac-tors including soil and colluvium parent material, pedogenic pro-cesses, anthropogenic inputs, or prevailing soil moisture conditions (e.g. gleying). These factors have the potential to increase within-source variability, with clear implications for the uncertainty ranges associated with predicted source apportionment. The fundamental requirement to reduce intra-group and increase inter-group tracer variability (Small et al., 2002; Collins and Walling, 2002; Pulley et al., 2015a) is likely to be complicated or even confounded if small differences exist in tracer concentrations be-tween different land use or surface and subsurface sources. Small differences in tracer concentrations can be caused by, for example, pedogenic processes or anthropogenic tracer inputs (e.g. atmo-spheric fallout of particulate lead from combustion). Based on historic land use and/or the chemical properties of the sources, different land uses can be combined, such as in the case of combining pasture with cropland to produce a general source group called agriculture (Gellis et al., 2015; Collins, 2015). Addi-tional complexities must be considered where the fingerprinting approach is used to reconstruct sediment sources through time using sedimentary deposits. Here, some tracers cannot be assumed to have remained constant (behaved conservatively) through time due, for example, to atmospheric pollution elevating concentra-tions in catchment topsoil sources, as is likely to be the case for heavy metals and nutrients in artificial fertilisers (Foster and Charlesworth, 1996; Foster and Lees, 2000) or as the result of post-depositional dissolution and remobilization.
Objective sediment source grouping, as opposed to a priori
determination, especially in the context of minimising uncertainty associated with quantitative source apportionment estimates, has also been identified as an area of research worthy of more attention (seePulley et al., 2017).Pulley et al., (2017)expand on a method introduced byWalling et al. (1993)based on pre-selected tracers from cluster analysis to classify sediment source groups.Walling et al. (1993)found that land use was the primary controlling fac-tor on the resulting four to six source groups. Walling and Woodward (1995) also used cluster analysis to classify source groups according to pre-selected tracers. In contrast to Walling et al. (1993), geology was identified as the major controlling fac-tor affecting source group classification, presumably reflecting the larger and geologically more diverse drainage basin used in the latter study. Using a similar cluster analysis method,Pulley et al. (2017)used the tracer signatures of the source samples in a PCA and cluster analysis to select the source grouping which bestfits the measured tracer signatures and this was combined with the modification of the cluster groupings to suit management goals. Wilkinson et al. (2015)modelled soil erosion and collected source
fingerprinting samples with priority given to heavily eroding areas with the aim of reducing the potential impacts of within-source group variability and making the source samples more represen-tative of heavily eroding sediment sources. Similarly,van der Waal et al. (2015)retrieved source samples from key erosional features, such as gullies, which were identified using aerial photography. These approaches do, however, require a clear understanding of the connectivity between eroding areas and the river channel, which continues to be a fundamental premise for targeting source sam-pling as eroded sediment will often not reach the river channel in short time periods and contributing areas will vary during runoff events of different magnitude and frequency (Fryirs, 2013). Few source tracing studies publish maps of actual source-to-river con-nectivity, but many (e.g.Gellis and Noe, 2013; Laceby et al., 2015) publish source sampling location maps (as opposed to just geology and land use maps) which can be assumed to be indicative of such connectivity given the underpinning assumption in applying
fingerprinting procedures that active sources are sampled.
3. Catchment source sampling
Sampling protocols for catchment sources continue to be refined with recent developments including the combination of indepen-dent lines of evidence with more traditional strategies. Here, for example, some researchers have combined process-based model characterisation of catchments to help target source sampling (Wilkinson et al., 2015; Theuring et al., 2015). Geomorphic assess-ments (Wethered et al., 2015) and Google Earth (Boardman, 2016) can help ensure that source sampling strategies are better informed. Source material sampling is most commonly conducted during a single intensive campaign. For many tracers this is an adequate means of sampling; however, some organic tracers are strongly influenced by seasonality. For example, nutrients from decomposing post-reproductive salmon carcasses can be a signifi -cant seasonal contribution to aquatic organic matter in some rivers (Bilby et al., 1996; Ben-David et al., 1998). Sediment-associated organic matter in streams is primarily composed of bacteria, algae, soil-derived organic matter, macrophytes, leaf detritus, and human septic waste and these sources can have seasonal patterns of readily available material associated with, for example, vegeta-tion dieback. In the absence of repeat source sampling campaigns over time, sediment-associated organic matter sources can be traced reliably, but for constrained time periods that do not include all seasons (Collins et al., 2013b;2014). Given these issues, source sample scheduling must either take into account seasonal issues
associated with organic tracers, or alternatively, eliminate those tracers that are subject to substantial intra-annual variability. A similar issue is associated with agricultural crop rotations, that are common in lowland intensive agricultural landscapes, and which have been the feature of many sediment source tracing studies. Crop rotation in particular degrades the strong discrimination be-tween arable and grassland surface soils as potential sediment sources provided by fallout radionuclides (e.g. Cs-137, unsupported Pb-210, Be-7) by generating more overlap between the measured concentrations to the depth of the plough layer. This complication is less evident for unsupported Pb-210 or Be-7 since fallout is ongoing, thereby providing a means of re-setting cultivation effects even in the context of down-profile transfers over time. However, re-setting of down-profile contrasts in fallout nuclide signatures, for example, will depend on nuclide half life; Be-7 (half life 53 days) will return to its pre-disturbance profile form much more quickly than Pb-210 (half life ~ 22 years). More research is required to fully understand the effects of land use change on down profile radio-nuclide, physical, chemical and magnetic signatures.
When tracing the sources of historically deposited sediment it also must be borne in mind that the concentrations of many tracers in source groups have the propensity to change over long time scales (decades and longer). Examples of tracers which may vary in concentration in source groups over long timescales include phosphorus, which is applied in artificial fertilisers, or lead and other heavy metals where atmospheric releases, through produc-tion, processing or consumpproduc-tion, have changed over time with increasing industrialisation and/or regulation (Foster and Charlesworth, 1996). Therefore, relevant timescales in the context of the temporal stability (conservatism) of tracers used to distin-guish catchment source groupings over long time spans must be borne in mind (Foster and Lees, 2000).
Many sedimentfingerprinting studies address sources by land use and are conducted in small<300 km2watersheds, referred to as management scale watersheds (Gellis and Walling, 2011). Sediment
fingerprinting also has been conducted in larger watersheds (1000's km2) (Collins et al., 1997b; Douglas et al., 2003; Voli et al., 2013) but at this larger scale, source percentages by sub-basin and geologic provenance become more important. Here, a confluence-based approach can be the most efficient means of rationalising source sampling through the collection of sediment samples upstream and downstream of major tributaries (e.g.Vale et al., 2016).Gellis et al., (2017)examined sediment sources for a large region of the United States, the Midwest cornbelt (648,239 km2), through sampling offine-grained bed material in 98 wadeable streams (ranging in area from 6.8 to 5893 km2). Building upon an approach using fallout radionuclides, 7Be and 210Pbex
(Matisoff et al., 2005).Gellis et al. (2017)estimated the percentage of surface versus channel derived sediment, and the age of this sediment to less than one year. Results indicate that the majority of sediment is channel derived with many samples being less than 100 days old.
The statistical implications of such bulking approaches in the context of probability require further exploration. With respect to sampling target sediment, many studies use time-integrating de-vices for temporal coverage, but there remains a need to collect replicates to assess variation in sediment tracers at any individual channel location, especially since current un-mixing models can include such information in Monte Carlo routines, but also to consider carefully the need for sampling multiple channel locations to ensure appropriate attention is given to potential scale de-pendencies associated with process domains.
4. The collection of target sediment
A wide range of target sediment sample types have been used in source tracing investigations. Studies focussing on contemporary timescales, originally used either instantaneous suspended (e.g. Peart and Walling, 1986; Walling and Woodward, 1992; Collins et al., 1997a, 2001b; Russell et al., 2001; Carter et al., 2003) or channel bed sediment (e.g.Collins and Walling, 2007; Collins et al., 2012a,b) samples. The former were retrieved using either a sub-mersible pump powered by a portable generator, a portable continuous-flow centrifuge, or an autosampler, whereas the latter were commonly collected using a re-suspension technique (Lambert and Walling, 1988; Duerdoth et al., 2015). But, over time, there has been a step change towards the collection of time-integrated suspended sediment samples (e.g.Walling et al., 2006, 2008; Collins et al., 2010b,d; Massoudieh et al., 2012) using sim-ple traps developed byPhillips et al. (2000)and tested byRussell et al. (2000). Equally, time-integrated samples of interstitial sedi-ment ingressing channel bed gravels have been collected using retrievable basket traps, sometimes inserted in artificial salmonid redds (Walling et al., 2003a; Collins et al., 2013b, 2014). Key ad-vantages associated with using channel bed sediment samples is that they provide a surrogate for material transported continuously over multipleflood events and thereby permit the characterisation of sediment signatures using minimal sampling effort, whilst also avoiding the need to capture flood events and collect samples across hydrographs (Miller and Orbock Miller, 2007; Horowitz et al., 2012; Mukundan et al., 2012; Evrard et al., 2013; Miller et al., 2015). For recent timescales of a few years, some studies have collected surface scrapes fromfloodplains experiencing reg-ularflood inundation (e.g.Bottrill et al., 2000), with such samples providing a basis for fingerprinting the sources of sediment conveyed and deposited during higher magnitude flood events resulting in overbank inundation.
Whereas many investigations have documented contemporary
fine-grained sediment sources, others have sampled floodplain, reservoir, wetland, and lake deposits to attempt to reconstruct changes in sediment sources over a longer timeframe (Foster et al., 1998; Collins et al., 1997c; Owens et al., 1999; Walling et al., 2003b; Miller et al., 2005, 2013; Pittam et al., 2009; Foster et al., 2012; Pulley et al., 2015b; Walling and Foster, 2016). Here, it is assumed that the sampled depositional profiles provide a historical record of sediment material and its signatures. Accordingly,fingerprinting can be performed on sectioned profiles of core samples to recon-struct changes in sediment provenance for the depositional site, where tracer conservatism is shown not to be a problem although in many cases, such conservatism is atypical. The combination of the source apportionment estimates with a dated sediment profile, provides the basis for examining the impact of environmental change associated with, for example, documented land use change or extreme hydrological events on sediment source dynamics.
5. Tracer selection for source discrimination
Following early studies that tended to pre-select tracer shortlists (e.g. Peart and Walling, 1988), most applications of sediment
fingerprinting have measured multiple tracers in source samples and then applied statistical tests to confirm source discrimination. Here, once again, recent work has underscored the need to consider carefully a number of critical factors pertaining to either pre-selection, or further screening, following analyses of source mate-rial samples. Firstly, confirmation of a sound physical basis for any tracer providing discrimination between potential sources is highly preferable (Foster and Lees, 2000). Accordingly, and by way of example, prior geochemical knowledge linked to geological varia-tion can be used to guide initial tracer selecvaria-tion (Laceby et al., 2015). Equally, an understanding of tracer environmental behaviour, such as that responsible for the contrasting fallout radionuclide signa-tures of surface and subsurface sources, can be used as a basis for selecting these particular tracers (Walling et al., 2003a). Prior knowledge of the impact of weathering processes in enriching or depleting tracers in specific sources (e.g. surface soil) can also be used (Koiter et al., 2013). Secondly, in the context of the potential for tracer perturbation, composite signatures should not neces-sarily be based on reductionist optimisation, since larger composite signatures can reduce uncertainty and help counter problems associated with the perturbation of any individual tracer (Sheriff et al., 2015). Here, there is a need to consider expanding compos-ite signatures in the context of goodness-of-fit metrics for un-mixing model performance. Thirdly, tracers with small differ-ences between source groups should not be used since these generate larger uncertainties in estimated source proportions (Pulley et al., 2015a). Fourthly, tracers with greater between-group to within-group variability ratios should be pre-selected for inclu-sion in statistical tests applied for quantifying source discrimina-tion (Pulley et al., 2015a). Previous work has shown that individual tracer property groups can provide robust discrimination (Collins and Walling, 2002), but where resources permit, the inclusion of properties responding to differing environmental controls is pref-erable. Although prior knowledge of tracer behaviour may not be for the precise physiographic setting in question, it is likely that sufficient general guidance on tracer pre-selection can be deduced from existing understanding of the typical environmental behav-iour of most tracers.
6. Selection of grain size fractions for tracer analyses
The most common practice in publishedfingerprinting studies is tofingerprint the<63
m
m fraction of sediment. The initialjusti-fication for this selection, above and beyond the dominant pro-portion offluvial suspended sediment loads being represented by this size fraction, was to limit particle size effects given the knowledge that particle size exerts a strong influence on many of the tracers used forfingerprinting (e.g.Jonasson, 1977; Horowitz, 1991). But, because it has been shown that substantial variability in tracer concentrations can exist even within the<63
m
m fraction (e.g. Horowitz and Elrick, 1987; Walling and Woodward, 1992; Motha et al., 2003; Hatfield and Maher, 2009; Pulley and Rowntree, 2016), an alternative approach is the use of narrower particle size fractions.Wallbrink (2004), for example, used only thethe methods ofHatfield and Maher (2009)have distinct advantages for identifying particle size effects and selecting the optimum particle size for tracing, they do require the measurement of tracers on multiple particle size fractions, significantly increasing the time and cost of analyses. Therefore, the selection of a narrow particle size range may be of benefit to manyfingerprinting studies and, accordingly, some have pre-selected restricted ranges in their procedures (e.g. Wallbrink et al., 2003; Douglas et al., 2010; Wilkinson et al., 2013;Theuring et al., 2013, 2015; Laceby et al., 2015; Haddachi et al., 2015). Since finer fractions are more geochemically active, they are likely to provide more robust source discrimination; however this benefit can be counterbalanced because thesefiner grain size ranges also are more susceptible to transformation and non-conservative behaviour during transport. It also can be cost prohibitive to obtain sufficient sample masses of restricted size ranges to permit tracer quantification. Selection of any individual size fraction will only be appropriate if this is shown to be the size class that represents the majority of sediment in transport and indeed the fraction responsible for the environ-mental issue(s) (e.g. degradation of a coral reef or siltation of salmonid spawning gravels) in question. If sedimentfingerprinting is to become a widely used management tool, the ability to source individual fractions and/or using very limited size ranges offi ne-grained sediment may be cost prohibitive.
7. Tracer conservatism
Sediment source fingerprinting techniques are based on the fundamental assumption that selected tracer properties behave conservatively during mobilisation and delivery through the catchment system and that the properties of source material and sediment samples can therefore be directly compared. The signif-icance of this assumption is increasingly recognised, but also challenged (Foster and Lees, 2000; Motha et al., 2002a,b, 2003, 2004; Koiter et al., 2013; Smith and Blake, 2014; Kraushaar et al., 2015). Early work highlighted the paucity of understanding on this critical assumption (Bubb and Lester, 1991; Zhang and Huang, 1993). Chemical transformations can occur in conjunction with a range of mechanisms throughout the sediment cycle, including, amongst others, scavenging by Fe/Mn oxides, chemical precipita-tion and incorporaprecipita-tion into crystalline matrices (Forstner and Salomans, 1980; Foster and Lees, 2000). Despite these risks, pub-lished studies have included tracers prone to transformation, including phosphorus fractions (e.g. Owens et al., 2000). Whilst there are risks of non-conservative behaviour for actively trans-portedfine-grained sediment, such risks are potentially elevated where sedimentary deposits are used to reconstruct catchment sediment sources through time. Post-depositional dissolution or diagenesis and the in-growth of bacterial magnetite can, for example, impact the conservatism of mineral-magnetic tracers (e.g. Foster et al., 2008; Pulley et al., 2015b). Short-lived radionuclides (e.g.210Pb,137Cs and7Be) are also unsuitable for long-term (more than 100e150 years old) tracing as their activities will be infl u-enced by fallout histories and short half lives. Longer-lived gamma emitting radionuclides such as40K and235U, will be more suitable for long-term (centuries to millennia) source reconstructions, assuming they provide robust source discrimination, because of their much longer half-lives (Walling and Foster, 2016).
Of the sources of uncertainty highlighted in the published literature, the effects of changing sediment particle size and organic matter content on tracer signatures during the sediment cycle through catchment systems are often prominent. The effects of these factors on many of the geochemical properties commonly used as sediment source tracers was recognised early on (e.g. Goldberg, 1954; Rex and Goldberg, 1958; Goldberg and Arrhenius,
1958; Krauskopf, 1956; Kononova, 1966; Jones and Bowser, 1978; seeHorowitz, 1991for additional references), yet little of such work seems to have been integrated into current source tracing pro-cedures. Associations of many elements with organic matter are often unpredictable, with some elements having a greater affinity than others (Swanson et al., 1966; Saxby, 1969; Rashid, 1974; Bunzl et al., 1976; Jonasson, 1977; Maule and Dudas, 1988; seeHorowitz, 1991for additional references). The strength of these associations may differ between catchments (Gibbs, 1977) and organic matter can behave as both a diluent, (e.g. magnetic signatures (Walling and Foster, 2016)) or as a contributor (e.g.,Horowitz, 1985; Horowitz and Elrick, 1987). Organic corrections are widely used in conjunc-tion with the applicaconjunc-tion of mineral-magneticfingerprints. Efforts to mitigate the effects of particle size and organic matter in
fingerprinting studies can therefore be seen as being in an early stage of development with many investigations neglecting to include any significant attempt to mitigate their effects other than to sieve to<63
m
m and employ elementary corrections, as dis-cussed elsewhere in this paper.In the absence of comprehensive information and guidance on the conservatism of multiple tracers in different environments, the vast majority of studies continue to use a simple screening tech-nique to evaluate the conservative behaviour of various tracers based on the so-called range or bracket test, using a variety of rules (e.g.Foster and Lees, 2000; Wilkinson et al., 2013;Collins et al., 2013b,c; Gellis and Noe, 2013). A principal danger with existing range tests is that whilst they confirm that non-conservative transformation is not significant in the context of the sampled source tracer ranges, they do not confirm the complete absence of any non-conservatism (Collins et al., 2013b,c). The use of the range test can be underpinned by tracer screening using literature re-views dealing with tracer geochemistry in conjunction with an understanding of the various effects of changing physicochemical conditions between the source area and the sink (Kraushaar et al., 2015) and this pragmatic approach merits further attention.Pulley et al. (2015c)produced bi-plots of magnetic properties for source samples comprising different particle size fractions and were able to identify if lake sediment samples exhibited similar linear re-lationships, suggesting the conservatism of these tracers in the deposited sediment. This approach represents a more robust form of the range test, although it does greatly increase the time and cost requirements for tracer analysis and is dependent on a relationship between at least two tracer variables.
8. Source apportionment modelling
Use of mathematical techniques (e.g. Yu and Oldfield, 1989, 1993; Walling et al., 1993; Walling and Woodward, 1995; Collins et al., 1997a; Gellis and Landwehr, 2006; Hughes et al., 2009; Sheriff et al., 2015) to un-mix sediment samples represents a key methodological component of source fingerprinting procedures over the past two decades. Recent studies using un-mixing models have applied different composite signatures to assess variation in predictions dependent on the tracers used and to improve the use of multiple tracers provided by current analytical techniques including ICP-MS (Collins et al., 2012a, 2013c; Stone et al., 2014; Theuring et al., 2015) and NIRS (Collins et al., 2013b, 2014). The explicit assessment of uncertainty in conjunction with the growing application of un-mixing modelling wasfirst introduced byFranks and Rowan (2000)andRowan et al. (2000)in the form of Monte Carlo analysis. It is now standard to include an explicit assessment of uncertainties in conjunction with the use of source apportion-ment modelling.
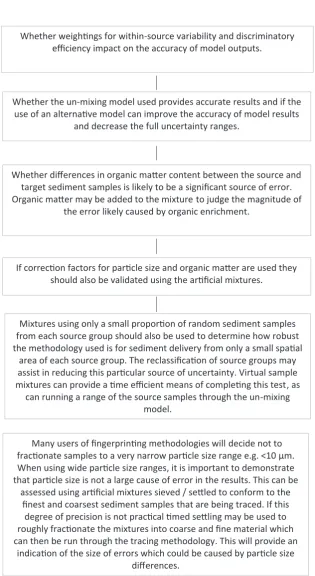
The growing use of sediment un-mixing models has demon-strated that the range of uncertainty outputs from Monte Carlo routines is primarily driven by the within-source group variability in tracer concentrations and the corresponding differences in tracer concentrations between-source groups (Small et al., 2002). As a result, weightings have been applied to give a larger emphasis during un-mixing modelling to tracers with a lower within-source variability and greater discriminatory power (Martinez-Carreras et al., 2008; Collins et al., 2010c;Wilkinson et al., 2013;Gellis and Noe, 2013). The latter weighting has, in some cases, been used as a substitute for original weightings reflecting the analytical errors or precision associated with individual tracers (Mackas et al., 1987; He and Owens, 1995;Collins et al., 1997a). These weightings were developed in response to some papers identifying the need to explore their use (Walling et al., 1993). All such weightings should be carefully assessed in the context of evaluating modelled source proportions using goodness-of-fit metrics and artificial sediment mixtures (e.g.Laceby and Olley, 2015). The sensitivity of modelled source proportions to these types of weightings has been reported as limited based on some datasets (Pulley et al., 2015b) and where the impacts are greater, the weightings reflecting analytical preci-sion or tracer discriminatory power are subtle compared to other weightings (Laceby and Olley, 2015).
More recently, variability ratios (of inter-/intra-source group variability) have been recommended by Pulley et al. (2015a) to capture the fundamental need to select tracers that maximize be-tween- rather than within-group tracer variation. These variability ratios can be applied as an initial screen in the tracer selection procedure to remove tracers that are likely to result in elevated levels of uncertainty in both source discrimination (Collins and Walling, 2002) and un-mixing model outputs (Pulley et al., 2015a). Some work has also introduced distribution-based model-ling, to ensure that multiple model iterations for uncertainty ana-lyses maintain relationships between tracers during the iterative sampling of tracer distributions reducing the uncertainty ranges present in model outputs (Laceby and Olley, 2015; Laceby et al., 2015). In terms of the input tracer distributions, a critical decision is whether to represent source groups using the 25th-75th percentile range or the 5th-95th percentile range since this decision alone can influence the corresponding uncertainty ranges associ-ated with modelled source proportions. Regardless of the scaling used, mixing model outputs are characterised by uncertainty ranges and a key decision is how to present this uncertainty to catchment stakeholders. Here, many existing studies have reported gross uncertainty ranges (e.g. 5th-95th percentiles, or the entire pdfs), the average mean or median source proportions with
associated uncertainty (95% confidence limits) and tested the convergence of the model runs (e.g. Collins et al., 2013c). Communicating the uncertainty ranges to stakeholders involved in decision-making for managing the sediment problem is important. To simplify the communication of uncertainty, whilst taking explicit account of this issue, some researchers have calculated relative frequency-weighted average mean or median source con-tributions (e.g. Collins et al., 2013b,c; 2014). The processing of sediment source tracing data for a single location within a study catchment will always be prone to bias introduced by the scale dependencies associated with spatial variation in the mixtures of potential sources and corresponding geomorphic processes driving sediment mobilisation and delivery.
The adoption of un-mixing models by many studies has been accompanied by the inclusion of particle size corrections. In the majority of studies, these continue to be based on the assumption of a simple linear relationship between particle size and tracer signatures (e.g. Collins et al., 1997a; Owens et al., 1999, 2000; Walling et al., 1999, 2003a, 2006, 2008; Smith et al., 2011; Smith and Blake, 2014). However, it has been recognised that relation-ships between particle size and many tracer signatures are non-linear, especially for specific surface areas>1.0 m2g1(Horowitz and Elrick, 1987; He and Walling, 1996; Foster et al., 1998; Russell et al., 2001; Motha et al., 2003; Bihari and Dezs, 2008; Hatfield and Maher, 2009; Oldfield et al., 2009); thus introducing un-certainties in conjunction with simple linear corrections. Previous work has demonstrated that significant contrasts can exist in par-ticle size composition between different source and sediment samples, even when all samples have been screened through a 63
m
m sieve (e.g.Walling and Woodward, 1992; Russell et al., 2001). Such data imply that even post sieving to<63m
m, the tracers of source and sediment samples cannot be directly compared without further correction.Motha et al. (2003)measured tracer signatures associated with various particle size fractions and developed tracer signature-specific correction factors. Russell et al. (2001) also developed tracer-specific curvilinear corrections rather than assuming a generic linear relationship between concentration and grain size. Whilst such approaches help mitigate uncertainties associated with linear corrections they do, however, have disad-vantages in terms of the time required for laboratory work. Due to these challenges, some studies have used enrichment factors based on the measured concentrations of tracers in sediment and source samples (e.g. Peart and Walling, 1986; He and Owens, 1995). Alternatively, other studies have adjusted source material tracer concentrations by using information on the grain size of target sediment and tracer concentrations associated with particle size fractions of source materials, to estimate property concentrations in source material with the same grain size composition as the target sediment (Walling and Woodward, 1992; Slattery et al., 1995; Motha et al., 2004). Recognizing that the relation of grain size and tracer property can be positive, negative, or have no relation,Gellis and Noe (2013)used regression analysis of the D50of sourcesam-ples against tracer concentration to produce a grain-size correction factor. This has the advantage that the fractionation of source samples and analysis of each fraction is not required and a linear relationship is not assumed. However, such methods may require extrapolation of a trend line beyond the range of values found in the source samples, thereby introducing uncertainty. An alternative to developing corrections for grain size effects, is to use narrower size fractions (e.g.<10
m
m) to counter the potential influence of selectivity during the sediment delivery cascade (e.g. Theuring et al., 2015).2013; Pulley et al., 2015b), driven primarily by correlations between tracer concentration and organic matter content and by the im-provements in the goodness-of-fit outcomes for un-mixing. Again, these weightings were often developed in response to some re-searchers identifying the need for their inclusion (Walling et al., 1993), although such corrections are site-specific, meaning there is no universal correction factor. Although some research has highlighted the risk of such corrections biasing source predictions (Smith and Blake, 2014); alternatively, recent research has shown that they have limited impact on the source estimates (Pulley et al., 2015b). The importance of carefully assessing elementary correc-tions for grain size and organic matter on a dataset-specific basis and making informed decisions to avoid over-correction has long been underscored (e.g.Walling and Collins, 2000; Walling et al., 2003a). Noise associated with differing organic matter contents of source materials, or a high within-source group variability in tracer concentrations may mask relationships between D50and tracers
leaving them unaccounted for. Sediment-associated organic matter in thefluvial environment exists as loosely-bound particulate ma-terial (e.g. leaf litter), which in the case of many of the most commonly used tracers (apart from biomarkers) will act as a diluent, and as surface coatings for mineral particles, where it can act as a concentrator. Moving forward, this implies that the development of more informed correction factors for organic matter needs to take into account both grain-size and phase spe-cific aspects of the problem. Such work has important resource implications.
Some research during recent years has been directed towards the comparison of variations in source apportionment depending on the applied un-mixing model. Haddadchi et al. (2014), for example, compared four different model structures using artificial mixtures with known proportions of sediment sources. There has also been a growing number of source tracing studies which, rather than using maximum likelihood/frequentist (see modelling papers cited above) methods, instead, use Bayesian (Fox and Papanicolaou, 2008; Rowan et al., 2011; Massoudieh et al., 2012; D'Haen et al., 2013; Cooper et al., 2014) modelling approaches. Uptake of the Bayesian models has benefitted from some of them (e.g.Barthod et al., 2015) being open source. The need to compare local and global solutions using the former types of models has been underscored by previous work (Collins et al., 2010d). Model structure and the robustness of the input data both have a strong bearing on the outputs, and end users must carefully assess model structures and approaches when applyingfingerprinting proced-ures. Numerous uncertainties which are not fully accounted for in currentfingerprinting procedures have been identified in recent publications, highlighting the need for further methodological
re-finements which, where appropriate and underpinned by repli-cated evidence based on multiple catchments and environmental settings, need to be incorporated into sediment un-mixing models (e.g.Motha et al., 2002a,b; D'Haen et al., 2012; Koiter et al., 2013; Smith and Blake, 2014; Pulley et al., 2015b; Laceby and Olley, 2015). An ongoing problem is that many papers assess specific is-sues for a single or limited set of study catchments/environments, and then propose generic guidance which simply may not be widely applicable. Importantly, however, these recent studies serve as useful reminders that source tracing datasets should be treated on a case by case basis.
9. Use of artificial sediment mixtures to assess source
apportionment modelling
The use of artificial mixtures of known quantities of sediment sources (cf.Stott, 1986) has gained increasing popularity in recent years and represents an important component for the development
of robust, widely applicable source tracing procedures. A limitation offingerprinting research is that it is difficult to validate estimated source proportions using independent evidence as the monitoring and measurement techniques required face their own limitations in terms of the practicalities and costs of deployment both spatially and temporally (Collins and Walling, 2004). Validation of fi nger-printing estimates against independently measured data assem-bled using alternative techniques therefore continues to be rare, although some examples exist (e.g.Peart and Walling, 1988; Collins et al., 1998; Stone et al., 2014). Mixtures of known proportions of sediment sources thereby provide a pragmatic opportunity to assess the accuracy of afingerprinting procedure on the basis of its estimated source proportions. Early studies using artificial mixtures include the work byLees (1997)who identified non-linear addi-tivity associated with the use of the mineral magnetic properties of sediment.Franks and Rowan (2000)usedfive artificial mixtures consisting offive source types based on major chemical groups to assess a source tracing procedure. Small et al. (2004) used a Bayesian modelling approach and artificial mixtures to explore source sampling related uncertainties and the number of source samples required to limit uncertainty in modelling results. Addi-tional studies using artificial mixtures to assess un-mixing model outputs include those by Hughes et al. (2009), Poulenard et al. (2012), Legout et al. (2013), Brosinsky et al. (2014), Haddadchi et al. (2014)and Laceby and Olley (2015). Given the laboratory work associated with generating and analysing the tracer content of artificial source mixtures, some recent studies have introduced synthetic mixtures based on Monte Carlo routines (Palazon et al., 2015; Sheriff et al., 2015) as an alternative. Whilst virtual sample mixtures can be deliberately corrupted to mimic uncertainty (Sheriff et al., 2015) they do, however, have limitations including, for example, different source groups having contrasting particle size distributions (Palazon et al., 2015).
10. A decision tree for guiding application of sediment source tracing
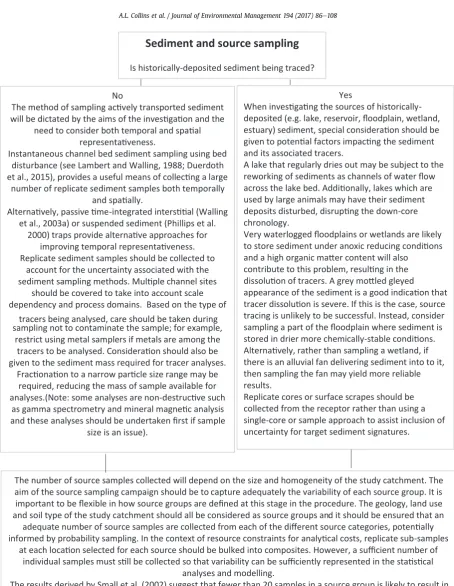
Progress continues to be made in the refinement of sediment source fingerprinting procedures but much scientific debate is ongoing. Following four decades involving preliminary applica-tions, acceptance of the need for composite signatures and the introduction of statistical and numerical modelling approaches, including uncertainty assessment, recent work has re-visited critical assumptions and challenged some recent proposed methodological modifications. In the context of ongoing studies, and the diverging opinions on some aspects of fingerprinting procedures, it is timely to propose a revised decision-tree for supporting critical choices that have to be made by end-users applying the technique. This decision-tree (Fig. 1) attempts to capture the current state-of-the-art, and hopefully serves as one means of synthesizing the lessons gleaned from the past 40 years of research.
Sediment and source sampling
Is historically-deposited sediment being traced?
No
The method of sampling ac vely transported sediment
will be dictated by the aims of the inves ga on and the
need to consider both temporal and spa al
representa veness.
Instantaneous channel bed sediment sampling using bed
disturbance (see Lambert and Walling, 1988; Duerdoth
et al., 2015), provides a useful means of collec ng a large
number of replicate sediment samples both temporally
and spa ally.
Alterna vely, passive me-integrated inters
al (Walling
et al., 2003a) or suspended sediment (Phillips et al.
2000) traps provide alterna ve approaches for
improving temporal representa veness.
Replicate sediment samples should be collected to
account for the uncertainty associated with the
sediment sampling methods. Mul ple channel sites
should be covered to take into account scale
dependency and process domains. Based on the type of
tracers being analysed, care should be taken during
sampling not to contaminate the sample; for example,
restrict using metal samplers if metals are among the
tracers to be analysed. Considera on should also be
given to the sediment mass required for tracer analyses.
Frac ona on to a narrow par cle size range may be
required, reducing the mass of sample available for
analyses.(Note: some analyses are non-destruc ve such
as gamma spectrometry and mineral magne c analysis
and these analyses should be undertaken
fi
rst if sample
size is an issue).
Yes
When inves ga ng the sources of
historically-deposited (e.g. lake, reservoir,
fl
oodplain, wetland,
estuary) sediment, special considera on should be
given to poten al factors impac ng the sediment
and its associated tracers.
A lake that regularly dries out may be subject to the
reworking of sediments as channels of water
fl
ow
across the lake bed. Addi onally, lakes which are
used by large animals may have their sediment
deposits disturbed, disrup ng the down-core
chronology.
Very waterlogged
fl
oodplains or wetlands are likely
to store sediment under anoxic reducing condi ons
and a high organic ma er content will also
contribute to this problem, resul ng in the
dissolu on of tracers. A grey mo led gleyed
appearance of the sediment is a good indica on that
tracer dissolu on is severe. If this is the case, source
tracing is unlikely to be successful. Instead, consider
sampling a part of the
fl
oodplain where sediment is
stored in drier more chemically-stable condi ons.
Alterna vely, rather than sampling a wetland, if
there is an alluvial fan delivering sediment into to it,
then sampling the fan may yield more reliable
results.
Replicate cores or surface scrapes should be
collected from the receptor rather than using a
single-core or sample approach to assist inclusion of
uncertainty for target sediment signatures.
The number of source samples collected will depend on the size and homogeneity of the study catchment. The
aim of the source sampling campaign should be to capture adequately the variability of each source group. It is
important to be
fl
exible in how source groups are de
fi
ned at this stage in the procedure. The geology, land use
and soil type of the study catchment should all be considered as source groups and it should be ensured that an
adequate number of source samples are collected from each of the di
ff
erent source categories, poten ally
informed by probability sampling. In the context of resource constraints for analy cal costs, replicate sub-samples
at each loca on selected for each source should be bulked into composites. However, a su
ffi
cient number of
individual samples must s ll be collected so that variability can be su
ffi
ciently represented in the sta s cal
analyses and modelling.
The results derived by Small et al. (2002) suggest that fewer than 20 samples in a source group is likely to result in
a high amount of uncertainty associated with appor onment modelling results. However, where a large
within-source group variability exists, a greater number of within-source samples may be required.
For surface sources, sample to the typical depth that sediment genera on processes operate at (e.g. 0-2 cm depth
has been widely used in temperate environments; Walling and Woodward, 1995). Deeper sampling may be
appropriate in arid or semi-arid landscapes.
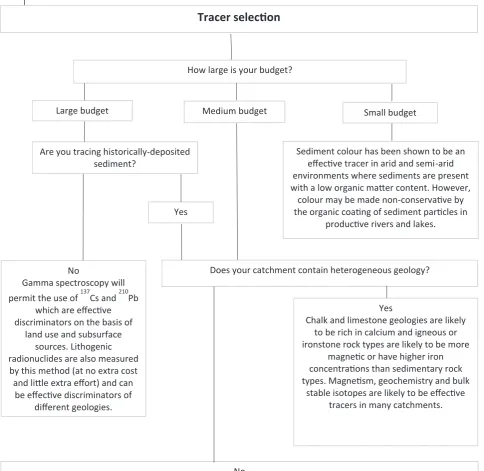
Tracer selec
Ɵ
on
How large is your budget?
Large budget
Medium budget
Small budget
Are you tracing historically-deposited
sediment?
Sediment colour has been shown to be an
e
ff
ec ve tracer in arid and semi-arid
environments where sediments are present
with a low organic ma er content. However,
colour may be made non-conserva ve by
the organic coa ng of sediment par cles in
produc ve rivers and lakes.
No
Gamma spectroscopy will
permit the use of
137Cs and
210Pb
which are e
ff
ec ve
discriminators on the basis of
land use and subsurface
sources. Lithogenic
radionuclides are also measured
by this method (at no extra cost
and li le extra e
ff
ort) and can
be e
ff
ec ve discriminators of
di
ff
erent geologies.
Yes
Does your catchment contain heterogeneous geology?
Yes
Chalk and limestone geologies are likely
to be rich in calcium and igneous or
ironstone rock types are likely to be more
magne c or have higher iron
concentra ons than sedimentary rock
types. Magne sm, geochemistry and bulk
stable isotopes are likely to be e
ff
ec ve
tracers in many catchments.
No
Mineral-magne c signatures have been shown to discriminate between surface and subsurface sources. However,
this discrimina on may be caused by the dissolu on of magne c grains in anoxic subsurface condi ons. Therefore,
care should be taken when tracing historically-deposited sediment to ensure that similar dissolu on is not
occurring in the sediment receptor, destroying the basis for source discrimina on. Magne c signatures are o en
correlated with each other which is of bene
fi
t when performing a mass conserva on test but may limit source
discrimina on. They can also easily be corrected for organic ma er content.
Urban road dusts and damaged road verges may be expected to have di
ff
erent magne c proper es than
cul vated and grassland. Similarly, they are expected to have higher concentra ons of geochemical tracers such
as lead and zinc.
Geochemical tracers may also discriminate on the basis of land use, but the basis for discrimina on is less well
established than for magne c tracers. For example, di
ff
erences between source groups may re
fl
ect a purely
sta s cal solu on, which is presumed to be caused by geochemical di
ff
erences due to factors such as weathering
or anthropogenic applica ons.
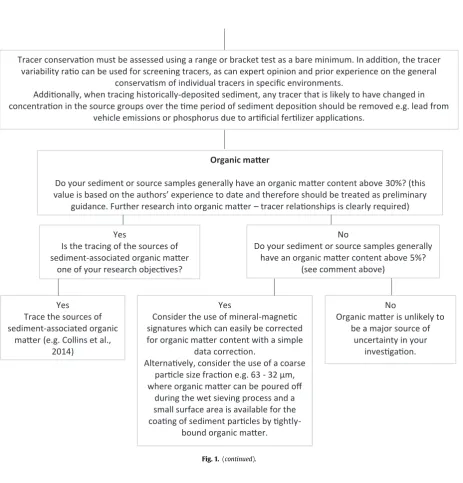
Tracer conserva on must be assessed using a range or bracket test as a bare minimum. In addi on, the tracer
variability ra o can be used for screening tracers, as can expert opinion and prior experience on the general
conserva sm of individual tracers in speci
fi
c environments.
Addi onally, when tracing historically-deposited sediment, any tracer that is likely to have changed in
concentra on in the source groups over the me period of sediment deposi on should be removed e.g. lead from
vehicle emissions or phosphorus due to ar
fi
cial fer lizer applica ons.
Organic ma
Ʃ
er
Do your sediment or source samples generally have an organic ma er content above 30%? (this
value is based on the authors’ experience to date and therefore should be treated as preliminary
guidance. Further research into organic ma er – tracer rela onships is clearly required)
Yes
Is the tracing of the sources of
sediment-associated organic ma er
one of your research objec ves?
No
Do your sediment or source samples generally
have an organic ma er content above 5%?
(see comment above)
No
Organic ma er is unlikely to
be a major source of
uncertainty in your
inves ga on.
Yes
Consider the use of mineral-magne c
signatures which can easily be corrected
for organic ma er content with a simple
data correc on.
Alterna vely, consider the use of a coarse
par cle size frac on e.g. 63 - 32
μ
m,
where organic ma er can be poured o
ff
during the wet sieving process and a
small surface area is available for the
coa ng of sediment par cles by
ghtly-bound organic ma er.
Yes
Trace the sources of
sediment-associated organic
ma er (e.g. Collins et al.,
2014)
Although the steps in this new decision-tree may increase the resource requirements compared with those used by past pub-lished studies, it is our view that adequate recognition must be given to the current state-of-the-art for sediment source
fingerprinting by providing appropriate caveats and/or reporting levels of uncertainty, especially where the results are intended to inform catchment management and sediment mitigation planning.
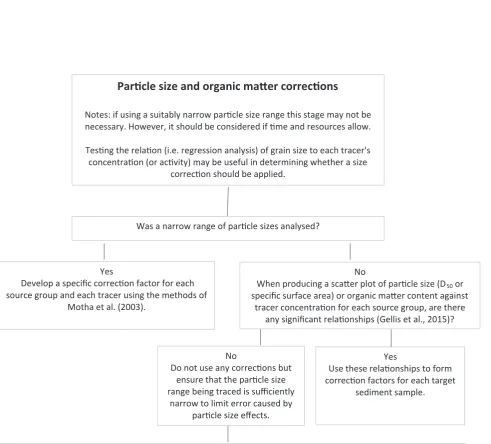
Par
Ɵ
cle size selec
Ɵ
on
Is the par cle size of the target sediment you are tracing in a very narrow size
range e.g. <10
μ
m?
Yes
Use wet sieving/elutria on and repeat
se ling to frac onate your source
samples into the same size range as the
target sediment.
No
Do you have the me and resources to separate your source samples
into a range of narrow par cle size bands e.g. 2-10
μ
m, 10 - 20
μ
m,
etc.?
Yes
Use a par cle size speci
fi
c tracing method
(e.g. Ha ield and Maher, 2009) i.e. repeat
the source group classi
fi
ca on method
with each size frac on and use the frac on
that provides the best tracer variability
ra os / source discrimina on.
Consider the use of a narrow par cle size range
for tracing e.g. <2-10
μ
m 10-20
μ
m 20 - 30
μ
m,
etc.
Use the par cle size distribu on of the sediment
samples to decide on which size frac on best
represents the source material being transported
to and through the study river.
Bear in mind that
fi
ne frac ons are more
chemically ac ve and so may provide be er
discrimina on between land uses or surface and
subsurface source groups. They are, however, also
likely to be more e
ff
ected by non-conserva sm.
Coarse par cles sizes are likely to provide poor
discrimina on between land uses and subsurface
sources but are resistant to chemical changes and
their related non-conserva sm. Therefore, when
categorising source groups by geology, a larger
par cle size frac on may be op mal.
The <63
μ
m size frac on has been
successfully used in the majority of published
source
fi
ngerprin ng studies. It is also
representa ve of the sediment par cle size
transported by most rivers in temperate
climates. Where coarser sediment is
transported it may be appropriate to trace
sand-sized par cles. The use of a
narrower par cle size range than this will
reduce the poten al for par cle size related
uncertain es; however, it may be less
representa ve of the sediment being
transported in a river, and will be more
resource intensive.
No
Notes
It is likely that sediment source discrimina on will be in some way par cle size dependant in many catchments.
For example, sedimentary limestones, chalks and ironstones are likely to have the majority of their calcium and
iron concentrated in very
fi
ne grain sizes, meaning that discrimina on could be weaker in the coarse silt and sand
frac ons than in
fi
ne silts. Addi onally, weathering and soil forma on processes are likely to result in the
preferen al precipita on of weathering products on the large surface areas of
fi
ne silt and clay par cles; as might
the adsorp on of fallout radionuclides take place. Therefore, prior knowledge of the controls on source group
tracer concentra ons combined with objec ve par cle size selec on may be useful for achieving op mal source
discrimina on.
The poten al for par cle size related uncertain es in a tracing methodology is likely to be propor onal to the
range of par cle size selected for analysis. For example, there is far less scope for par cle size change in the <10
μ
m frac on than in the <63
μ
m frac on. Therefore, when using wide par cle size ranges, it is important to
demonstrate that par cle size e
ff
ects have been properly inves gated and, where necessary, accounted for. The
result valida on sec on provides guidance on the use of ar
fi
cial mixtures to demonstrate the range of
uncertainty poten ally caused by par cle size e
ff
ects. It is also good prac ce to compare the par cle size
distribu on of the prepared source samples to the target sediment samples collected from the lake,
fl
oodplain or
river to show if there are signi
fi
cant di
ff
erences between the two.
Par
Ɵ
cle size and organic ma
Ʃ
er correc
Ɵ
ons
Notes: if using a suitably narrow par cle size range this stage may not be
necessary. However, it should be considered if me and resources allow.
Tes ng the rela on (i.e. regression analysis) of grain size to each tracer's
concentra on (or ac vity) may be useful in determining whether a size
correc on should be applied.
Was a narrow range of par cle sizes analysed?
Yes
Develop a speci
fi
c correc on factor for each
source group and each tracer using the methods of
Motha et al. (2003).
No
When producing a sca er plot of par cle size (D
50or
speci
fi
c surface area) or organic ma er content against
tracer concentra on for each source group, are there
any signi
fi
cant rela onships (Gellis et al., 2015)?
No
Do not use any correc ons but
ensure that the par cle size
range being traced is su
ffi
ciently
narrow to limit error caused by
par cle size e
ff
ects.
Yes
Use these rela onships to form
correc on factors for each target
sediment sample.
The conserva sm and discrimina on tests must be performed a er any correc on factors have been applied to
the data as the basis for source discrimina on is very likely to be di
ff
erent for di
ff
erent par cle size frac ons. Due
to par cle size related di
ff
erences in the basis for source discrimina on, these correc on factors may not always
be e
ff
ec ve unless source discrimina on is fully incorporated into the correc on methodology.
The e
ff
ec veness of any developed correc ons must be evaluated during
the "methodology valida on" stage of the procedure. If they do not
improve the accuracy of the tracing they should not be used.
Source group classi
fi
ca
Ɵ
on
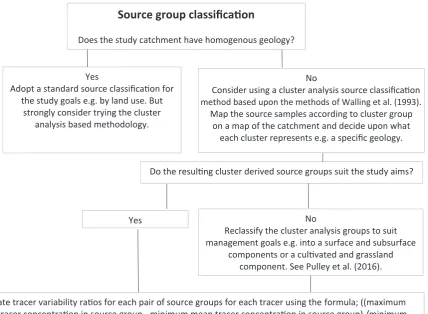
Does the study catchment have homogenous geology?
Yes
Adopt a standard source classi
fi
ca on for
the study goals e.g. by land use. But
strongly consider trying the cluster
analysis based methodology.
No
Consider using a cluster analysis source classi
fi
ca on
method based upon the methods of Walling et al. (1993).
Map the source samples according to cluster group
on a map of the catchment and decide upon what
each cluster represents e.g. a speci
fi
c geology.
Do the resul ng cluster derived source groups suit the study aims?
No
Reclassify the cluster analysis groups to suit
management goals e.g. into a surface and subsurface
components or a cul vated and grassland
component. See Pulley et al. (2016).
Yes
Calculate tracer variability ra os for each pair of source groups for each tracer using the formula; ((maximum
mean tracer concentra on in source group - minimum mean tracer concentra on in source group) /minimum
mean tracer concentra on in either source group) / the mean coe
ffi
cient of varia on (%) of the pair of source
groups.
Are the ra os generally greater than 1.0 meaning that inter-group variability is greater than intra-group
variability? (Pulley et al., 2015a)
Yes
The source groups are likely to be acceptable. However,
consider tes ng if an alterna ve classi
fi
ca on scheme
may improve the variability ra os.
Any tracer with a maximum variability ra o lower than
1.0 should be removed from the procedure at this point.
The threshold of 1.0 can be increased as higher ra os
will result in less uncertainty in the
fi
nal results.
No
The range of uncertainty in your
fi
nal modelling
results is likely to be unacceptably large. Consider
a di
ff
erent source group classi
fi
ca on scheme,
e.g. a di
ff
erent number of clusters or di
ff
erent
modi
fi
ca on of cluster groups.
A smaller number of sediment source groups has been shown to poten ally reduce uncertainty in modelling
outputs. However, fewer groups with a much higher within-source group variability is also likely to increase
uncertainty, so a balance is required. The tracer variability ra o can be used to determine when decreasing the
number of source groups results in a large increase in within- source group variability.
Outliers and misclassi
fi
ed samples
At this point it is appropriate to examine the tracer signatures in the source groups to iden fy any extreme
outlying values or if any source sample is likely to have been misclassi
fi
ed. Outliers may be de
fi
ned such as
greater or less than 3- mes the standard devia on of the mean. Such outliers may introduce greater uncertainty
into the modelling outputs. It will be a ma er of personal judgement as to which source samples to remove.
Obvious outliers should be removed but taking care to maintain the proper range of variability in the source
group samples.
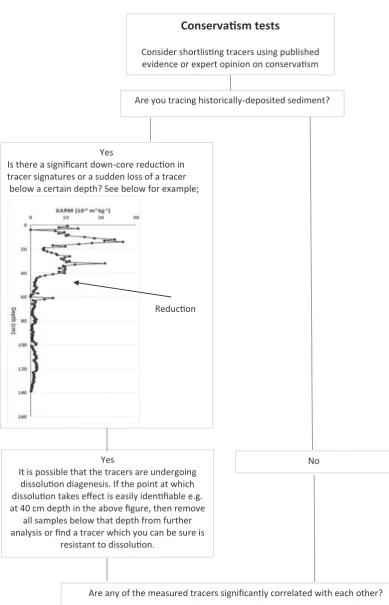
Conserva
Ɵ
sm tests
Consider shortlis ng tracers using published
evidence or expert opinion on conserva sm
Are you tracing historically-deposited sediment?
Yes
Is there a signi
fi
cant down-core reduc on in
tracer signatures or a sudden loss of a tracer
below a certain depth? See below for example;
Reduc on
Yes
It is possible that the tracers are undergoing
dissolu on diagenesis. If the point at which
dissolu on takes e
ff
ect is easily iden
fi
able e.g.
at 40 cm depth in the above
fi
gure, then remove
all samples below that depth from further
analysis or
fi
nd a tracer which you can be sure is
resistant to dissolu on.
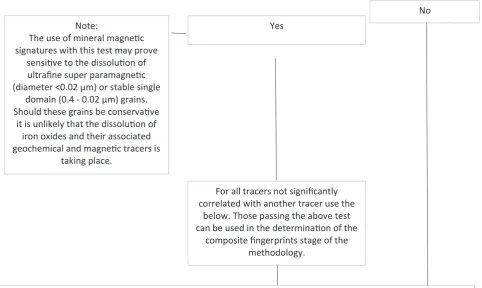
Are any of the measured tracers signi
fi
cantly correlated with each other?
No
Yes
Note:
The use of mineral magne c
signatures with this test may prove
sensi ve to the dissolu on of
ultra
fi
ne super paramagne c
(diameter <0.02
μ
m) or stable single
domain (0.4 - 0.02
μ
m) grains.
Should these grains be conserva ve
it is unlikely that the dissolu on of
iron oxides and their associated
geochemical and magne c tracers is
taking place.
For all tracers not signi
fi
cantly
correlated with another tracer use the
below. Those passing the above test
can be used in the determina on of the
composite
fi
ngerprints stage of the
methodology.
No
Use a conven onal range test. Test with the 0th - 100th and/or 25th - 75th percen le ranges of the source
groups to determine if the tracers in the sediment samples fall within the maximum and minimum values found
in any source group (e.g. Collins et al., 2013c). Repeat using the mean or median values for source and target
sediment samples (e.g. Wilkinson et al., 2013).
Most tracers pass the 25th - 75th
percen le test for most sediment
samples (>95%) and the
means/medians range test.
Most tracers pass the 0th
-100th percen le test for most
sediment samples (>95%) and
the means/medians range test.
Most tracers do not pass the
range tests.
Only take these tracers through
to the next stage of the
methodology. Be aware that your
source groups may not be a good
fi
t to the tracer signatures or
there may be some form of tracer
non-conserva sm not detected
by the range tests.
Only take these tracers through
to the next stage of the
methodology. Be aware that
your source groups may not be
a good
fi
t to the tracer
signatures or there may be
some form of tracer
non-conserva sm not detected by
the range tests.
Revisit your source group
classi
fi
ca on method or
consider if there is a signi
fi
cant
di
ff
erence between the par cle
size or organic ma er content
of your source and target
sediment samples. If tracing
historically- deposited
sediment signi
fi
cant dissolu on
may be taking place.
Source discrimina
Ɵ
on
Consider the use of a number of independent sta s cal tests to iden fy mul ple composite signatures for
discrimina ng the study catchment sediment sources. Consider the use of the Kruskal-Wallis H test, Principal
Component Analysis, cluster analysis and linear discriminant analysis, amongst others.
Consider the use of a two-step process with step one tes ng the ability of each individual tracer to provide some
degree of discrimina on between your source sources using the independent tests such as a Kruskal Wallis
H-test. Consider ranking the results from each test to select the most powerful individual tracers (e.g. Collins et al.,
2012a).
Step two takes the ranked results from each independent test and passes them through Discriminant Func on
Analysis driven by a stepwise algorithm to
fi
nalise the op mum composite signature. Consider driving the
discriminant func on analysis using a gene c algorithm.
Di
ff
erent op mum composite
fi
ngerprints
As we have few ways to validate the outcomes of a
fi
ngerprin ng study, the replica on of the modelling using
mul ple composite
fi
ngerprints comprising di
ff
erent sets of tracers is an important part of the procedure.
Larger composite
fi
ngerprints of tracers have been shown to reduce uncertainty in modelling outputs tested by
the use of ar
fi
cial sediment mixtures. However, this must be balanced with the need to minimise mixing model
errors represented by the di
ff
erence between source-weighted and measured sediment tracer values since
larger
fi
ngerprints will return greater errors using a goodness-of-
fi
t based on absolute error.
Source appor
Ɵ
onment