p r a c ti c e t h r o u g h p r a c ti tio n e r r e s e a r c h . Te a c h e r E d u c a ti o n
Adv a n c e m e n t N e t w o r k Jo u r n al (TEA N), 8 ( 1). p p . 9 4-1 0 5 .
Do w n l o a d e d fr o m : h t t p ://i n si g h t . c u m b r i a . a c . u k /i d/ e p ri n t/ 2 3 8 8 /
U s a g e o f a n y i t e m s f r o m t h e U n i v e r s i t y o f C u m b r i a’ s i n s t i t u t i o n a l r e p o s i t o r y ‘I n s i g h t ’ m u s t c o n f o r m t o t h e f o l l o w i n g f a i r u s a g e g u i d e l i n e s .
Any it e m a n d it s a s s o ci a t e d m e t a d a t a h el d i n t h e U niv e r si ty of C u m b r i a ’s in s ti t u ti o n al r e p o si t o r y I n si g h t ( u nl e s s s t a t e d o t h e r wi s e o n t h e m e t a d a t a r e c o r d ) m a y b e c o pi e d , di s pl ay e d o r p e rf o r m e d , a n d s t o r e d i n li n e wi t h t h e JIS C f ai r d e a li n g g ui d eli n e s ( av ail a bl e h e r e) fo r e d u c a t i o n al a n d n o t-fo r-p r ofi t a c tiviti e s
p r o v i d e d t h a t
• t h e a u t h o r s , ti tl e a n d full bi blio g r a p h i c d e t ail s of t h e it e m a r e ci t e d cl e a rly w h e n a n y p a r t
of t h e w o r k is r ef e r r e d t o v e r b a lly o r i n t h e w ri t t e n fo r m
• a h y p e rli n k/ U RL t o t h e o ri gi n al I n si g h t r e c o r d of t h a t it e m is i n cl u d e d i n a n y ci t a ti o n s of t h e w o r k
• t h e c o n t e n t is n o t c h a n g e d i n a n y w a y
• all fil e s r e q ui r e d fo r u s a g e of t h e it e m a r e k e p t t o g e t h e r wi t h t h e m a i n it e m fil e.
Yo u m a y n o t
• s ell a n y p a r t of a n it e m
• r e f e r t o a n y p a r t of a n it e m wi t h o u t ci t a ti o n
• a m e n d a n y it e m o r c o n t e x t u ali s e it i n a w a y t h a t will i m p u g n t h e c r e a t o r ’s r e p u t a t i o n
• r e m ov e o r a l t e r t h e c o py ri g h t s t a t e m e n t o n a n it e m .
T h e full p oli cy c a n b e fo u n d h e r e.
Citation
Wilson, I.(2016)’ Positive PowerPoint – developing good practice through practitioner research’, TEAN Journal, 8(1), pp.94-105.
94 Positive PowerPoint – developing good
practice through practitioner research
Teacher Education Advancement Network Journal Copyright © 2016 University of Cumbria Vol 8(1) pages 94-105 Ian Wilson
York St John University
Abstract:
This research project aims, through a practitioner research approach, to survey a group of second year undergraduate initial teacher education students about the features of PowerPoint
presentations used within their primary science module. Student surveys were completed at the end of each session and, through the analysis of these responses, key points will be identified that would indicate good practice in the creation of PowerPoint presentations which support and enhance the students’ learning, attention in sessions and their note-taking. The conclusions of this report suggest recommendations not only to the layout, presentation and content of PowerPoint presentations but also to the use of transitions and animations. The findings of this research would be relevant to any practitioner who is delivering information to groups of students via PowerPoint.
Keywords
PowerPoint; presentations; slides; good practice; higher education.
Introduction
Throughout almost all the sessions within the Teaching and Learning Science module, PowerPoint presentations are one of the standard methods for communicating information to the groups of students, complemented with discussions and small group activities. This use of PowerPoint is reflected in many universities and classrooms within higher education (Roehling and Trent-Brown, 2011). The slides are used as a method to structure the sessions, provide information and outline group activities, forming the basis of a ‘highly effective tool to aid learning’ (Faculty Center for Teaching and Learning, 2011). The slides used within these presentations utilise a range of different key features. These features include both background and text colour, images and diagrams and text sizes and fonts. In addition to these features, aspects of the presentation which may influence students’ learning include whether the presentation is completed, the use of transitions between slides and the linear approach of the presentation. How the slides are structured, or whether it is printed off in a paper copy before the session, can also support the students’ note-taking. Indeed, the latter was the starting point of this research after students within the students’ representative meeting requested that PowerPoint presentations were available before sessions. This research project aims, through a practitioner research approach, to survey a group of students about the features of PowerPoint presentations and through the analysis of their responses, develop a more positive PowerPoint experience leading to establishing key points that would indicate good practice in the creation of PowerPoint presentations which support and enhance the students’ learning,
attention in sessions and their note-taking.
RESEARCH
95 Literature Review
PowerPoint presentations are now used throughout the world with millions of them being presented globally per day (Simons, 2005) with their use being recognised as an excellent way to present a lecture (Adams, 2007). Before the extensive use of PowerPoint, slides were in the form of transparencies, but as the use of PowerPoint has been developed, more and more presentations utilise this programme. Research indicates that students studying Social Psychology in the University of Texas (n=39), when exposed to the use of both transparencies and PowerPoint presentations over time, preferred the use of PowerPoint type presentations over other methods by the end of the study (Bartsch and Cobern, 2003). Jones’ (2003) own personal view is that PowerPoint presentations allow presenters to deliver large amounts of content to large groups of students in a limited time period, and the appropriate use of PowerPoint presentations can enhance the learning experience. However, Apperson, Laws and Scepansky (2006b) whose research was centred on psychology students (n=279) attending Longwood University in America, concluded that although presentations facilitated
learning, this improvement was not reflected in the final quiz scores of students. Indeed Giles and Baggett (2008) reported that the scores of students on American preservice teaching programmes were significantly lower than a group being taught with colour transparencies.
One conclusion of research conducted by Yilmazel-Sahin (2009) involving students from the University of Washington studying Applied Linguistics was that lectures supported by PowerPoint slides can be delivered too quickly and present too much information. Although this could be recognised as a reflection of the presentation itself, this could also be the result of the presentation style of the tutor. Students can also feel ‘insulted’ when the contents of slides are just read to them (Voss, 2004). This has been recognised as a common error of presenters by Maxwell (2007) while working with students studying History in New Zealand. Lecturers can focus too much on the presentation, making the students feel ignored, and even prevent interaction (Voss, 2004), and the use of PowerPoint can be attributed to a major contribution to the ‘boredom’ of lectures (The Guardian, 2009).
Studies have started to identify that the ‘linear’ approach use of PowerPoint presentations may be challenging the students’ learning but not being representative of the students’ current forms of communication (Craig and Amernic, 2006). This linear approach can be recognised as both a strength and a weakness. Adams (2007) reported that the final presentation is often a product of the lecturer’s own thought process and, because of this, allows minimal variation from the original structure when delivered in sessions. Presentations of this type can lead to reduced classroom interaction (James, Burke and Hutchins, 2006) leading to a decrease in spontaneity and discussion (Yilmazel-Sahin, 2009). Adams (2007) does, however, stress the need to disconnect from the presentation to engage in discussion when necessary and Keefe and Willett (2004) encourage the use of hyperlinks within the slides to allow navigation when required allowing the students to dictate the structure of the presentation, allowing them to move away from the linear approach.
According to the study completed by Apperson, Laws and Scepansky (2006b), students perceive lecturers who use PowerPoint presentations as more organised and providing better explanations than lecturers who use other means of presenting the information; students in these sessions reported a more positive attitude to their education. This may not be solely due to the use of a PowerPoint presentation as lecturing style can also affect the students’ level of enjoyment (Bartsch and Cobern, 2003) and the ability of the lecturer to use PowerPoint effectively.
Many studies have been completed researching the influence of the format of slides, including text and colour, on students’ learning and attention. Clark (2008), through her research with history degree students in Australia (n=46), reported that students respond positively to PowerPoint
96 identity for the module, although this may lead to monotonous presentations (Jones, 2003; Voss, 2004). Headings allow main ideas to be presented and form the basis of discussion (Lanius, 2004). Holzl (1997) recognises the use of viewable text sizes (specifically between 32 and 36 point font for headings and 24 and 28 point for text and Berk (2011), studying level one English students at the University of Wolverhampton, recommends the use of a sans serif font, such as Arial. This is further supported by James, Burke and Hutchins (2006) who also recommend the left justification of text on the slide. When discussing the criteria for an effective PowerPoint presentation, Holzl (1997) states that colour schemes should be consistent and the contrast should make the text distinguishable from the background. Apperson, Laws and Scepansky (2006a) support this stating that any colour
background is preferable, although white and bright or dark colours are unacceptable due to the high contrast being difficult to read by dyslexic students. When introducing best practice for the use of PowerPoint presentations, Berk (2011) also recommends pastel background colours, essentially blue or green with yellow, orange or red text.
Research shows that students prefer key phases outlined and discussed further by the lecturer (Apperson, Laws and Scepansky, 2006a). Jones (2003) supports this by recommending avoiding more than six lines of text and fading previous lines of text out to encourage the audience to concentrate on the current item being discussed. Appropriate use of graphics, no more than two per slide as a general rule (Jones, 2003), and images should be included in presentations although studies show that students recall more facts from slides with relevant images or with only text. The use of unrelated graphics can however provide a negative effect on the students’ learning (Armitage, 2008). Bratsch and Cobern (2003) reported that irrelevant images can produce more of a distraction and are not supportive of the students’ learning with Holzl (1997) stating that sound and video should only be added to support the educational purpose. Adding a single image that highlights or identifies a specific point is recommended and irrelevant images should be avoided (Berk, 2011). Transitions and animations can reduce the audience’s attention leading to what Voss, 2004, identities as student frustration and should only be added in order to enhance the audience’s learning (Holzl, 1997) but avoid being used excessively (Jones, 2003). Berk (2011) however, recommends that transitions used consistently can be effective.
When considering the effect on students’ learning of providing PowerPoint slides in handout form, Apperson, Laws and Scepansky (2006a) states that students prefer their handouts to have the
graphics included although there was no indication on the effect of handouts improving their learning contrasting with James, Burkes and Hutchins (2006) whose research showed that handouts helped the students to study. In both cases, however, the availability of these notes before the lectures would not decrease class attendance. Roehling and Trent-Brown (2011), researching the use for undergraduate (lower) and graduate (upper) programmes, concluded that with lower level courses, the availability of the presentations supported the students’ organisation and conveyed the important information of the course while lecturers rarely presented handouts for the upper courses. However in both cases the quality of note taking was improved. The addition of numbers on slides can also support note taking (Jones, 2003).
In conclusion, PowerPoint presentations should be used to complement already well-designed lectures (Maxwell, 2007; Jones, 2003) and support learning experiences with the emphasis on pedagogy (Vallance and Towndrow, 2007). Where there is an emphasis on content, PowerPoint presentations can be used to enhance learning in contrast to sessions where discussions and critical thinking are essential where PowerPoint should be used less (Roehling and Trent-Brown, 2011). Indeed if lecturers in Initial Teacher Education deliver in this way without consideration of discussion and interaction, they can expect this model to be used within the classrooms (Vallance and
RESEARCH
97
Methodology and methods
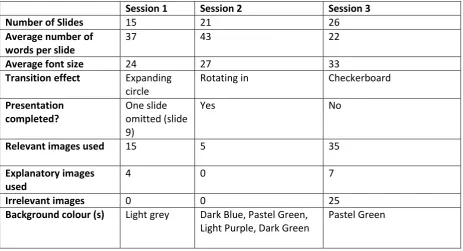
Practitioner research was the methodology used for this project completed over a period of one month (March 2012 – April 2012). Menter et al (2011, p4) define practitioner research as ‘…being completed within the researcher’s own practice’, seeking to improve and develop this practice. The research aimed to survey the responses of the participants through the use of questionnaires in order to ascertain their preferences to a range of key features of presentations. These key features were established through the literature review. Alterations would be made to these features within three subsequent presentations and the responses from the participants analysed. These alterations would include the total number of slides within the presentation, the background colour, the font size, transitions and number of both relevant and irrelevant images being altered each time. Figure 3 details the features of each presented, including the background colour used.
Participants were thirty second year undergraduate students completing the Primary Education Honours degree programme. The data was collected in the form of a questionnaire completed by the participants during and at the end of sessions from the Teaching and Learning Science module (2QTS40). The group of students were selected because a good working relationship had been established between the tutor and the group and this helped to promote a higher degree of
involvement and participation from the group, as well as the group being a small group that would be representative of my work in other modules (McNiff and Whitehead, 2010). The questionnaire consisted of a series of questions based on the key features of PowerPoint slides identified through previous research. The participants were then surveyed to ascertain how these key features impacted on their ability to engage with the presentation. This focused on the features of font size, background colour and whether the transitions and images were distracting. The questionnaires also collected responses indicating how these features impacted on the student’s ability to take notes. Additionally there were questions relating to the impact of providing a printed version of the presentation before the session. This was due to a department discussion at the time of the research and it was
considered appropriate to include this question within the survey. A six point Likert scale was used to measure the students’ responses. This would be completed on paper rather than an electronic version.
Permission for the research was obtained from the Ethics Committee in accordance with university requirements. The students involved were informed of the research at the beginning of the study, in accordance with British Educational Research Association guidelines (BERA, 2011) and students had the ‘right to withdraw’ by not completing the questionnaire within sessions. This was communicated to the students in the first session. All questionnaires remained anonymous throughout. This
anonymity also meant however that individual responses could not be identified and monitored.
The time period available for this small-scale research project influenced many of the choices.
Although initially the research was to cover all aspects of PowerPoint presentations the time available meant that the research had to be more focussed and address key features of slides. These were identified from established research. In order for the students to maintain a positive attitude towards the questionnaire, a time period of one month was selected with sufficient gaps between the sessions to ensure that the students maintained interest in the research contributing to the validity of the results. Retrospectively, the research could have been completed throughout the year, which would have provided more opportunity to discuss and alter the slides as well as allowing opportunities for interviews to increase the depth of the responses.
98 students, e.g. the students on the lower programme studying to teach reception and key stage 1 children or the postgraduate groups.
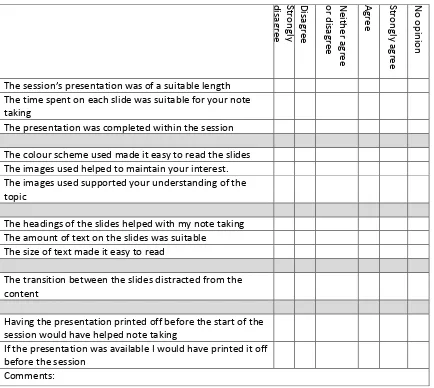
It is recognised that the wording of the questionnaire used (Figure 1) was important and that any questionnaire should be piloted before use (Oppenheim, 1992). The time constraints of this research project meant that it was not possible to design and pilot a questionnaire, so it was decided to adapt questions from the ‘PowerPoint Feedback Survey’ from Polyakova-Norwood’s article (2009). The additional questions relating to the downloading of the presentation to support note taking would be asked in every session and it was assumed that the response to this question would remain
unchanged. Because of this they were considered the least important questions and so, in accordance to research presented by Redline et al (2002), these were positioned at the end of the questionnaire. In order to remove the element of challenge, the students were allowed to complete the
questionnaires throughout the session, encouraging them to discuss their responses (Strange et al, 2003 cited in Cohen, Manion and Morrison, 2011) and clear verbal instructions were provided initially to accompany the questionnaire (Cohen, Manion and Morrison, 2011). It is recognised that, although allowing the students to discuss their responses to the questions could impact on the responses, it was allowed in order to encourage the participants to clarify their views before entering their responses. The advantages of the questionnaire were that the questions were standardised and provided consistency for the analysis and anonymity (Denscombe, 2010; Munn and Drever, 1999). It is accepted that an on-line form of the questionnaire could have reduced the impact of human error when analysing the data (Denscombe, 2010) and that students prefer to complete online forms (Koshy, 2010) but it was decided that completing the questionnaires within the session would capture their immediate reaction, rather than a more reflective response and it ensured a higher response rate. Some students did initiate brief informal interviews to discuss what they had added to the comment section to the questionnaire. However, the use of interviews either with individuals or in small groups was considered overall to be too time consuming. Although interviews would have produced a more detailed response to the questions and also would have allowed the research to extend the depth of the students’ answers, as well as identifying unpredictable areas of interest, the time was not available to complete these interviews (Koshy, 2010). Interviewing the participants in groups could have supported the findings.
RESEARCH
99
Figure 1. Questionnaire.
Findings
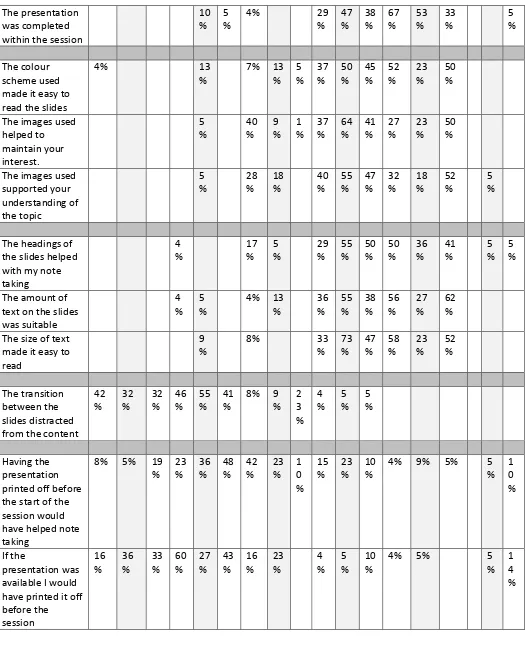
Percentages may not total 100% due to rounding. A summary of the findings will be presented first with a more in depth discussion of each point after. Below Figure 2 shows a summary of responses for PowerPoint presentations and Figure 3 in the Findings shows feature of presentations for each session. Stro n gly d isag ree D isag ree N either agr ee o r di sag re e Ag ree Stro n gly ag ree N o o p in io n
The session’s presentation was of a suitable length The time spent on each slide was suitable for your note taking
The presentation was completed within the session
The colour scheme used made it easy to read the slides The images used helped to maintain your interest. The images used supported your understanding of the topic
The headings of the slides helped with my note taking The amount of text on the slides was suitable
The size of text made it easy to read
The transition between the slides distracted from the content
Having the presentation printed off before the start of the session would have helped note taking
If the presentation was available I would have printed it off before the session
Comments: Stro n gly d isag ree D isag ree N either ag ree o r d isag ree Ag ree Stro n gly ag
ree No o
p
in
io
n
Session 1 2 3 1 2 3 1 2 3 1 2 3 1 2 3 1 2 3
The session’s presentation was of a suitable length 9 % 12 % 5 % 54 % 65 % 59 % 35 % 30 % 32 %
100
Figure 2. Summary of Responses for PowerPoint Presentations.
The presentation was completed within the session
10 %
5 %
4% 29
% 47 % 38 % 67 % 53 % 33 % 5 % The colour scheme used made it easy to read the slides
4% 13
%
7% 13 % 5 % 37 % 50 % 45 % 52 % 23 % 50 %
The images used helped to maintain your interest. 5 % 40 % 9 % 1 % 37 % 64 % 41 % 27 % 23 % 50 %
The images used supported your understanding of the topic 5 % 28 % 18 % 40 % 55 % 47 % 32 % 18 % 52 % 5 %
The headings of the slides helped with my note taking 4 % 17 % 5 % 29 % 55 % 50 % 50 % 36 % 41 % 5 % 5 %
The amount of text on the slides was suitable
4 %
5 %
4% 13 % 36 % 55 % 38 % 56 % 27 % 62 %
The size of text made it easy to read
9 %
8% 33
% 73 % 47 % 58 % 23 % 52 % The transition between the slides distracted from the content
42 % 32 % 32 % 46 % 55 % 41 %
8% 9 % 2 3 % 4 % 5 % 5 % Having the presentation printed off before the start of the session would have helped note taking
8% 5% 19
% 23 % 36 % 48 % 42 % 23 % 1 0 % 15 % 23 % 10 %
4% 9% 5% 5
% 1 0 % If the presentation was available I would have printed it off before the session 16 % 36 % 33 % 60 % 27 % 43 % 16 % 23 % 4 % 5 % 10 %
4% 5% 5
RESEARCH
101
Session 1 Session 2 Session 3
Number of Slides 15 21 26
Average number of words per slide
37 43 22
Average font size 24 27 33
Transition effect Expanding
circle
Rotating in Checkerboard
Presentation completed?
One slide omitted (slide 9)
Yes No
Relevant images used 15 5 35
Explanatory images used
4 0 7
Irrelevant images 0 0 25
Background colour (s) Light grey Dark Blue, Pastel Green,
Light Purple, Dark Green
Pastel Green
Figure 3. Features of presentations for each session – average scores are rounded
Summary of findings
Suitable length for presentations over a two hour session is between 15 -27 slides, spending on average four minutes per slide.
All slides should be viewed and discussed with no slides being omitted or ‘flicked over’. Pale green background colour to the slides with black text is preferred
Additional images on slides, whether these are relevant to the subject or not, help to maintain interest in the presentation.
Explanatory images on slides support the students’ understanding of the topic.
Headings should be used on slides to support note taking.
On average a maximum of 37 words should be used on slides and a font size of 33 is easiest for students to read.
Transitions between the slides does not distract from the content.
Students would not print presentations off before sessions and having a paper copy of the presentation would not support note-taking.
Overview of presentation
The results show that despite altering the number of slides within the presentation the majority of participants agreed or strongly agreed that fifteen to twenty seven slides was of a suitable length. Similarly when the average amount of time spent on each slide was examined, the majority of participants agreed or strongly agreed that this was suitable for note-taking. 100% of the participants felt that on average four minutes per slide was suitable. There was a significant change in the
students’ responses when the presentation was not completed. When one slide was omitted, 100% of responses still agreed or strongly agreed that the presentation was completed. However, when the four slides were quickly flicked through at the end of the final session, only 71% of students agreed that it was completed, while 29% responded differently, including 19% who strongly disagreed.
Colour scheme and images
102 73% when darker colours and a higher degree of contrast was introduced. When a pastel green background was used with black text the agree/strongly agree response rose to 95%. This was the scheme that recorded the most positive response.
When examining the effects of images on helping to maintain their interest throughout the presentation, the final session surveyed produced the highest agree/strongly agree response rate (91%). This slide show also had the most irrelevant images within it (one per slide). Although these images were not relevant to the session they did help to maintain the students’ interest in the
presentation and this was reflected in the additional comments. As the number of explanatory images increased within the presentations the response of the participants demonstrating that these
supported their understanding of the topic also increased with the final presentation, which used a total of seven explanatory images, producing a 99% agree/strongly agree response rate.
Headings and text
In all cases the results show that headings helped their note-taking (79% - 91% agree/strongly agree). The results for the amount of text suitable on the slides suggest that between an average of 22 to 37 words per slide is suitable. When the average number rose beyond this (43 words on average) the lowest agree/strongly agree response rate was recorded (82%). An increase in font size is
accompanied by an increase in the agree/strongly agree response rate, with the average font size of 33 producing 100% agree/strongly agree response.
Transitions/printing off presentations
When responding to the question concerning the transition between the slides distracting from the content, only 4% and 5% agree/strongly agree response rate was recorded, suggesting that no distraction was evident. Similarly only 19%, 32% and 15% of students responded with agree/strongly agree when asked whether having a printed copy of the presentation would aid their note taking and 8% and 10% responded to printing off the presentation before the session. When the additional comments were analysed the students referred to the cost involved and the use of paper for this stating that electronic versions on Moodle would be utilised.
Discussion of Findings
The range of the number of slides within the presentations that the students preferred was similar to the range (5 to 30+) recommended by the Burke and Apperley (2003-4). Although the students responded negatively to the presentation not being completed, which supports the research completed by Yilmazel-Sahin (2009), no one commented about the linear approach of the presentations (Craig and Amernic, 2006). When examining the composition of the sessions it is recognised that this is not based solely on the presentation but involves opportunities for discussion and activities. This would support the work completed by Adams (2007) who stressed the need to disconnect from the presentation. This could account for the lack of comments about the linear approach of the presentations. Also, although not recorded, slides were not always viewed in the designed order, in response to the students’ enquiries. In order to fully discuss this, these data would need to be collected.
RESEARCH
103 response may have been recorded. The students’ positive responses to the use of relevant and
explanatory images is in agreement with the prior research (Jones, 2003; Berk, 2011).
Even though literature supports that transitions and animations reduce audience attention (Mason and Hlynka, 1998) this was not apparent in the results. It could be possible that due to the
presentation not being the only method of presenting the information (discussions and activities were also present) that the transitions were not noticed or did not impact on the students’ learning. As a lecturing style, the slide transition was completed while discussing a previous point or while activities were being completed.
Students responded that hand-outs would not aid their note taking, contrary to the work completed by James, Burkes and Hutchins (2006). This may reflect the fact that the session was not solely focused on the presentation and that the students were aware that the presentation would be available electronically afterwards. However, if the hand-outs were provided, which would remove the cost implications mentioned by the respondents, the quality of the note-taking may improve (Roehling and Trent-Brown, 2011). The use of headings did, however, support note taking which agrees with Apperson, Laws and Scepansky (2006a) as these headings were used to identify the key points and provide a focus for discussion. The use of storyboards is recommended as an effective way of planning presentations (Vik, 2004) and if these were used to plan the presentation, presenting these to the students could allow them to see the thought processes and links in the thinking and further support their note-taking.
Conclusions
Through the use of practitioner research, PowerPoint presentation was altered taking into account the responses recorded in the questionnaires. These alterations provided the beginnings of a list of criteria that could be considered good practice. It is recommended that presentations uploaded to the institution’s virtual learning environment before sessions would not be significantly downloaded by students, although due to the nature of the sample, these findings could only be considered as appropriate for the limited population. In order to further validate these attributes, it would be necessary to increase the sample size to include a more varied distribution across the population. There are also many other aspects of PowerPoint presentations that were not considered in this small-scale project. Although PowerPoint presentations may form the basis of many sessions, it is how the presenter interacts with these that may have a greater impact on the students’ learning. The amount of time spent on slides in relation to the amount of text could impact both on note taking and understanding of concepts and the order of the slides and linear/non liner nature of presentations would need to be considered as a way of promoting interaction and critical thinking. The impact on students’ learning and discussion of an image only presentation could be researched, and how these promoted both discussion and critical thinking. Both of these methods of creating presentation could be beneficial for re-validation as the enquiry-based learning becomes a key part of sessions.
In conclusion, from the results from this project it is apparent that aspects of PowerPoint presentations can be considered good practice and these can have an impact on both student
learning and interaction. However, perhaps it is more important to remember that PowerPoint is only one of the presentation tools available to lecturers and that teaching is often judged by the lecturers’ ability to use PowerPoint effectively (Clark, 2008). Although PowerPoint often forms the basis of sessions it should be used as ‘an enhancement and not a replacement for effective communication’ (McDonald 2004, p161).
Reference List
104 Apperson, J.M., Laws, E.L. and Scepansky, J.A. (2006a) ‘An assessment of student preferences for
PowerPoint presentation structure in undergraduate courses’, Computers and Education, 50 (1), 148 – 153.
Apperson, J.M., Laws, E.L. and Scepansky, J.A. (2006b) ‘The impact of presentation graphics on students’ experience in the classroom’ Computers and Education, 47 (1), 116-126. Armitage, S. (2008) PowerPoint and Students’ Learning – Briefing paper[Internet] Lancaster
University. Available from : <
http://www.lancs.ac.uk/celt/celtweb/files/Powerpoint%20and%20student%20learning%20final .pdf> [Accessed 25th July 2012].
Bartsch, R.A. and Cobern, K.M. (2003) ‘Effectiveness of PowerPoint presentations in lectures’, Computer and Education, 41, 77-86.
BERA (2011) Ethical Guidelines for Educational Research, British Educational Research
Association.Available from:
https://www.bera.ac.uk/wp-content/uploads/2014/02/BERA-Ethical-Guidelines-2011.pdf?noredirect=1 [Accessed 21st December 2015]
Berk, R.A. (2011) ‘Research on PowerPoint: From Basic Features to Multimedia’, International Journal of Technology in Teaching and Learning, 7 (1), 24-35.
Bond, T.G. and Fox, C.M. (2007) Applying the Rasch model – Fundamental Measurement in the Human
Sciences2nd ed. New Jersey: Lawrence Erlbaum Associates.
Burke, D. and Apperley, A. (2003-4) ‘PowerPoint and Pedagogy. Learning and Teaching Projects 2003/4’, Centre for Learning and Teaching, University of Wolverhampton, 77-81.
Clark, J. (2008) ‘PowerPoint and Pedagogy – Maintaining Student Interest in University Lectures’, College Teaching, 56 (1), 39-45.
Cohen, L., Manion, L., Morrison, K. (2011) Research Methods in Education, 7th ed. Oxon: Routledge. Craig, R.J. and Amernic, J.H. (2006) ‘PowerPoint Presentation Technology and the Dynamics of
Teaching’, Innovative Higher Education, 31, 147-160.
Denscombe, M. (2010) The Good Research Guide for small –scale social research projects 4th ed. Maidenhead: McGraw-Hill Education.
Faculty Center for Teaching and Learning (2011) ‘Effective Use of PowerPoint’[Internet] Available from:
http://www.fctl.ucf.edu/teachingandlearningresources/technology/PowerPoint/index.php [Accessed 19th February 2012].
Giles, R. M., and Baggett, P.V. (2008) ‘Investigating Technologies in Teacher Education: Does PowerPoint Enhance Retention or Influence Attitudes?’ STRATE Journal, 17 (1), 44-52. Hartley, J. and Betts, L.R. (2010) ‘Four layouts and a finding: the effects of changes in order of the
verbal labels and numerical values on Likert-type scales’, International Journal of Social Research Methodology, 13 (1) February, 17-27.
Holzl, J. (1997) ‘Twelve tips for effective PowerPoint presentations for technologically challenged’, Medical Teacher, 19 (3), 175-179.
James, K.E., Burke, L.A., Hutchins, H.M. (2006) ‘Powerful or Pointless? Faculty Versus Student Perceptions of PowerPoint Use in Business Education’, Business Communication Quarterly, 69(4) December, 374-396.
Jones, A.M., (2003) ‘The use and abuse of PowerPoint in Teaching and Learning in the Life Sciences: A Personal Overview’ [Internet] Bioscience Education . Available from:
http://www.bioscience.heacademy.ac.uk/journal/vol2/beej-2-3.aspx [Accessed 16th February 2012].
Keefe, D.D., and Willett, J.D. (2004) ‘A Case for PowerPoint as a Faculty Authoring System’, Cell Biology Education, 3, 156-158.
RESEARCH
105 Lanius, C. (2004) ‘PowerPoint, not Your Grandmother’s Presentations, but Is it Evil?’ Cell Biology
Education, 3, 158-160.
Maxwell, A. (2007) ‘Ban the Bullet-Point! – Content-Based PowerPoint for Historians’, The History Teacher, 41(1) November, 39-54.
Mason, R. and Hlynka, D. (1998) ‘PowerPoint’ in the classroom: Where is the Power?’ Education Technology. Available from:
http://www.umanitoba.ca/centres/ukrainian_canadian/hlynka/papers/ppt_point.html [Accessed 23rd August 2012].
McDonald, K. (2004) ‘Examining PowerPointlessness’, Cell Biology Education, 3, 160-161.
Menter, I., Elliot, D., Hulme, M., Lewin, J. and Lowden, K. (2011) A guide to practitioner Research in Education. London: Sage.
McNiff, J. and Whitehead, J. (2010) You and your action research 3rd ed. Oxon: Routledge. Munn, P. and Drever, E. (1999) Using Questionnaires in small- scale research – A teachers’ guide.
Edinburgh: Scottish Council for Research in Education.
Oppenheim, A.N. (1992) Questionnaire design, interviewing, and attitude measurement 2nd ed. London: Continuum.
Polyakova-Norwood, V. (2009) ‘Waking up from “PowerPoint-Induced Sleep”:Effective Use of PowerPoint for Teaching’, USC College of Nursing. Available from:
<http://www.sc.edu/cte/polyakova-norwood/doc/handout.pdf [Accessed 18th April 2012]. Redline, C.D. et al (2002) ‘Factors that Influence Reading and Comprehension in Self-Administered
Questionnaires’ Available from:
http://www.sesrc.wsu.edu/dillman/papers/2003/factorsthatinfluencereading.pdf [Accessed 25th July 2012].
Roehling, P.V. and Trent-Brown, S. (2011). ‘Differential use and benefits of PowerPoint in upper level versus lower level courses’, Technology, Pedagogy and Education, 20 (1) March, 113-124. Schwarz, N et al (1991) ‘Rating Scales – Numeric values may change the meaning of scale labels’,
Public Opinion Quarterly, 55, 570-582.
Simons, T. (2005) ‘Does PowerPoint make you stupid?’[Available from:
http://fp.arizona.edu/kkh/dendro/PDFs.Tufte/Does%20PowerPoint%20Make%20you%20Stupi d.pdf> [Accessed 30th July 2012].
The Guardian(2009), News [Internet], May 2009, Available from:
http://www.guardian.co.uk/education/2009/may/12/university-teaching [Accessed 30h May 2012].
Vallance, M. and Towndrow, P.A. (2007) ‘Towards the ‘informed use’ of information and
communication technology in education: a response to Adams’ PowerPoint, habits of mind and classroom culture’, Journal of Curriculum Studies, 39 (2), 219-227.
Vik, G. N. (2004) ‘Breaking Bad Habits: Teaching Effective PowerPoint Use to Working Graduate Students’, Business Communication Quarterly, June 225-228.
Voss, D. (2004) ‘PowerPoint in the Classroom, is it Really Necessary?’ Cell Biology Education, 3, 155-156.